Author: FourPillars
Compiled by: AididiaoJP, Foresight News
Key Findings
Collector Crypt (CC)'s net margin decreased from 11.2% in Q3 2025 to 5.6% in Q2 2026, while GMV grew 4.7x during the same period. This growth primarily came from the $250, $1,000, and $2,500 card pack tiers, which have lower platform retention per dollar compared to lower-tier packs.
The $2,500 Mythic tier, launched just 13 days ago, accounted for 36.7% of June's GMV. Average spending per user increased significantly from October 2025 to June 2026, indicating growth is driven by high-spending users and frequent wallets, not a broadening user base.
Physical redemptions consumed 41.6% of May's pre-burn net revenue. On-chain data shows that in June, among approximately 6,000 depositing users, only 75 wallets redeemed physical cards, with the top four redeemers accounting for 47.1% of user-burned cards.
In scenario modeling, CC's economic model turns negative when any two of the following three pressures occur simultaneously: inventory replenishment costs approaching market price, redemption rates exceeding 9%, and high-tier buyback rates remaining around 93%.
Cumulative partner revenue is only $1.83 million, mostly Moonbirds-related. The API and distribution strategy have not yet proven the ability to generate subscription-style, low-inventory revenue, as publicly verifiable integrations remain highly reliant on CC providing cards, vaults, fulfillment, and buyback services.
Introduction
CC presents itself as an on-chain collectibles marketplace, but data suggests its core product is repetitive card pack opening cycles, instant buybacks, a weak secondary market, limited token value accrual, and a small number of high-frequency wallets driving activity.
Since our last report, CC added approximately $94 million in GMV in ten days, with cumulative GMV reaching $728.9 million as of June 23rd. Buybacks returned $662.7 million to users, net revenue was $47.5 million, the newly launched $2,500 Mythic tier accounted for 36.7% of June's GMV in just 13 days, and Q2 physical redemptions reached $8.9 million, exceeding the total of the previous four quarters.
CC can continue to increase GMV by having users purchase larger packs, recycling cards into the vault, and keeping funds circulating via turbo buybacks. However, these channels now pressure platform retention.
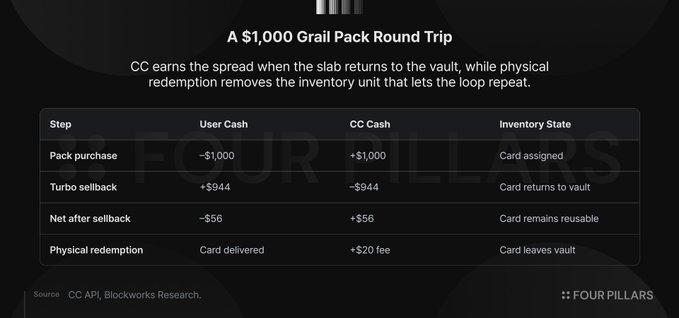
Take the $1,000 Grail pack as an example: a user pays $1,000, receives a pool of cards with an expected insured value of ~$1,015, sells them back via turbo at ~93% for ~$944 in return. CC retains ~$56, while the cards return to the vault, ready to be re-assigned, bought back, and generate a new spread. The cards effectively act as working capital within the product cycle.
The remainder of the article revolves around three pressure points:
- Higher denomination tiers boost GMV but lower overall retention.
- Physical redemptions transform reusable cards into replenishment demand.
- Partner integrations expand distribution, but proven cases still leave the inventory, fulfillment, and buyback burden on CC.
CC can continue to show larger gross numbers by having users keep moving up to larger packs, but the bottleneck is whether it can retain enough of each dollar when cards must continuously cycle, funds must keep flowing, and partner distribution still relies on CC's operational layer.
CC's Net Margin Halved as Volume Shifts to Higher-Tier Packs with Lower Retention
The fastest way for CC to increase GMV is to launch larger packs. The platform retention for $25 and $50 packs is 9% to 11%, ~7% for the $250 tier, ~5.6% for the $1,000 Grail tier, and 6.4% for the $2,500 Mythic tier.
From January to April, the $250 and $1,000 tiers consistently contributed three-quarters or more of monthly GMV, until the Mythic tier captured the next wave of high-value transactions in June. A few heavy wallets recirculating $1,000 and $2,500 packs can generate more reported activity than thousands of small casual users, while paying a lower loss rate per dollar.
The platform gains scale, users experience slower capital drain, and the overall gross margin trends towards that of the largest tiers.
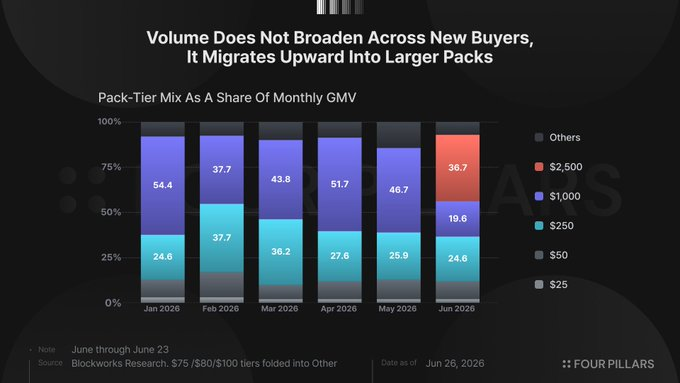
Mythic launched on June 10th, generating $59.3 million GMV in its first 13 days. The $1,000 tier's share of GMV dropped from 46.7% in May to 19.6% in June, while Mythic took nearly 36.7% almost immediately. This shift required no new collecting habits, deeper secondary markets, or new physical demand—just allowing users already willing to cycle capital at scale through random packs to use a higher-denomination ticket.
A $5,000 Celestial tier exists in CC's API but has no inventory, providing another step for the platform to push the same model further.
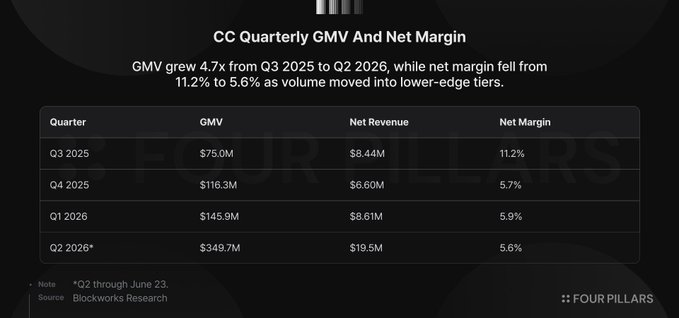
Q3 2025 generated $75 million GMV with an 11.2% net margin; Q2 2026 (as of June 23rd) generated $349.7 million GMV with a 5.6% net margin. GMV grew 4.7x, but net revenue only grew 2.3x. CC processed far more activity than before but kept a smaller share of each dollar.
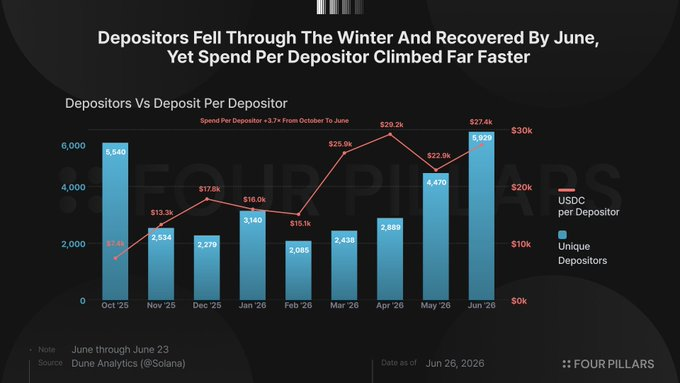
User data confirms the same migration at the wallet level. Depositing users fell from 5,540 in October to 2,438 in March and 2,889 in April, while average spending per user rose to $25,856 and $29,247 respectively during the same period. Depositing users rebounded to 5,929 in June, but average spending remained high at $26,968—over 3.6x the October level. The platform isn't simply adding users; it's pushing more money through each active depositing user, with the clearest signal in March and April when user counts fell but spending per user hit series highs.
A breakdown of wallets over the past 90 days further corroborates this. 25 wallets averaging over 1,000 transactions per day and 139 wallets averaging 100-999 transactions per day together contributed 76.9% of total transaction volume. The single highest wallet deposited $34.6 million and completed 241,120 transactions over 76 days. However, CC's yolo pack feature allows users to batch-open dozens of packs in one session, with each pack generating a separate on-chain transaction, meaning a single user action can generate dozens of recorded transactions.
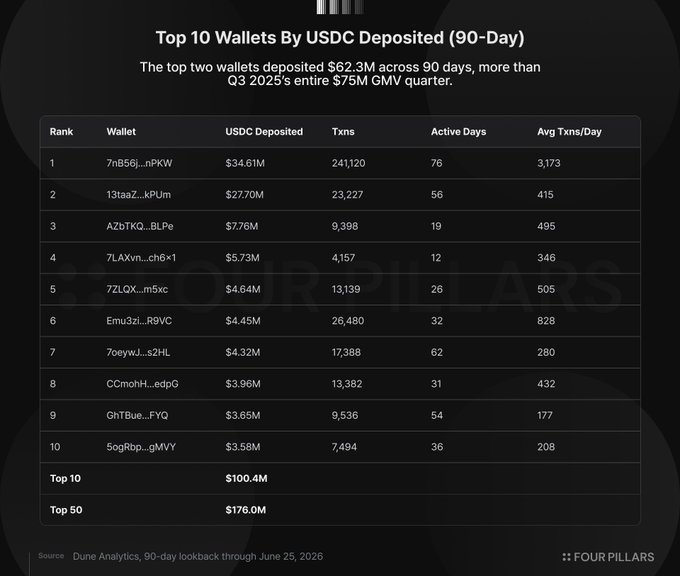
Among the top 10 depositing users ranked by USDC transaction volume, 7 had zero Metaplex Core interactions with the CC collection in June—meaning no card burning, transfers, or other on-chain card activity besides pack opening and buybacks. Three wallets showed minimal Core activity: GhTBue had 6 transactions, AZbTKQ had 5, and 7LAXvn had 1, totaling just 12 interactions versus over 365,000 pack transactions.
These users are useful for reported transaction volume but less so for gross margin retention. They cycle capital through packs and buybacks but do not redeem physical cards, trade on secondary markets, or build collections. Each new tier provides them more capacity to push capital through the part of the core structure with the lowest retention.
The group that actually redeems is entirely different. Only 75 user wallets burned cards in June, a tiny fraction of the over 6,000 depositing users, with the top four user redeemers accounting for nearly half of user-burned cards. CC's transaction volume and inventory consumption are driven by two groups with opposing behaviors. One group generates throughput at thinner gross margins, while the other creates inventory replenishment demand, making the cycle more expensive to sustain.
Physical Redemptions Consumed 42% of May's Pre-Burn Net Revenue, Led by 75 Wallets
Cumulative insured value of physical redemptions reached $20 million as of June 23rd. Q2 alone contributed $8.9 million, exceeding the total of the previous four quarters. CC also collected $929,000 in burn fee revenue, forming a clear visual line in the data.
The cash transaction is less clear. A redeemed card leaves the vault, ceases to support future pack cycles, and forces the platform to re-procure externally.
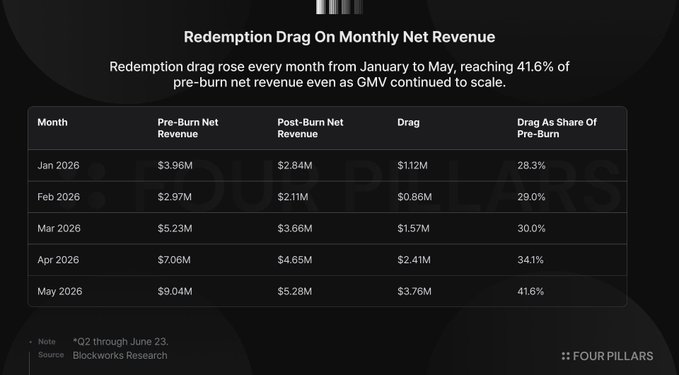
May shows how quickly redemptions can erode spreads. CC generated $9.04 million in pre-burn net revenue, kept $5.28 million after redemption costs, leaving a $3.76 million drag. This occurred during rising GMV, so the redemption burden didn't wait for the platform to mature to a broader collector base; it emerged within the same high-frequency cycle where a few wallets could remove high-value inventory fast enough to have a material impact.
Burn data at the wallet level narrows the scope. From June 11th to 25th, Dune recorded 742 NFT burns within the CC cards collection. CC-controlled wallets accounted for 311 burns, user wallets for 431. The top four user redeemers accounted for 203 burns, equivalent to 47.1% of user burns. Eight batch redeemers burning 10 or more cards accounted for 325 burns, equivalent to 75.4% of user burns. Only 30 wallets burned exactly one card during the window.
Relative to June's depositing users, the redemption participation rate is just 1.22%. Single-card redeemers make up 0.49% of depositing users. The visible redemption base is small, concentrated, and dominated by batch activity. This combination works against CC because visible redemption activity isn't yet widely distributed across the user base like a deep collector market. They are removing inventory in large chunks, while most depositors continue cycling capital via buybacks.
Therefore, redemption growth tightens the same operational constraint. Buybacks require attractive rates to keep user capital flowing, while redemptions remove reusable graded cards that enable future pack cycles. When both grow simultaneously, CC can still increase GMV, but more gross activity comes with lower retained gross margin and higher vault replenishment needs.
Tighter Grading Channels, GameStop's Entry, and Market-Price Inventory Turn the Model Negative
As physical redemptions grow, the relevant cost isn't the sticker price of the card leaving the vault, but the cost to replace it with equivalent graded inventory. CC's cycle works best when graded cards stay in the vault, get repeatedly assigned to packs, and return via buybacks. Once a user redeems a physical card, that card exits the cycle, forcing CC to either purchase an equivalent graded card on the market or acquire raw stock and resubmit it for grading.
CC CEO Tuomas Holmberg has described acquiring inventory at 85% to 90% of insured value through dealer relationships and winning around 100-150 cards daily via an automated eBay bidding system. This may be true, but the model remains fragile. Low-cost acquisition works best when grading capacity is loose and competitors aren't squeezing the same channels.
GameStop is competing for the same inventory with a stronger balance sheet and better physical reach. Power Packs launched on April 15, 2026, partnering with PSA, also using a $25 to $2,500 rip-and-ship range, and offering a 90% Fair Market Value buyback minus a 6% sell fee, netting users ~84.6%. GameStop has $8.4 billion in cash and marketable securities, over 1,360 retail stores as PSA grading drop-offs, over 1 million cards graded in under seven months, and PSA parent company Collectors Holdings CEO Nat Turner on its board. Its Collectibles segment revenue reached $348.9 million in Q1 FY2026, becoming its largest business segment.
Grading markets have also become less loose. PSA's Value Bulk grading at $24.99 per card was paused on June 2nd due to reported backlogs, making the cheapest public tier Regular at $79.99 per card. Higher grading costs and longer turnaround times matter because rip-and-ship platforms don't need random raw inventory. They need graded, priced, vault-ready cards that can be loaded into the machine and bought back at controlled rates. Every redemption increases demand for this inventory at a time when cheap throughput has become harder to get.
Sensitivity modeling shows why acquisition cost cannot be a footnote. At a 93% buyback rate and 3% redemption rate, CC's net margin stays positive even if inventory costs rise from 85% to 100% of insured value. At a 9% redemption rate, the same market-price assumption pushes the net margin below zero. At a 15% redemption rate, the model is negative at 85%, 100%, and 120% inventory cost assumptions.
The model doesn't require extreme pressure assumptions. The 93% buyback rate already exists for higher-tier packs. Redemption pressure has risen enough to consume 41.6% of pre-burn net revenue in May. Market-price inventory is plausible when supply is constrained and a larger player enters with cash, retail stores, PSA connections, and a competing rip-and-ship format. CC can absorb one adverse input. Two push the business towards zero gross margin; three turn scale into a larger version of the same spread compression.
B2B API Strategy Still Needs to Prove Repeatability
CC's partner revenue line has only one material quarter. As of June 23rd, cumulative partner revenue is $1.83 million, with $1.70 million recorded in Q3 2025, and the next three quarters showing just $43k, $66k, and $21k respectively. The Q3 amount landed on September 11th and 12th, constituting 93% of cumulative partner revenue. Blockworks described partner revenue as primarily Moonbirds-related, capturing all mint revenue, while Magic Eden revenue is accounted for as Gachapon Machine revenue. The financial records show a concentrated primary issuance event followed by three quarters where the line is almost negligible.
Named partners appear broader than the reported revenue line, but most public integrations read more like distribution rather than independent inventory formation. Magic Eden, Solflare, ComicBook.com, and Nobody Sausage expand where users can encounter CC-powered packs or collections. They haven't yet demonstrated a recurring partner revenue base, partner-funded inventory, or partner-level replacement economics.
Thus, scale carries the same input constraints as the direct product. CC-powered distribution still requires graded cards, dealer relationships, grading throughput, buyback pricing, vault custody, fulfillment, and end-market demand for physical cards. CC is already procuring in a market where inventory is harder to get, acquisition pressure at market price is rising, and GameStop enters with cash, stores, PSA connections, and a competing rip-and-ship format. Adding external surfaces may widen the funnel, but our verifiable public integrations still route the collectibles, custody, fulfillment, and buyback burden back to CC before CC proves its operational layer stable against replacement costs.
Therefore, barring further proof, B2B is a correlated extension of the core risk. If demand for graded cards softens, both direct rip-and-ship activity and partner-driven activity likely soften in sync through the same end market. If demand for graded cards strengthens, CC faces higher replacement costs in both direct and partner channels. If buyback rates tighten across the category, every CC-powered surface must manage the same trade-off between user activity and retained margin. API distribution might make the machine bigger but hasn't yet proven a way around the machine's reliance on cheap, reusable, high-grade inventory.
Outlook
The above is not an argument against Pokémon cards. I believe the collector economy for graded cards is durable and expanding, nostalgia-driven buyers are entering peak earning years, card shows pull parents and kids into the hobby together and seed the next generation of collectors, eBay clears well over $10 billion annually in collectibles, and Pokémon is a dominant category. The rip & ship format gained significant popularity in late 2024.
CC found a viable consumer product within that market, but the concern is *how* CC has grown thus far. The current lever is adding larger packs, offering high buyback rates, and letting high-frequency wallets cycle more capital through the machine. This can boost GMV quickly but does not prove collector market depth. Data indicates volume migration to tiers with lower retention, physical redemptions turning reusable inventory into replenishment demand, and partner distribution still leaning on CC's own inventory and buyback layer.
Going forward, CC needs to prove three things: 1) Broader collector participation; 2) Deeper secondary trading; 3) How on-chain ownership improves discovery and trading of scarce cards. It also needs to prove incremental GMV can be achieved without continuing to compress retention or increase inventory drag, and that B2B can become a recurring, low-inventory revenue channel, not just another distribution surface for the same rip-and-ship machine.