Five consecutive weeks of ETF inflows and a validator reward burn proposal that could change the supply of $ETH, yet the price is barely moving. $ETH is trading at $1,867.68 on August 5, unchanged on the day, while the $1,900 trend line remains overhead, and the market is still waiting for something to force a decision.
$ETH Holds the 0.382 Fibonacci, But the Downtrend Line Remains Unbroken
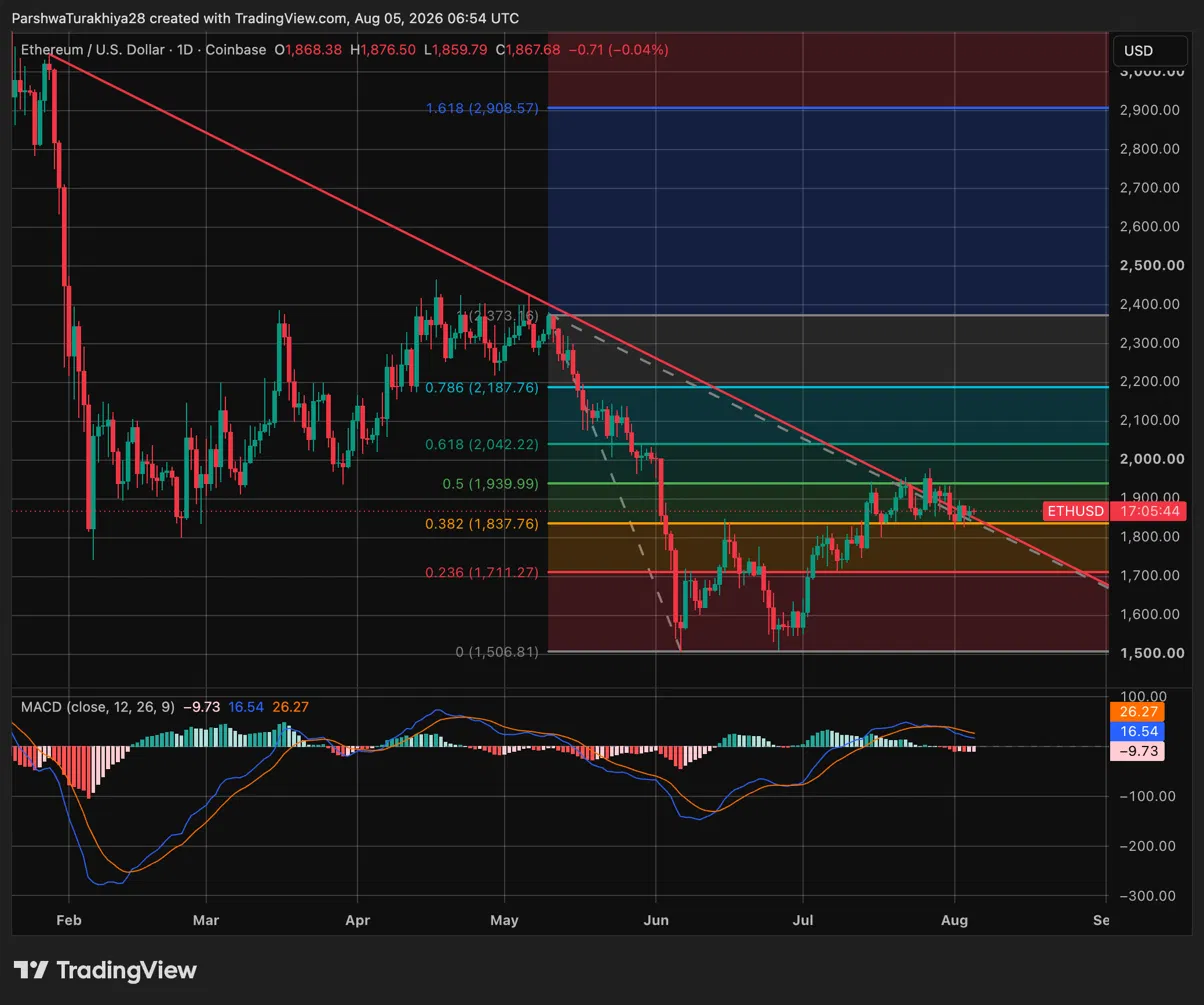
$ETH is trading at $1,867.68, sitting between the key support level at $1,837 below and resistance at $1,939 above. Today's session was tight — ranging from $1,859.79 to $1,876.50 — with no directional conviction on either side.
The descending trend line from the May peak around $2,373 continues to slope around the $1,900 area and has rejected all meaningful recovery attempts since June. It converges with the $1,939 resistance, creating a $1,900–$1,940 zone that price must overcome before $2,000 comes into play.
Related: Pi Network Price Forecast: Can Protocol 26 and RoboPay Lift PI Above $0.10?
The MACD tells the same cautious story. The MACD line at -9.73 is still below the signal line at 16.54, and the histogram has not yet entered bullish territory. Momentum has not confirmed a recovery. Until the MACD crosses over or the trend line is broken, the path of least resistance remains to the side.
Support and Resistance Levels for $ETH, August 5, 2026
| Type | Price | Level |
| Resistance | $1,939.99 | 0.5 Fibonacci, confluence with descending trend line |
| Resistance | $2,042.22 | 0.618 Fibonacci |
| Resistance | $2,187.76 | 0.786 Fibonacci |
| Resistance | $2,908.57 | 1.618 Fibonacci Extension |
| Support | $1,837.76 | 0.382 Fibonacci, key floor |
| Support | $1,711.27 | 0.236 Fibonacci |
| Support | $1,506.81 | June low, Fibonacci base |
Spot $ETH ETFs Open Fifth Consecutive Week in the Green
Spot Ethereum ETFs recorded a daily net inflow of $53.75 million on August 4, the strongest single-day figure since late July. BlackRock's ETHA led with $42.46 million, followed by Fidelity's FETH with $9.34 million and Bitwise's ETHW with $1.34 million. Morgan Stanley's MSSE added $605.21K. All other products recorded zero flow for the day.
The current week has already gathered $42.33 million in just the first two sessions — Monday and Tuesday — with three days still remaining. This puts the week on track to extend the already fifth consecutive positive week for $ETH ETFs. Total net inflows across all products now stand at $11.25 billion with total net assets of $10.32 billion.
| Week | Weekly Net Inflow |
| August 4 (partial, 2 days) | $42.33M |
| July 31 | $27.42M |
| July 24 | $103.90M |
| July 17 | $105.44M |
| July 10 | $84.42M |
EIP-8363: The Supply Shock Proposal Splitting the Community
🚨 🛠️ ETHEREUM PROPOSAL WATCH
— Coin Edition: Your Crypto News Edge ️ (@CoinEdition) August 5, 2026
A new proposal backed by Ethereum researchers, including Justin Drake, seeks to lower validator rewards as $ETH staking nears the 50% threshold.
Opponents say the change could disadvantage solo validators and put pressure on DeFi yields.
Could this... pic.twitter.com/QtGzvK7w4r
Six Ethereum developers, including Justin Drake, proposed a new issuance policy on August 5 called "Tapered Issuance Burn", previously EIP-8363. This proposal would burn an increasing portion of validator rewards as the amount of staked $ETH grows, with the burn rate reaching 100% once staked $ETH reaches 60.25 million, roughly half of the total supply. Implementation was envisioned to take place over 18 months.
Co-author Jérôme de Tychey described uncontrolled issuance as a "dilution tax" for every $ETH holder, arguing that the plan would hinder large custodians and liquid staking providers from concentrating supply. Analyst Zac Pundle called this development a negative supply shock and argued it is directly positive for the price of $ETH.
Related: $BNB Price Forecast for August 2026: Can $BNB Break $600 Amid Former Employee Scandal Clash and Index Inclusion?
However, the proposal has faced significant pushback. Solo validators, small stakers, and DeFi builders warn that the burn mechanism will squeeze out small participants before large institutions feel the real effect, and that it could lower staking yields in a way that reduces institutional demand for $ETH.
The proposal is in the discussion stage and is not scheduled for an upgrade, yet its supply implications are already being debated within the ecosystem as a potential long-term price catalyst.
| EIP-8363 Details | Value |
| Proposal Name | Tapered Issuance Burn |
| Lead Authors | Justin Drake and Jérôme de Tychey, among others. |
| Mechanism | Burns an increasing portion of validator rewards as staked $ETH grows |
| Full Burn Threshold | 60.25 million $ETH staked (~50% of total supply) |
| Launch Timeline | 18 months |
| Bull Argument | Negative supply shock positive for $ETH price |
| Bear Argument | Squeezes out solo validators, may reduce institutional staking demand |
Ethereum Price Forecast: Upside and Downside Targets
Bull Case, Target: $2,042 (0.618 Fibonacci)
$ETH holds the 0.382 Fibonacci retracement at $1,837.76, and the MACD histogram is beginning to shrink towards a bullish crossover. ETF inflows, continuing for a fifth straight week, are attracting fresh institutional attention, and the EIP-8363 supply shock narrative is gaining traction as a long-term price driver. A break of the downtrend line on a daily close above $1,940 opens the path to the 0.618 Fibonacci at $2,042.22 and the $2,000 level.
Bear Case, Risk Level: $1,711 (0.236 Fibonacci)
The descending trend line continues to reject price, and the MACD fails to crossover bullishly, keeping momentum in sellers' control. The controversy around EIP-8363 dampens staking sentiment, and ETF inflow pace slows in the second half of the week. $ETH loses the 0.382 Fibonacci level at $1,837.76 and slides towards the 0.236 level at $1,711.27, with the June low at $1,506.81 coming into view on accelerating deeper lows on selling pressure.
Related: Biconomy Price Forecast: BICO Surges 126% Weekly as Bulls Target $0.03
end-content