Why Bitcoin’s Current Market Behavior Doesn’t Resemble An Accumulation Phase Right Now

bitcoinistPublished on 2026-01-06Last updated on 2026-01-06

Abstract

Despite Bitcoin's recent price recovery toward $100,000, on-chain data suggests the market is not in an accumulation phase. According to analyst Joao Wedson, current activity resembles redistribution rather than accumulation, with large investors likely to sell heavily if BTC reaches the $95,000–$96,700 range. Additionally, realized losses of $511 million continue to dominate over profits of $312 million, indicating ongoing investor capitulation. This selling pressure, however, may help cleanse the market and potentially mark the end of a corrective phase.

Following the sudden recovery of the broader cryptocurrency market, the Bitcoin price is slowly heading back towards the $100,000 mark, showing that bulls are reentering the market. Despite bulls returning to the market, on-chain data suggests that the current state of BTC is not in an accumulation phase.

Bitcoin Is Not In An Accumulation Phase

Bitcoin’s price appears to have regained bullish traction once again, breaking past key resistance levels that previously halted upward attempts. However, the current market structure of BTC is triggering questions about whether the flagship asset is now in an accumulation phase.

Joao Wedson, a market expert and the founder of Alphactal on-chain platform, has offered insights into Bitcoin’s market dynamics, revealing what the current market structure actually looks like rather than accumulation. Although price action may appear stable on the surface, on-chain and flow statistics indicate that buyers are not yet intervening with the conviction usually observed during classic accumulation periods.

According to the market expert, BTC’s current market structure leans heavily towards a redistribution phase rather than an accumulation phase. This suggests that activity is more of a transitory scenario where distribution and cautious participation continue to prevail, as the market looks for a clearer direction.

Source: Chart from Joao Wedson on X

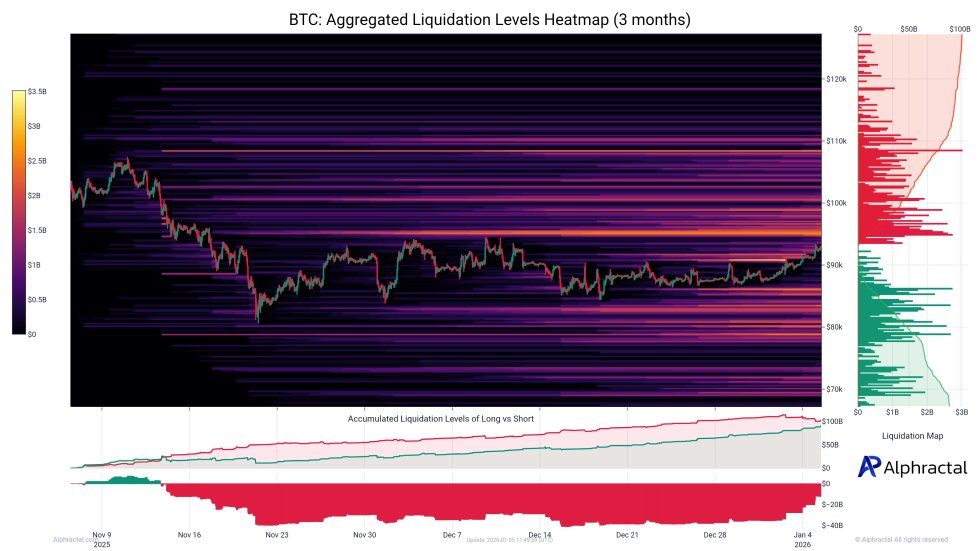
If the price of BTC reaches the $95,000 to $96,700 range, Wedson claims that the market could witness strong selling interest from large investors or whales in the area, fueled by liquidity escape. Meanwhile, for those thinking about opening short positions, the expert has declared that this is the region where the decision makes the most sense.

Wedson’s bold statement is supported by the fact that the market usually deceives. However, before a real move is carried out in the current market state, even those who are positioned correctly typically need to be liquidated.

Realized Losses Are Still Dominant In The Market

Price action may have turned bullish, but on-chain activity has not completely moved into positive zones. Despite the current rebound in Bitcoin Darkfost, a CryptoQuant author and market expert has disclosed that realized losses continue to dominate the market.

Darkfost’s research is mainly centered on the Bitcoin weekly average of realized profits and losses. As observed on the chart, the realized profits of BTC are at $312 million, while realized losses are maintaining a value of $511 million.

This divergence shows that some investors are choosing to capitulate and exit the market by reducing their losses in spite of the ongoing recovery in BTC’s price. Furthermore, these phases of capitulation have frequently signaled the end of corrective phases.

The current capitulation has intensified over the past week. Data shows that it is approaching levels comparable to the previous bear market phase, which might have made it possible for the market to be sufficiently cleansed to begin on a healthier basis.

BTC trading at $93,284 on the 1D chart | Source: BTCUSDT on Tradingview.com

Related Questions

QAccording to Joao Wedson, what phase does Bitcoin's current market structure resemble, and why?

AAccording to Joao Wedson, Bitcoin's current market structure resembles a redistribution phase rather than an accumulation phase. This is because on-chain data shows buyers are not intervening with the conviction seen in accumulation periods, and activity is more transitory with distribution and cautious participation.

QWhat is the significance of the $95,000 to $96,700 price range for Bitcoin, as mentioned in the analysis?

AThe $95,000 to $96,700 price range is significant because it is where the market could witness strong selling interest from large investors (whales), driven by liquidity escape. It is also the region where opening a short position is considered to make the most sense.

QWhat does the data on realized profits and losses indicate about current investor behavior?

AThe data indicates that realized losses ($511 million) are significantly higher than realized profits ($312 million), showing that many investors are choosing to capitulate and exit the market by selling at a loss, despite the ongoing price recovery.

QHow does the current level of capitulation compare to previous market phases, and what might it signal?

AThe current capitulation is intensifying and approaching levels comparable to the previous bear market phase. This often signals the end of a corrective phase and could mean the market is being sufficiently cleansed to begin a new, healthier upward trend.

QWhat is the overall contradiction between Bitcoin's price action and its on-chain activity, as presented in the article?

AThe contradiction is that while Bitcoin's price action has turned bullish and is recovering, the on-chain activity (such as the dominance of realized losses and lack of strong buyer conviction) has not moved into positive zones, suggesting the market structure is not yet fundamentally strong.

Related Reads

Trading

Spot
Futures

Hot Articles

Discussions

Welcome to the HTX Community. Here, you can stay informed about the latest platform developments and gain access to professional market insights. Users' opinions on the price of BTC (BTC) are presented below.

活动图片