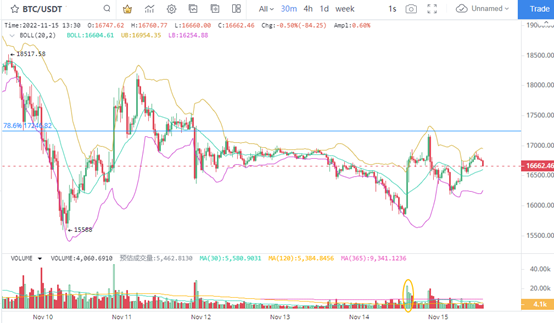
1. BTC is still under heavy pressure
The BTC price fluctuated repeatedly around 16,000 dollars. During the rebound, the price increased slightly, but the duration was short. Most of the time, the pressure was heavy. The 30 minute K line chart shows that the BTC price trend is stable, and the trading volume is still relatively dense during the price adjustment period, indicating that BTC has not yet reached the stage of shrinking and bottoming. Short term selling remained relatively high, indicating the possibility of repeated price declines.
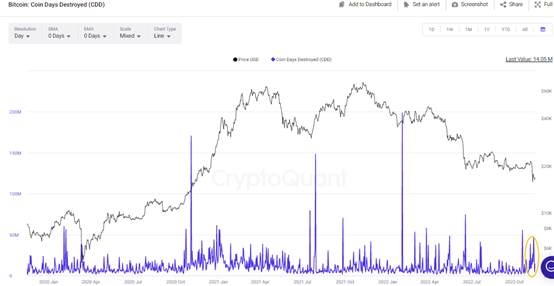
2. Short term selling volume of BTC long-term investors fell back
The long-term investors of BTC fled in a centralized manner during the price withdrawal period. From the performance of the number of destroyed currency days, November 2 to November 12 is the stage of centralized shipment for long-term investors. During this period, the number of long-term investors switching BTC reached the peak in the year, and the characteristics of centralized switching were very obvious. Generally, the selling situation can be confirmed by the number of destroyed currency days. The increase in the number of destroyed currency days for long-term investors means that the short-term price is likely to further decline. However, during the contraction of the number of destroyed currency days, we can focus on the price trend after the long short competition, especially the energy of the long market.
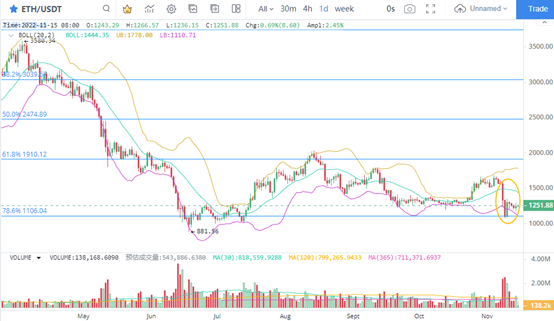
3. ETH center of gravity moves downward
In the short term, the rebound space of ETH is limited, and the price is still in the adjustment stage. In terms of key support, 78.6% of the corresponding $1106 in Fibonacci is still valid. However, considering the strong decline of ETH on November 8 and 9, it means that the ETH price may still hover at a low level before the support can be confirmed. Therefore, short-term attention will continue to be paid to the impact of risk events such as FTX to reduce the concentration of currency holdings.
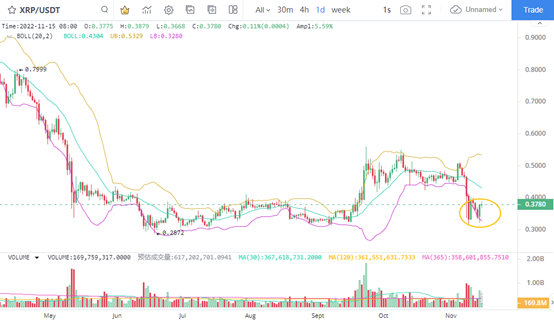
4. XRP rebounds strongly
Since the price fell back on November 5, XRP has sustained three strong rebound performances. The first rebound continued on November 8, when the XRP price hit the lowest point of $0.3355, which was a clear sign of oversold rebound. On November 10, XRP rose 21% after confirming the support around USD 0.33 for the second time. The XRP continued to rebound for the third time, and the trading volume increased, indicating that investors' willingness to enter the market at low prices increased significantly.
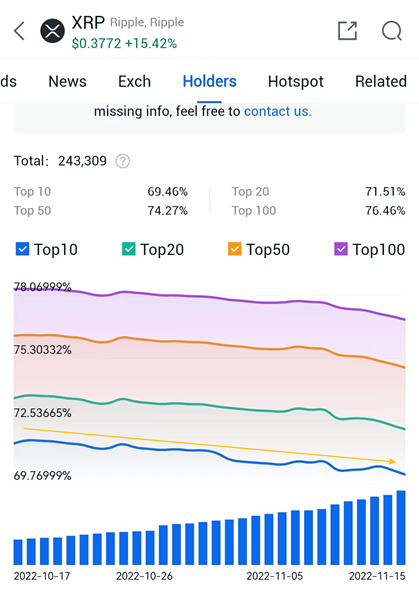
5. XRP's main position reduction trend
Unlike the XRP price rebound, the number of coins held by the main players has always been in a downward trend. At least since October 17, the number of XRP coins in the top 100, top 50, top 20 and top 10 has shown a downward trend. Among them, the proportion of the top 10 major coin holders decreased from 71.16% to 69.46%, a drop of 1.7 percentage points. This shows that XRP's main force has reduced the number of coins held, but its impact on XRP's price is relatively limited.