一、市场观点
“”
1、宏观流动性
“”
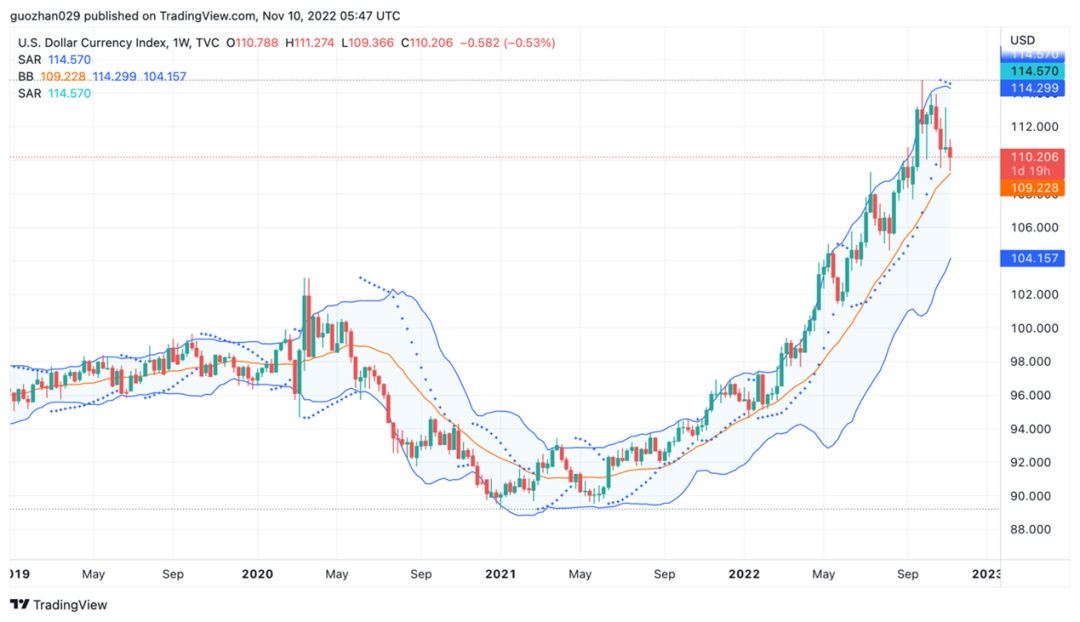
货币流动性放缓。美国支柱产业形成失业潮,为避免紧缩过度对经济造成破坏,美联储12月大概率会放缓加息强度至50基点,流动性压力减轻。若中期选举共和党夺得国会众议院控制权,有利于缓解民主党单边强势作风,可能促成美联储实现鸽派转向。美元指数出现小幅回落,涨势似乎已经见顶。美股这周集体下跌,加密市场因为FTX交易所破产创下两年新低。
2、全市场行情
“”
市值排名前100涨幅榜:
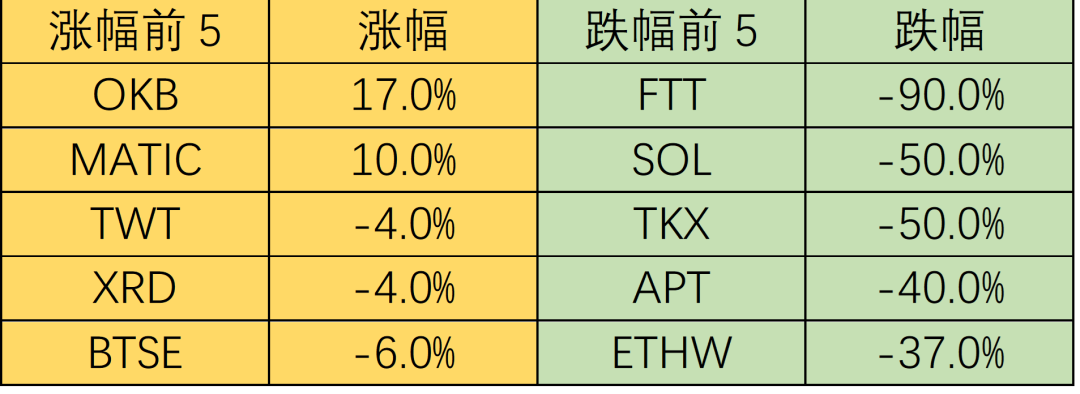
本周加密市场崩盘式下跌,BTC下跌20%。交易所FTX的流动性危机有恶化风险,影响或超过LUNA和三箭事件,后续市场或面临强监管。以SBF系的FTT、SOL、APT为首的山寨币全线暴跌。
“”
1) FTT:
FTX交易所及关联方Alameda基金约有80亿美元亏空,被挤兑暂停提款。币安调查后放弃收购FTX,部分借贷给FTX的机构也传出资不抵债。Coinbase交易所或受益合规竞争对手减少。中心化交易所爆雷,长期利好Defi。
“”
2) SOL:
SBF是Solana链的长期支持者,长期看Solana生态将受严重打击。SOL节点开始解锁质押跑路,OK等交易所暂停Solana链充提。相关的SOL、SRM、RAY、RNDR等均暴跌。
“”
3、BTC行情
“”
1)链上数据
“”
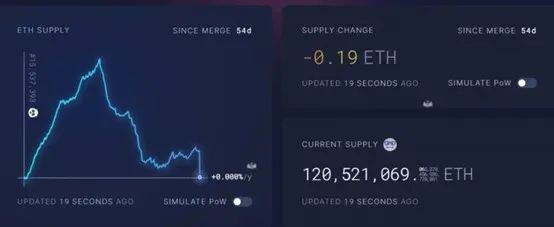
ETH受益网络活动激增,转向净通缩。自 2022 年 9 月 15 日ETH完成合并以来,由于市场波动导致链上活动激增,ETH供应量实现通缩,减少约 10 枚 ETH。ETH 的表现优于 BTC。BTC矿工又到了停机阈值。一些矿工似乎已过度扩张,用于债务支出或基础设施建设的现金支出已超过现金收入。BTC活跃地址趋势表明链上网络使用量仍在下降。
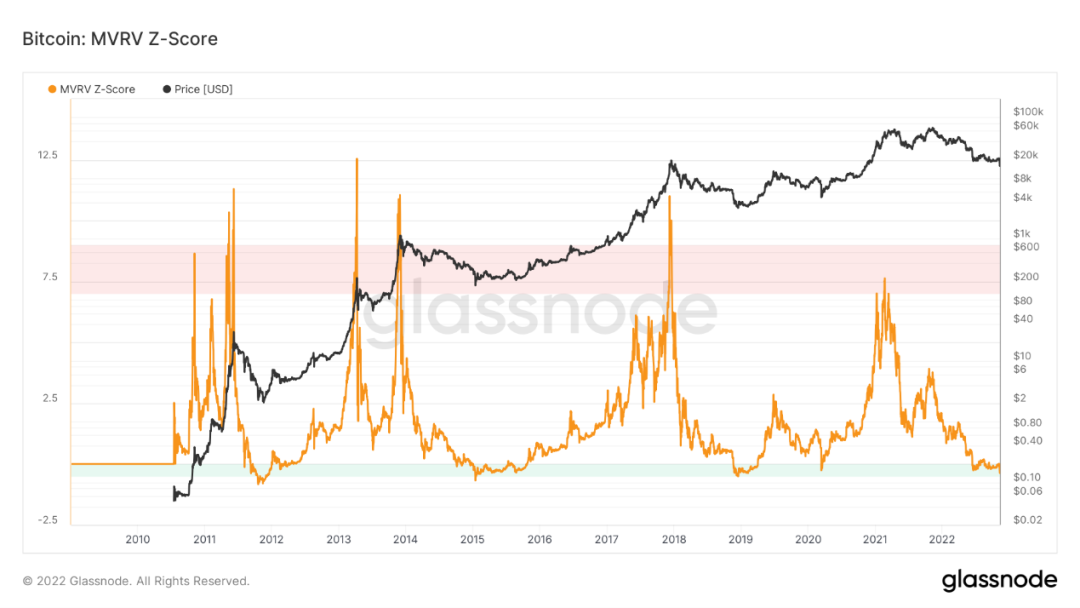
长期趋势指标MVRV-ZScore以市场总成本作为依据,反映市场总体盈利状态。当指标大于6时,是顶部区间;当指标小于2时,是底部区间。MVRV跌破关键水平1,持有者总体上处于亏损状态。当前指标为-0.37,处于绿色抄底区间。
2)期货行情
“”
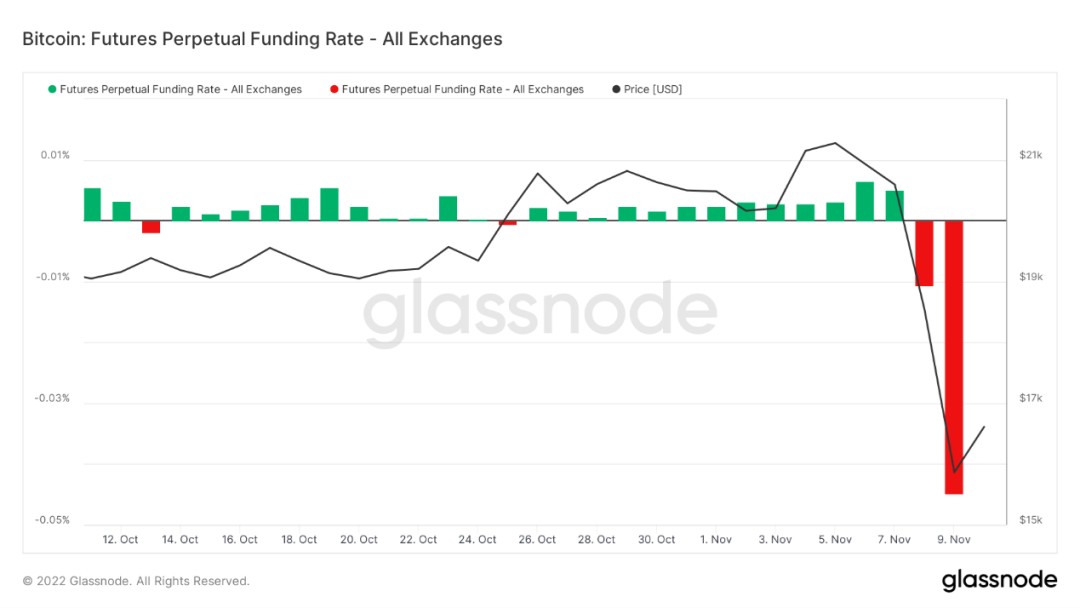
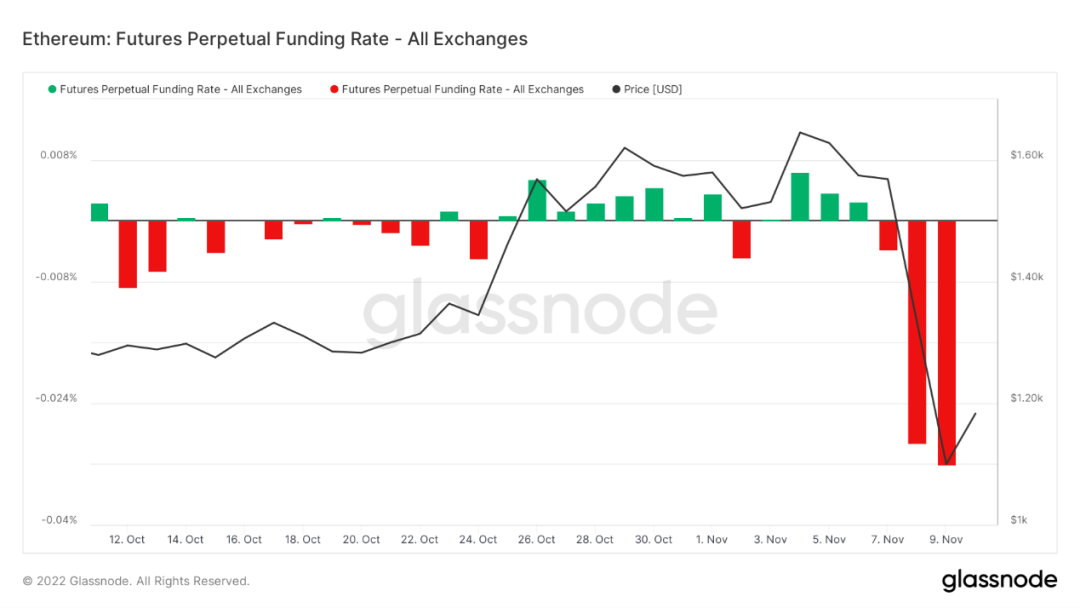
期货资金费率:本周市场更多转向看空,BTC费率-0.1%,个别品种FTT、SOL甚至出现-2.5%费率极值。费率0.05-0.1%,多头杠杆较多,是市场短期顶部;费率-0.1-0%,空头杠杆较多,是市场短期底部。
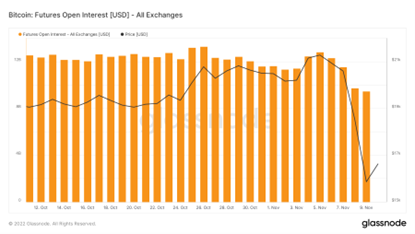
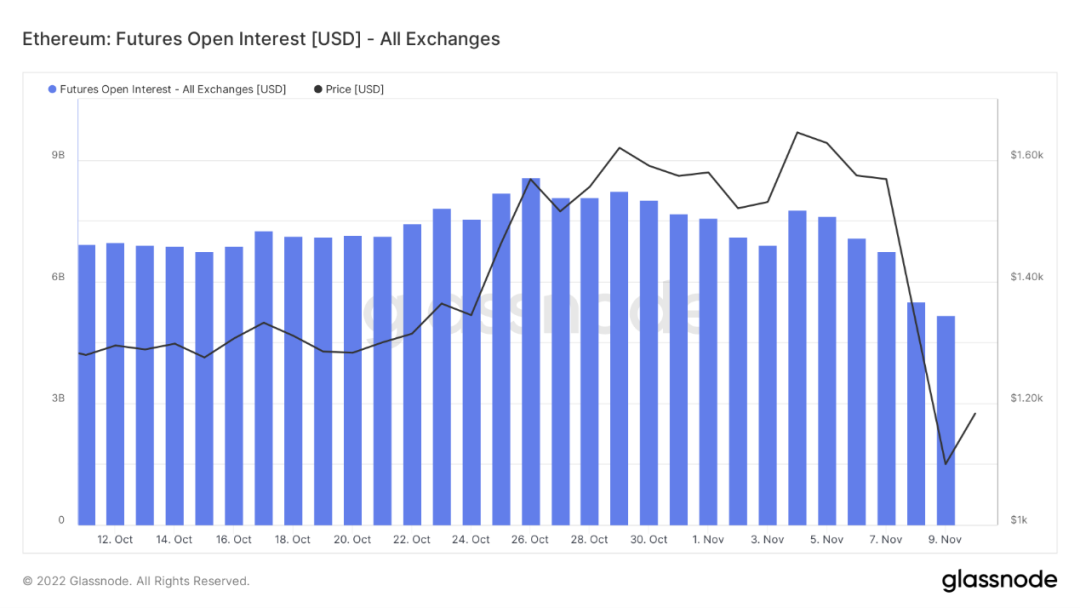
期货持仓量:本周总持仓量大幅下降,创出了21周新低,看涨势头消退。
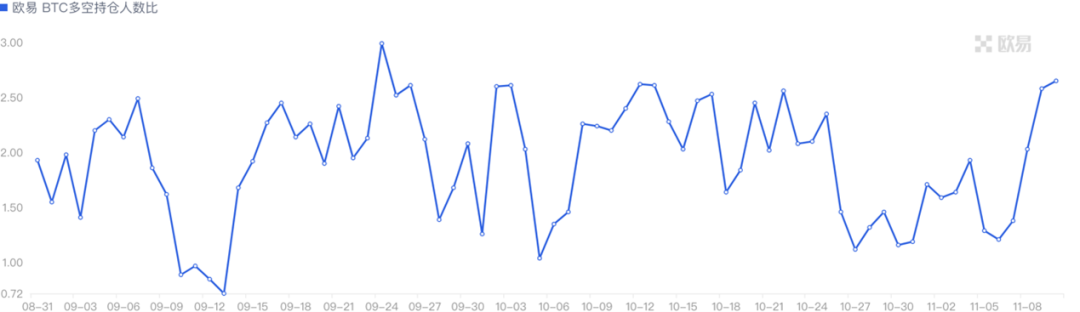
期货多空比:2.2。散户在大举抄底,市场可能继续下跌。多空比数据波动大,参考意义有所削弱。
3)现货行情
“”
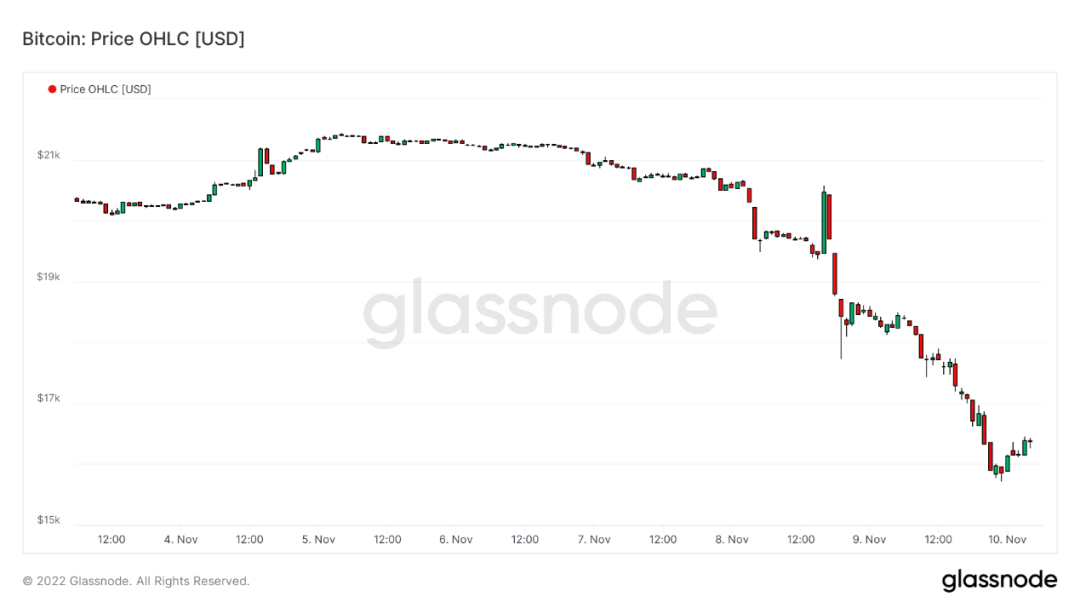
这周BTC创下两年新低,处于较为悲观的恐慌趋势。原本市场在反弹人心思涨之际,币安与FTX的对抗引发流动性挤兑,引发系统性风险。FTX不是第一个失败的大交易所,也不会是最后一个。面对华尔街大资本与中心化交易所的失败,去中心化的货币和金融将继续生存和繁荣。利好是杠杆出清加速见底,大盘行情拐点将在宏观流动性修复后见到,非常看好2023年加密市场的前景。
二、市场数据
“”
1. 公链总锁仓量情况
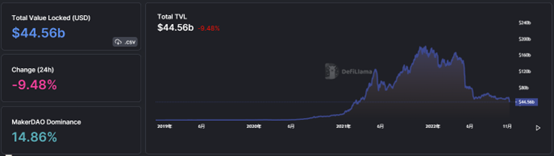
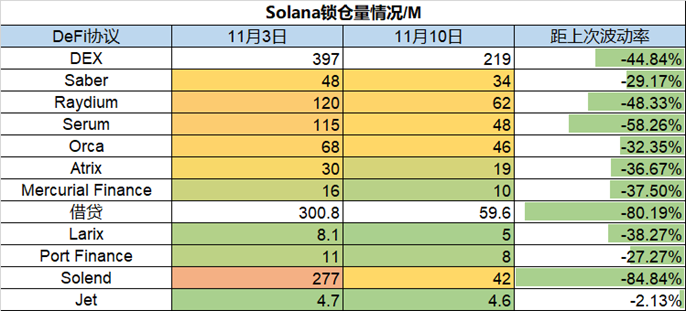
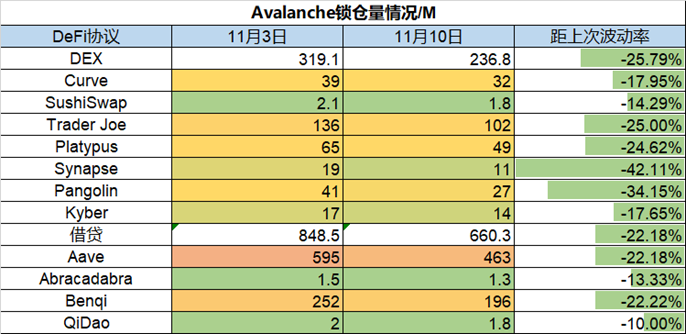
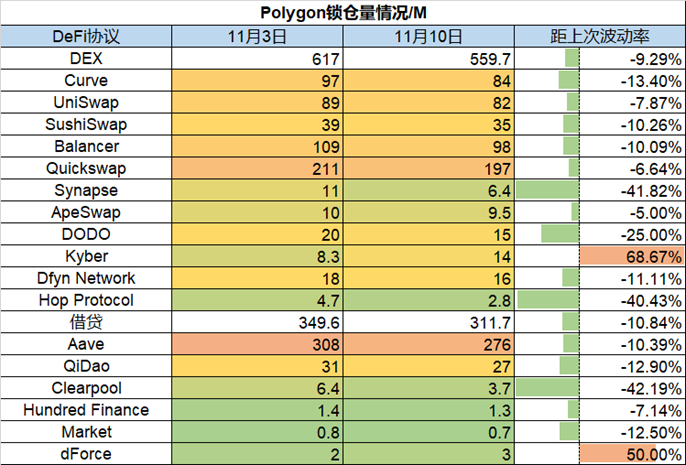
本周TVL总量下降9.45b,下降幅度为17.5%;其中以Solana跌幅最大,单周TVL下跌量达55%,ETH链整体下降约为15%,Polygon链表现最佳,整体下跌11%,其余各链下跌幅度基本在25%附近。
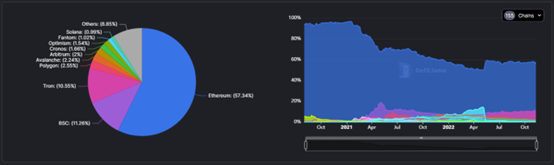
本周TVL总量下降9.45b,下降幅度为17.5%;其中以Solana跌幅最大,单周TVL下跌量达55%,ETH链整体下降约为15%,Polygon链表现最佳,整体下跌11%,其余各链下跌幅度基本在25%附近。
“”
2.各链协议锁仓量情况
“”
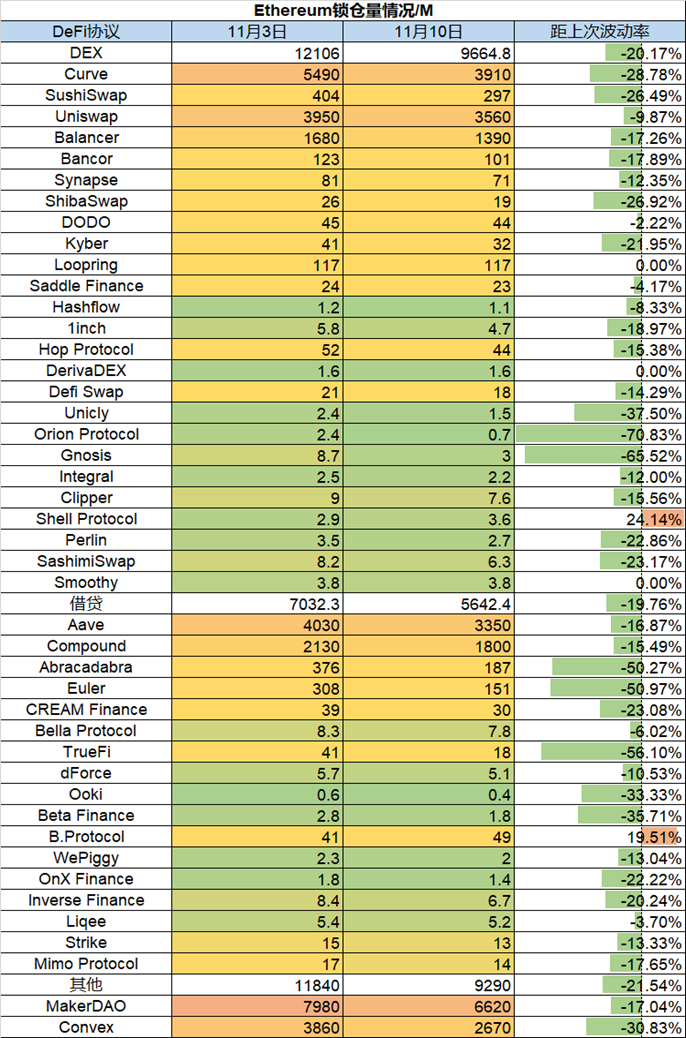
1)ETH锁仓量情况
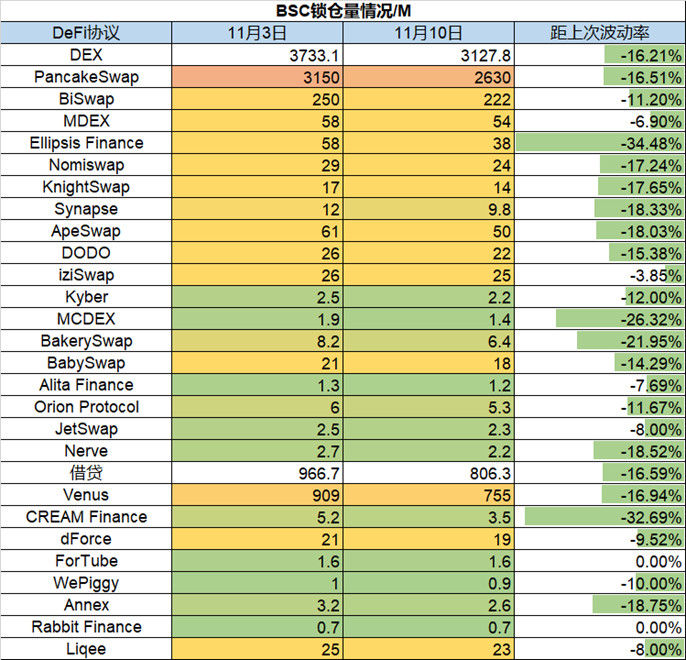
2)BSC锁仓量情况
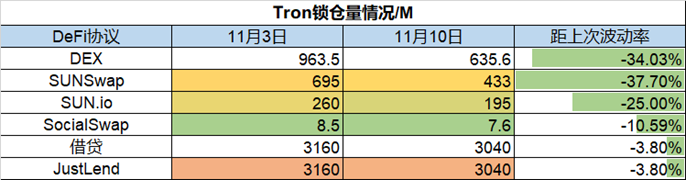
3)Tron锁仓量情况
4)Solana锁仓量情况
5)Avalanche锁仓量情况
6)Polygon锁仓量情况
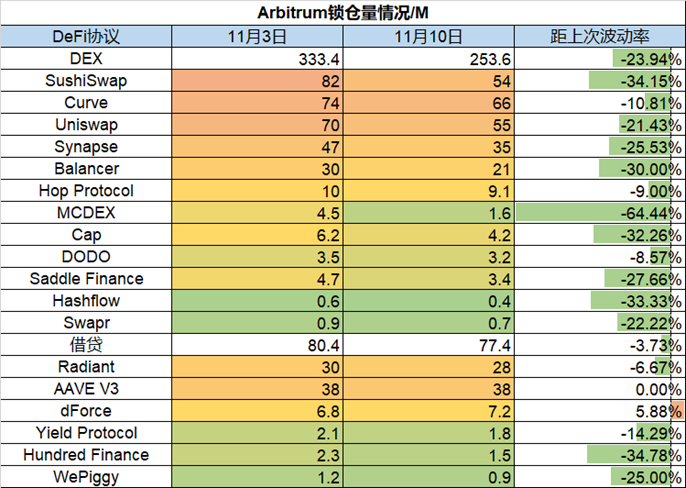
7)Arbitrum锁仓量情况
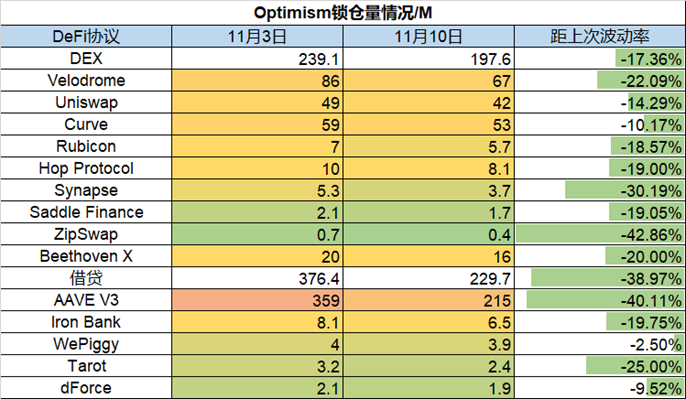
8)Optimism锁仓量情况
3. ETH Gas fee历史情况
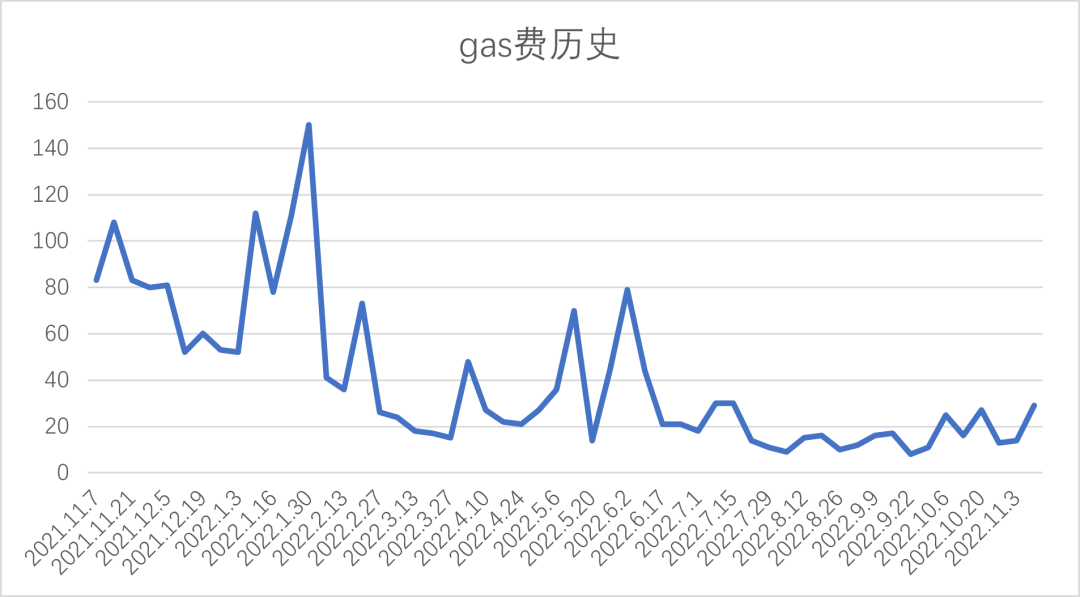
当前链上转账费用约为$1.95,Uniswap交易费用约为$6.64,Opensea的交易费用约为$2.58,本周受行情暴跌影响,连续几日出现Gas激增现象,Uniswap V3交易活跃,另外近期顶级量化交易机构Jump trading 2的账户24小时内Gas消耗达到343个ETH,排名前五。
“”
4. NFT市场数据变化
“”
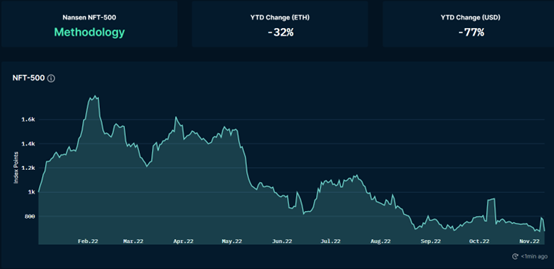
NFT-500市值
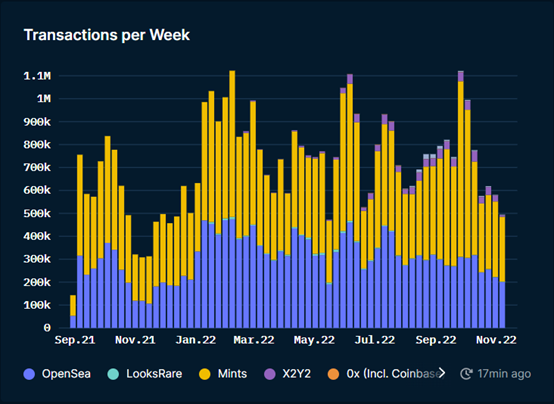
各交易市场交易笔数:
NFT市场交易概览:
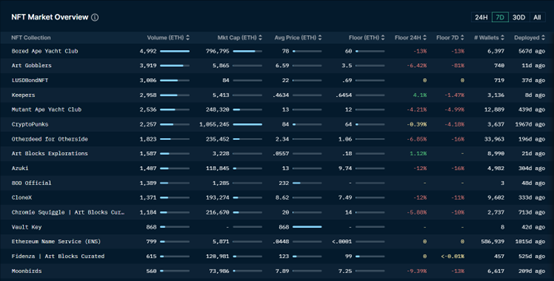
NFT总市值持续下降中,本周头部蓝筹NFT项目地板价均出现一定幅度下降,其中以CloneX下降13%,Otherdeed of otherside下降14%,下降幅度最大,另外每周交易量已连续三个月维持在70000个ETH附近,但从每周交易笔数上看,连续5周均出现持续降低;交易NFT的老用户自9月中旬开始持续降低,逐渐离场,首次购买NFT的用户开始出现小幅增长,目前单日地址基本达到1万附近。