67% Of Ethereum Stablecoin Transfers Are P2P, Yet Institutions Dominate Volume

bitcoinistPublished on 2025-12-24Last updated on 2025-12-24

Abstract

A new analysis of Ethereum stablecoin transactions reveals that while peer-to-peer (P2P) transfers dominate in frequency, institutional activity accounts for the vast majority of transaction volume. According to data shared by an Ethereum Foundation member, 67% of USDT and USDC transfers on the Ethereum network from August 2024 to 2025 were P2P, typically associated with retail users. However, these transfers represented only 24% of the total volume. In contrast, business-related transactions—including business-to-business (B2B), internal business moves, and person-to-business (P2B) transfers—made up just 33% of transaction count but a dominant 76% of the volume. The data, sourced from Artemis, focused exclusively on USDT and USDC transfer transactions, excluding mints, burns, or cross-chain transfers. Ethereum remains the leading network for stablecoins, hosting over 50% of the global supply. Meanwhile, ETH’s price briefly recovered above $3,000 before pulling back to around $2,950.

Data shows 67% of Ethereum transactions involving the stablecoins USDT and USDC are P2P in nature, but the majority of volume lies elsewhere.

Business-Related Ethereum Stablecoin Transactions Dominate Volume

In a new post on X, Ethereum Foundation head of ecosystem James has shared some numbers related to stablecoin transactions on the ETH blockchain. Stablecoins refer to cryptocurrencies that have their value pegged to a fiat currency.

As these assets are relatively “stable” by nature, they have quickly established themselves as the preferred mode of payments, with their volume surpassing combined that of the top five non-stablecoin cryptocurrencies.

But what does the nature of these transactions look like? Below is the data posted by James, showcasing how the transfers related to the Ethereum versions of USDT and USDC break down between retail and business payments.

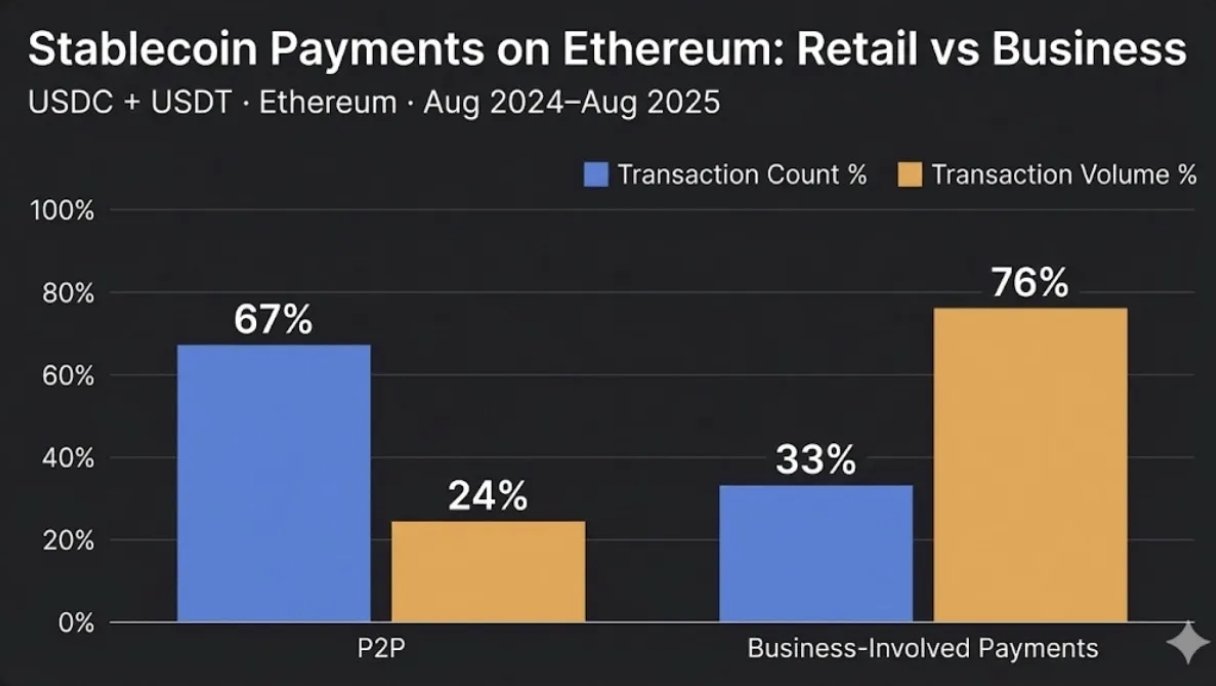
Businesses seem to be dominating in terms of the volume | Source: @Snapcrackle on X

As is visible in the chart, 67% of USDT and USDC transactions on the Ethereum network that occurred between August 2024 and 2025 were of the peer-to-peer (P2P) type. Such transactions are usually a sign of activity from retail users.

The small size of the users being involved could be why the transaction volume share of P2P transfers was just 24%. In contrast, business-involved payments made up for 76% of the volume, despite occupying a transactions share of just 33%.

The Ethereum Foundation member sourced the data from Artemis’ report on Ethereum stablecoin payment usage. While stablecoins pegged to various currencies exist, Artemis focused on the USD-tied USDC and USDT as they are by far the most popular options, occupying 88% of the sector’s market cap.

These coins circulate on several blockchains, but Ethereum is currently the most dominant network, hosting more than 50% of the global stablecoin supply. “We also only focus on transfer transactions and exclude any mint, burn, or bridge transactions from our analysis,” noted the report.

Artemis has broken down how it classifies transactions. Transfers are considered P2P if they occur between the externally owned accounts (EOAs) of two separate users.

Determining whether a transaction is P2P can be tricky, however, given that it’s not always possible to determine whether two accounts are owned by different entities. Problems also arise for wallets owned by exchanges and other centralized entities. “In our dataset we are able to label many institutional and firm EOA wallets; however, the labeling is not perfect and some EOA wallets that are owned by firms and are not documented in our dataset can be mislabeled as individual wallets,” explained the report.

The second category is business-to-business (B2B), naturally consisting of the moves taking place between two institutional EOAs. Transactions between the same institutional entity fall inside the “Internal B” label.

Finally, there is the person-to-business (P2B) category, accounting for the transfers happening between individuals and businesses. James’ chart clubs all the business categories into one.

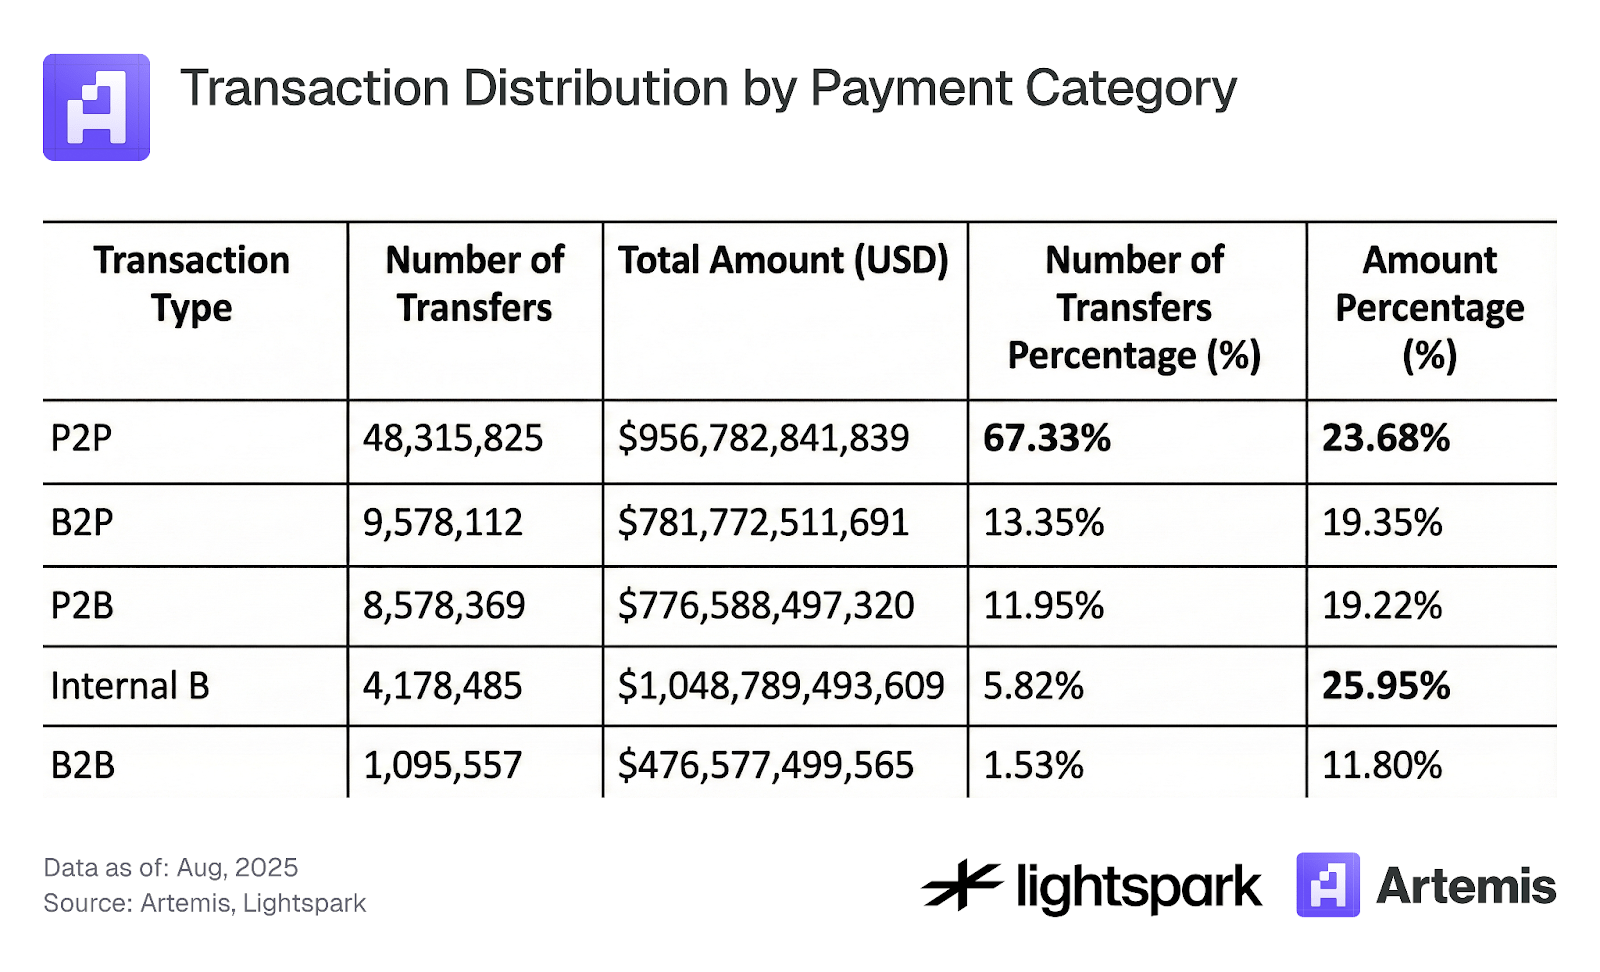
The numbers related to the stablecoin transactions on the Ethereum network | Source: Artemis

ETH Price

Ethereum made recovery above $3,000 earlier, but it seems the coin has once again faced a pullback as its price is now back at $2,950.

The trend in the ETH price over the last five days | Source: ETHUSDT on TradingView

Related Questions

QWhat percentage of Ethereum stablecoin transfers are P2P, and what is their share of the total volume?

A67% of Ethereum stablecoin transfers are P2P, but they account for only 24% of the total volume.

QWhich stablecoins were the focus of the data analysis, and why were they chosen?

AThe analysis focused on USDT and USDC because they are the most popular stablecoins, occupying 88% of the sector's market cap.

QWhat is the main reason P2P transactions have a low volume share despite their high transaction count?

AThe small size of the users involved in P2P transactions is why their volume share is low, as these are typically retail users making smaller transfers.

QHow does the Ethereum network classify a transaction as P2P?

AA transfer is classified as P2P if it occurs between the externally owned accounts (EOAs) of two separate individual users.

QWhat was the price of Ethereum mentioned in the article after it faced a pullback?

AAfter facing a pullback, Ethereum's price was back at $2,950.

Related Reads

The Value Distribution of Stablecoins

**Summary: The Value Distribution of Stablecoins** The article argues that stablecoins are evolving from mere trading tools into broader channels for dollar access. It divides the stablecoin ecosystem into four layers to analyze how value is distributed: 1. **Issuance Layer:** Mints stablecoins, holds reserve assets, and captures the spread between reserve yield and user costs (e.g., Tether, Circle). This layer currently earns the largest profit margin. 2. **Infrastructure Layer:** Connects stablecoins to the traditional financial system, handling fiat on/off-ramps, banking integration, compliance (KYC/AML), and asset management (e.g., Bridge, BVNK). This is the "unglamorous" but critical work, building the essential bridges between crypto and real-world finance. 3. **Acquiring/Distribution Layer:** Integrates stablecoins into merchant systems, manages payment flows, and provides enterprise financial software (e.g., Stripe, Coinbase). They act as the access point for businesses. 4. **Application Layer:** The end-users and businesses that ultimately use stablecoins for payments, settlements, or as a store of value. They benefit from convenience but have little pricing power. The core thesis is that while the issuance layer currently dominates profits, the often-overlooked **infrastructure layer holds significant long-term potential**. The real challenge and barrier to mass adoption is not the on-chain transfer of stablecoins (which is simple), but the complex "last mile" integration into existing business workflows, banking systems, and regulatory frameworks across different countries. Companies in this layer are currently in a "land grab" phase, investing heavily to build networks, secure bank partnerships, and establish compliance pathways. While their position is currently pressured by the profitable issuers above and distribution platforms below, the article suggests that if stablecoins become a default financial rail for businesses, the infrastructure providers who have done the hard work of integration will ultimately gain strong pricing power and become entrenched, essential players.

marsbit6h ago

The Value Distribution of Stablecoins

marsbit6h ago

The Value Distribution of Stablecoins

The Value Distribution of Stablecoins The article argues that stablecoins are evolving from a mere trading tool into a broad "dollar channel." It analyzes the industry's value chain through four layers: 1. **Issuance Layer (e.g., Tether, Circle):** The top layer that mints stablecoins, holds reserve assets, and captures the thickest interest rate spread. 2. **Infrastructure Layer (e.g., Bridge, BVNK):** Connects stablecoins to the traditional financial system, handling critical but complex "dirty work" like fiat on/off-ramps, banking integration, compliance (KYC/AML), and cross-border settlement. 3. **Acquiring/Distribution Layer (e.g., Stripe, Coinbase):** Embeds stablecoins into merchant systems, manages payment flows, and integrates with enterprise software. 4. **Application Layer:** End-users and businesses that ultimately use stablecoins for payments, settlement, or storing value. The author posits that while the issuance layer currently captures the most profit, the most overlooked and potentially critical layer is infrastructure. The core challenge for stablecoin adoption isn't the on-chain transfer (which is simple), but bridging the gap between blockchain and the real-world financial system. This involves solving practical problems for businesses: fiat conversion, reconciliation, tax handling, and user onboarding. Infrastructure companies are currently in a difficult "land-grab" phase—building networks, securing banking relationships, and achieving compliance country-by-country. They face pressure from both the profitable issuance layer above and distribution platforms below. However, the author suggests this layer is building a crucial moat. Once stablecoins become a default business rail, the infrastructure players who have done the hard work of integration may gain significant, durable value and pricing power.

链捕手6h ago

The Value Distribution of Stablecoins

链捕手6h ago

Trading

Spot
Futures

Hot Articles

Discussions

Welcome to the HTX Community. Here, you can stay informed about the latest platform developments and gain access to professional market insights. Users' opinions on the price of ETH (ETH) are presented below.

活动图片