Dogecoin падает: насколько низко может опуститься цена

cryptonews.ruPublished on 2025-04-19Last updated on 2025-06-19

Цена Dogecoin (DOGE)снова находится под давлением, колеблясь около 0,167 доллара на момент написания статьи. Как дневные, так и часовые графики рисуют чёткую картину: покупатели отступают, и импульс замедляется. После тестирования сопротивления на уровне 0,20 доллара и неспособности прорваться выше, цена DOGE теперь теряет поддержку на ключевых скользящих средних. Теперь вопрос в том, упадёт ли цена ещё ниже или быки смогут защитить эту критическую зону?

Прогноз цены Dogecoin: что показывает дневной график?

Прогнозирование цены Dogecoin
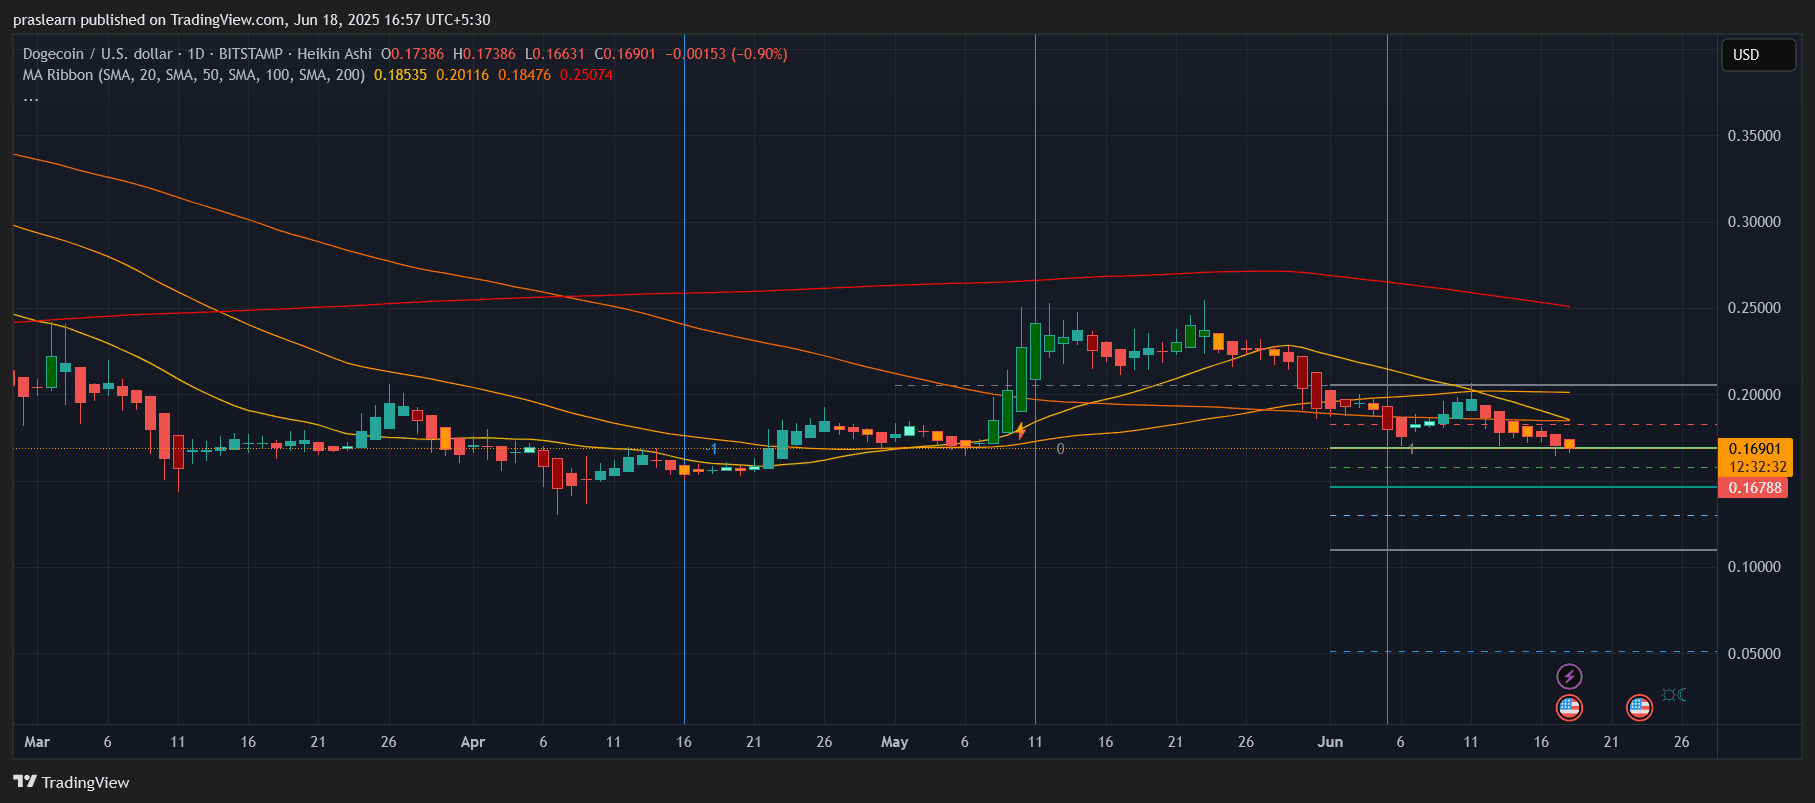
График DOGE/USD на 1 день — TradingView

Дневной график показывает непрерывную серию более низких максимумов и более низких минимумов, при этом цена DOGE сейчас торгуется ниже 20-дневной (0,185), 50-дневной (0,201) и даже 100-дневной скользящей средней (0,184). Эти три динамические зоны сопротивления теперь находятся выше текущей цены, что усиливает давление на рынок. Примечательно, что 200-дневная скользящая средняя по-прежнему значительно выше — 0,250 доллара, что указывает на слабость долгосрочного тренда.

Недавний прорыв DOGE ниже уровня 0,17 доллара сигнализирует о том, что краткосрочные покупатели вышли из игры. Свечи «Хайкен Аши» по-прежнему в основном красные, что подтверждает медвежий тренд. Зона поддержки сейчас находится между уровнями 0,160 и 0,155 доллара, и явный прорыв может открыть путь к уровням 0,145 и даже 0,125 доллара, что составляет 25% от текущего уровня.

Давайте подсчитаем потенциальный ущерб на этом уровне:

Снижение до 0,125 с 0,167=(0,167−0,125/0,167​)×100 = 25,14%

Это может отпугнуть новых инвесторов, если только не возобновится активное покупательское давление.

О чём говорит почасовая диаграмма?

Прогнозирование цены Dogecoin
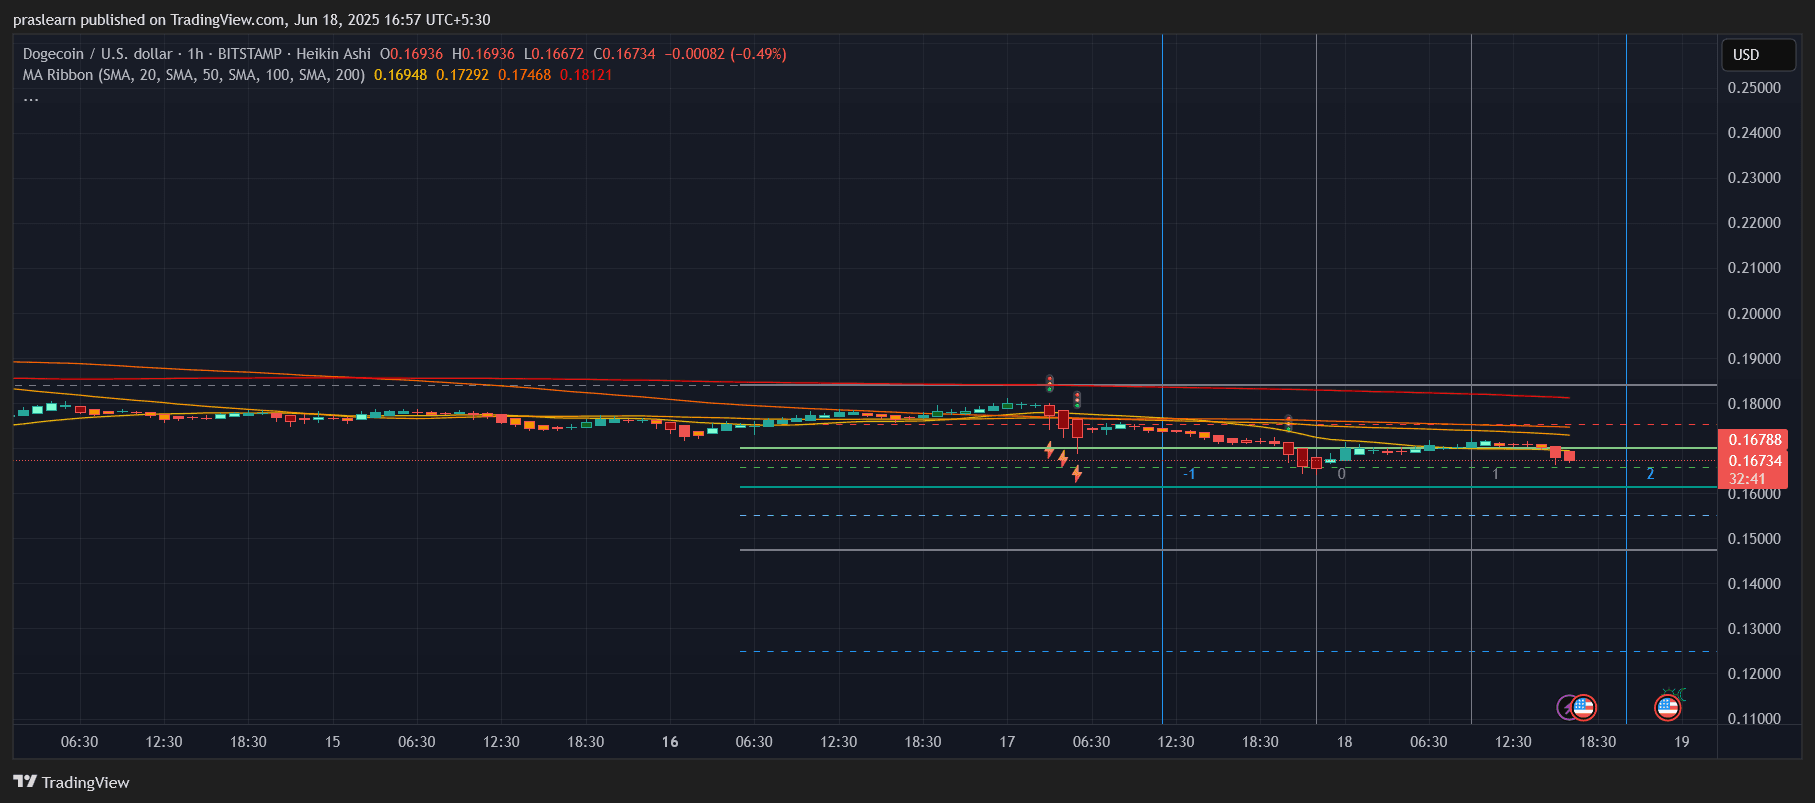
График DOGE/USD на 1 час — TradingView

Если посмотреть на часовой график, то можно увидеть, что цена DOGE находится ниже всех ключевых скользящих средних: 20-, 50-, 100- и 200-дневных SMA. Они плотно расположены в диапазоне от 0,169 до 0,181 доллара, и цена неоднократно выходила из этой зоны. Такая перекупленность отражает сильное внутридневное сопротивление.

За последние 48 часов цена Dogecoin пыталась вернуться к отметке 0,175 доллара, но потерпела неудачу. Продавцы быстро отреагировали, и цена упала до 0,167 доллара. Более того, повторяющиеся более низкие максимумы указывают на ослабление спроса даже среди дневных трейдеров. Краткосрочная нижняя граница находится вблизи 0,162 доллара. Если этот уровень будет преодолён, DOGE может быстро вернуться к 0,150 доллара.

Прогноз цены Dogecoin: есть ли надежда на разворот?

Отскок возможен, но только в том случае, если цена DOGE сможет восстановиться и удержаться выше 0,175 доллара при достаточном объёме. Это позволит преодолеть скользящие средние 20 и 50 и откроет путь к 0,185 доллара, который является следующим уровнем сопротивления по Фибоначчи, а также совпадает со 100-дневной скользящей средней. Движение с 0,167 до 0,185 доллара будет означать рост на 10,7%.

(0,185−0,167/0,167)×100=10,77%

Но сейчас и структура, и скользящие средние указывают на то, что любой отскок будет кратковременным, если только настроения на рынке в целом не улучшатся. Доминирование биткоина растёт, а цена альткоинов, таких как Dogecoin, в такие периоды, как правило, отстаёт.

Каков Вердикт суда?

Тренд Dogecoin явно медвежий как на дневном, так и на часовом таймфреймах. Продавцы контролируют ситуацию, и уровни поддержки находятся под угрозой. Если цена опустится ниже 0,162 доллара, в ближайшие недели цена DOGE может упасть ещё на 10–20%. Возвращение к 0,175–0,185 доллара имеет решающее значение для любого краткосрочного восстановления. До тех пор мем-монета может продолжать медленно терять в цене по мере того, как рынок перераспределяет капитал в более крупные активы.

Если вы держите акции в руках, возможно, вам стоит подождать и понаблюдать. Если вы хотите купить, терпение может принести вам более выгодные цены.

Related Reads

After Missing the 20x, I've Found a 'Dumb' Method for AI Investing

**Missing the 20x Opportunity: A Simple 'Dumb' Approach to AI Investing** The AI boom, driving NVIDIA's revenue from $60B to $216B in two years, creates immense investment pressure. However, like the internet bubble of 2000, the largest AI opportunities likely lie ahead, perhaps after a correction. Instead of rushing in now or waiting paralyzed for a crash, the author proposes a third way: building a "knowledge warehouse" by systematically mapping the AI industry to be ready when opportunities arise. The core of the strategy is understanding AI's four-layer value chain: 1. **Compute Infrastructure (The "Engine"):** This foundational layer, where all money eventually flows, includes: a) **Chip Design:** NVIDIA's dominance via its CUDA ecosystem, b) **Chip Manufacturing/Packaging/Memory:** TSMC's near-monopoly in advanced manufacturing and SK Hynix's lead in High Bandwidth Memory (HBM), c) **Optical Interconnects:** Essential for large-scale AI clusters (e.g., Lumentum, Coherent), d) **Cooling & Power:** Critical for high-density AI data centers (e.g., Vertiv), e) **Servers/Data Centers & Cloud Platforms:** The physical and virtual wholesale providers. 2. **Models & Tools (The "OS"):** The competitive layer of foundation models (OpenAI, Anthropic, Google, Meta, xAI), now generating real revenue. A key shift is the center of gravity moving from **Training** models to **Inference** (running models), which demands different chip characteristics and could challenge NVIDIA's monopoly. 3. **Middleware & Platform ("The Glue"):** Connects models and applications (e.g., Scale AI, Hugging Face). This layer could explode if applications take off. 4. **Vertical Applications ("The Cash Register"):** Where AI meets end-users (e.g., enterprise AI, coding tools, medical AI, robotics). A critical cross-cutting constraint is **Energy**, as AI's massive power consumption drives investment in nuclear and other energy infrastructure. The author identifies four key questions for further research: 1) How will the shift from Training to Inference reshape the competitive landscape? 2) With tech giants spending over $600B on capex, where is the ROI from AI applications? 3) What are the under-the-radar opportunities in the "second" and "third" circles of the value chain (e.g., cooling, specialty foundries)? 4) How will geopolitics (e.g., U.S.-China chip restrictions) bifurcate the supply chain? The conclusion is that missed opportunities stem from insufficient research, not slow timing. By methodically studying each layer—its business models, competition, and valuations—investors can build the "killer intuition" needed to act decisively when the market presents its chance.

marsbit16m ago

After Missing the 20x, I've Found a 'Dumb' Method for AI Investing

marsbit16m ago

Rented Faith: How Much of the Bitcoin ETF Inflows Is Real Money?

"Rented Conviction: How Much of Bitcoin ETF Flows Is Real Money" The weekly inflows into Bitcoin ETFs are often interpreted as a gauge of institutional belief. However, a significant portion of this activity is driven by a hidden arbitrage trade, not directional conviction. The core mechanism is a cash-and-carry arbitrage: traders buy spot Bitcoin (often via ETFs) while simultaneously shorting CME futures to lock in the price difference, or "basis." This delta-neutral trade is essentially an interest rate play. In weekly data, about half the fluctuation in ETF flows can be explained by new short positions added by leveraged funds (hedge funds), with a correlation of 0.70. Bitcoin's price movement in a given week shows no statistical power in predicting these flows. While this arbitrage trade drives weekly *volatility*, it is not the main component of the cumulative *stock*. Of the total ~$55 billion in net ETF inflows, the current net arbitrage position is only about $1 billion. The remainder is steady, directional buying averaging ~$400 million per week, which constitutes the vast majority of the accumulated "mountain" over two years. Thus, ETF flow data overstates the *volatility* of conviction, not its *level*. This arbitrage trade has been unwinding for nearly two years. Leveraged fund short positions peaked at ~$14 billion in late 2024 and have since declined to ~$4.5 billion. When the basis compresses to unprofitable levels, ETF inflows and short positions retreat together. Recent outflows should not be mistaken for a loss of faith but rather the routine unwinding of this rate trade. For Ethereum ETFs, the pattern is weaker. Accounting for staking yield makes the basis often negative, so neither strong conviction buying nor robust arbitrage supports its flows. To interpret ETF flows correctly, monitor the CME basis versus T-bill rates and leveraged fund net shorts. They reveal how much of the next "demand" headline is real. The real, patient buy-and-hold demand is what constitutes the enduring bulk of ETF assets.

marsbit1h ago

Rented Faith: How Much of the Bitcoin ETF Inflows Is Real Money?

marsbit1h ago

Trading

Spot
Futures
活动图片