Цена золота обновила исторический максимум — биткоин укрепляется как «цифровое золото»

cryptonews.ruPublished on 2022-04-12Last updated on 2025-04-12

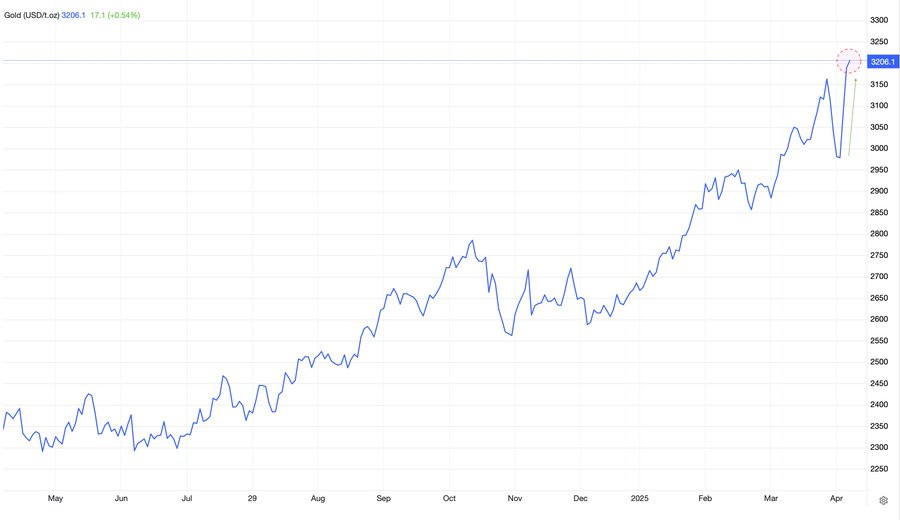
Пока мир штормит из-за очередного витка торговых пошлин, золото, как настоящий ветеран кризисов, снова показало отличную динамику. Его цена вылетела на новый исторический максимум — $3,200 за унцию. Те, кто заранее вложился в драгоценный металл, сейчас явно потирают руки — доходность улетела в космос.

На фоне паники на рынках активы-убежища, вроде золота, снова вошли в моду и пользуются бешеным спросом.

Авторитетный аналитик CryptoQuant Алекс Адлер младший подметил интересную деталь: биткоин начинает всё активнее примерять на себя роль «золота 2.0«. За год BTC подтянулся в цене на бодрые 16%, закрепляя за собой статус защиты от экономических катаклизмов.

По словам того же Адлера, основным триггером резкого скачка цен на золото стала свежая выходка США — очередное повышение тарифов на импорт из Китая. Новая планка пошлин — это какой-то ультимативный уровень: плюс 125% к действующим ставкам, что довело общий тариф до заоблачных 145%.

В то же время для других стран власти США включили режим «передышки» — дали 90-дневную отсрочку от новых пошлин. Но Китай оказался главным мишенью — рынки тут же отреагировали нервно.

Адлер считает, что усиление тарифной войны разогрело страхи инвесторов перед экономическим завалом. Особенно на фоне того, что доллар теряет свои позиции. Поэтому золото стало настоящим магнитом для капитала, спасаясь от будущих потрясений.

Золото всегда умело удерживать статус надёжного укрытия от инфляции и прочих финансовых напастей. С начала года цена на жёлтый металл выросла больше чем на 20% — не в последнюю очередь благодаря массовым закупкам со стороны иностранных центробанков.

Если торговая война будет только разрастаться, Адлер прогнозирует, что ценник на золото может ещё не раз удивить новыми высотами.

Пока весь мир следит за ростом цен на физическое золото, биткоин тоже показывает силу. За последний год крипта прибавила крепкие 16% — несмотря на общую турбулентность рынков.

На данный момент BTC немного подрос и торгуется в районе $81,910. Да, это всё ещё ниже исторического максимума в $109 тысяч, но динамика говорит сама за себя — инвесторы всё активнее добавляют его в свой набор защитных активов наряду с золотом.

Related Reads

After Missing the 20x, I've Found a 'Dumb' Method for AI Investing

**Missing the 20x Opportunity: A Simple 'Dumb' Approach to AI Investing** The AI boom, driving NVIDIA's revenue from $60B to $216B in two years, creates immense investment pressure. However, like the internet bubble of 2000, the largest AI opportunities likely lie ahead, perhaps after a correction. Instead of rushing in now or waiting paralyzed for a crash, the author proposes a third way: building a "knowledge warehouse" by systematically mapping the AI industry to be ready when opportunities arise. The core of the strategy is understanding AI's four-layer value chain: 1. **Compute Infrastructure (The "Engine"):** This foundational layer, where all money eventually flows, includes: a) **Chip Design:** NVIDIA's dominance via its CUDA ecosystem, b) **Chip Manufacturing/Packaging/Memory:** TSMC's near-monopoly in advanced manufacturing and SK Hynix's lead in High Bandwidth Memory (HBM), c) **Optical Interconnects:** Essential for large-scale AI clusters (e.g., Lumentum, Coherent), d) **Cooling & Power:** Critical for high-density AI data centers (e.g., Vertiv), e) **Servers/Data Centers & Cloud Platforms:** The physical and virtual wholesale providers. 2. **Models & Tools (The "OS"):** The competitive layer of foundation models (OpenAI, Anthropic, Google, Meta, xAI), now generating real revenue. A key shift is the center of gravity moving from **Training** models to **Inference** (running models), which demands different chip characteristics and could challenge NVIDIA's monopoly. 3. **Middleware & Platform ("The Glue"):** Connects models and applications (e.g., Scale AI, Hugging Face). This layer could explode if applications take off. 4. **Vertical Applications ("The Cash Register"):** Where AI meets end-users (e.g., enterprise AI, coding tools, medical AI, robotics). A critical cross-cutting constraint is **Energy**, as AI's massive power consumption drives investment in nuclear and other energy infrastructure. The author identifies four key questions for further research: 1) How will the shift from Training to Inference reshape the competitive landscape? 2) With tech giants spending over $600B on capex, where is the ROI from AI applications? 3) What are the under-the-radar opportunities in the "second" and "third" circles of the value chain (e.g., cooling, specialty foundries)? 4) How will geopolitics (e.g., U.S.-China chip restrictions) bifurcate the supply chain? The conclusion is that missed opportunities stem from insufficient research, not slow timing. By methodically studying each layer—its business models, competition, and valuations—investors can build the "killer intuition" needed to act decisively when the market presents its chance.

marsbit16m ago

After Missing the 20x, I've Found a 'Dumb' Method for AI Investing

marsbit16m ago

Rented Faith: How Much of the Bitcoin ETF Inflows Is Real Money?

"Rented Conviction: How Much of Bitcoin ETF Flows Is Real Money" The weekly inflows into Bitcoin ETFs are often interpreted as a gauge of institutional belief. However, a significant portion of this activity is driven by a hidden arbitrage trade, not directional conviction. The core mechanism is a cash-and-carry arbitrage: traders buy spot Bitcoin (often via ETFs) while simultaneously shorting CME futures to lock in the price difference, or "basis." This delta-neutral trade is essentially an interest rate play. In weekly data, about half the fluctuation in ETF flows can be explained by new short positions added by leveraged funds (hedge funds), with a correlation of 0.70. Bitcoin's price movement in a given week shows no statistical power in predicting these flows. While this arbitrage trade drives weekly *volatility*, it is not the main component of the cumulative *stock*. Of the total ~$55 billion in net ETF inflows, the current net arbitrage position is only about $1 billion. The remainder is steady, directional buying averaging ~$400 million per week, which constitutes the vast majority of the accumulated "mountain" over two years. Thus, ETF flow data overstates the *volatility* of conviction, not its *level*. This arbitrage trade has been unwinding for nearly two years. Leveraged fund short positions peaked at ~$14 billion in late 2024 and have since declined to ~$4.5 billion. When the basis compresses to unprofitable levels, ETF inflows and short positions retreat together. Recent outflows should not be mistaken for a loss of faith but rather the routine unwinding of this rate trade. For Ethereum ETFs, the pattern is weaker. Accounting for staking yield makes the basis often negative, so neither strong conviction buying nor robust arbitrage supports its flows. To interpret ETF flows correctly, monitor the CME basis versus T-bill rates and leveraged fund net shorts. They reveal how much of the next "demand" headline is real. The real, patient buy-and-hold demand is what constitutes the enduring bulk of ETF assets.

marsbit1h ago

Rented Faith: How Much of the Bitcoin ETF Inflows Is Real Money?

marsbit1h ago

Trading

Spot
Futures
活动图片