Hedera reclaims key resistance, eyes trend reversal: Can HBAR hold above $0.10?

ambcryptoPublished on 2026-02-15Last updated on 2026-02-15

Abstract

HBAR has broken above the key $0.10 resistance level, signaling a potential trend reversal after a prolonged downtrend. The price formed higher lows between $0.073–$0.090, indicating weakening bearish control, and a decisive weekly close above $0.10 confirmed the structural breakout. Follow-up buying pushed the price toward $0.134, establishing the first higher high. Despite rejection wicks near the $0.104–$0.107 supply zone, pullbacks held above $0.097–$0.10, suggesting strong support reclamation. The bullish momentum was amplified by a 43% surge in spot trading volume, exceeding $200 million, following FedEx's announcement to join the Hedera Council. Additionally, an inverse head-and-shoulders pattern formation and rising futures open interest (up 9% to $29 million) with positive funding rates indicated strong leveraged long positioning. However, this also introduces crowding risk, making the rally vulnerable if spot demand fades. At the time of writing, HBAR faces a critical inflection point. Sustained closes above $0.10 could lead to a push toward $0.11–$0.134, validating the reversal. Failure to hold above $0.10 may result in a retracement toward $0.090 or even $0.078. The overall structure suggests an early bullish transition, but continuation depends on confirmed breakout strength above the $0.10–$0.104 resistance band.

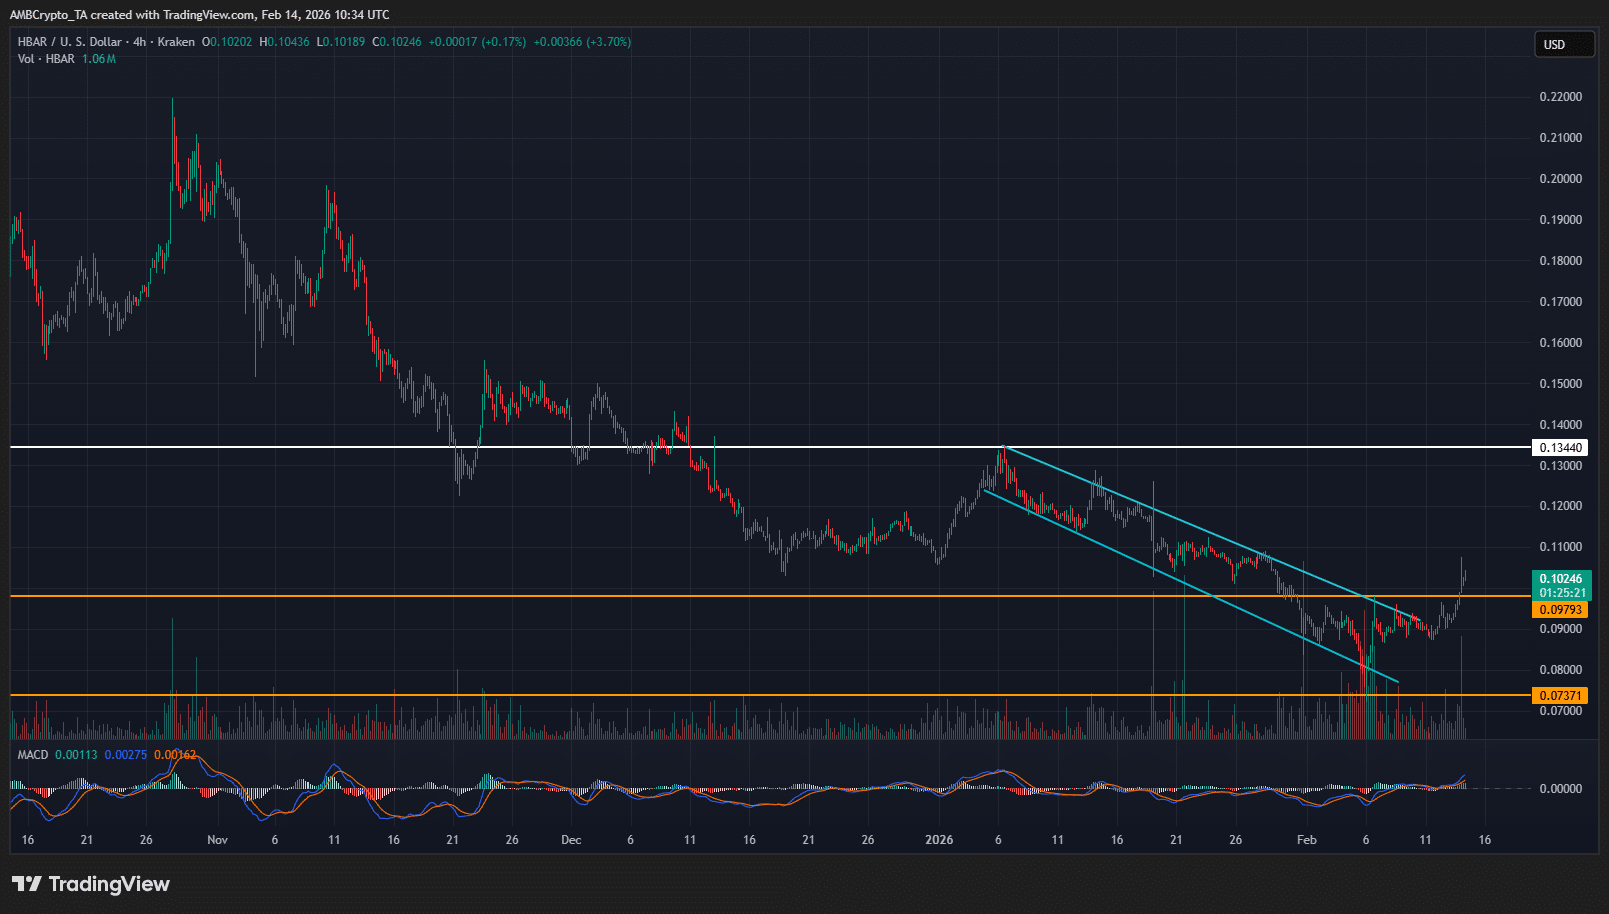
HBAR’s structure began shifting as price compressed beneath the descending long-term trendline and the $0.10 horizontal resistance, where sell pressure had repeatedly capped upside.

Buyers gradually absorbed supply within the $0.073–$0.090 range, forming higher lows that hinted at weakening bearish control.

Momentum then expanded, and a decisive weekly close above $0.10 confirmed the structural breakout and trendline breach.

Source: TradingView

Follow-through buying pushed the price toward $0.134, establishing the first higher high after the downtrend.

Although rejection wicks emerged at this supply zone, pullbacks held above $0.097–$0.10, signaling support reclamation rather than breakdown.

Moreover, holding above former resistance confirmed acceptance, while the higher-low defense validated early higher-timeframe trend reversal.

Together, the breakout, the support flip, and the higher highs-higher lows formation signaled a transition from distribution into early bullish trend development.

Factors amplifying HBAR’s bullish momentum

As the bullish structure matured, volume and leverage flows began accelerating.

Hedera [HBAR] recorded clear volume expansion during the rebound phase amid global logistics powerhouse FedEx joining Hedera’s council. Spot trading volume surged over 43%, exceeding $200 million.

Price simultaneously advanced 7%, reclaiming key moving averages. This rise confirmed strong buyer conviction behind the move.

Demand originated from the $0.09 support base, signaling organic accumulation rather than speculative rotation.

Moreover, the rally aligned with an inverse head-and-shoulders formation. Rising volume into the neckline break strengthened pattern validity and sustainability.

Source: CoinGlass

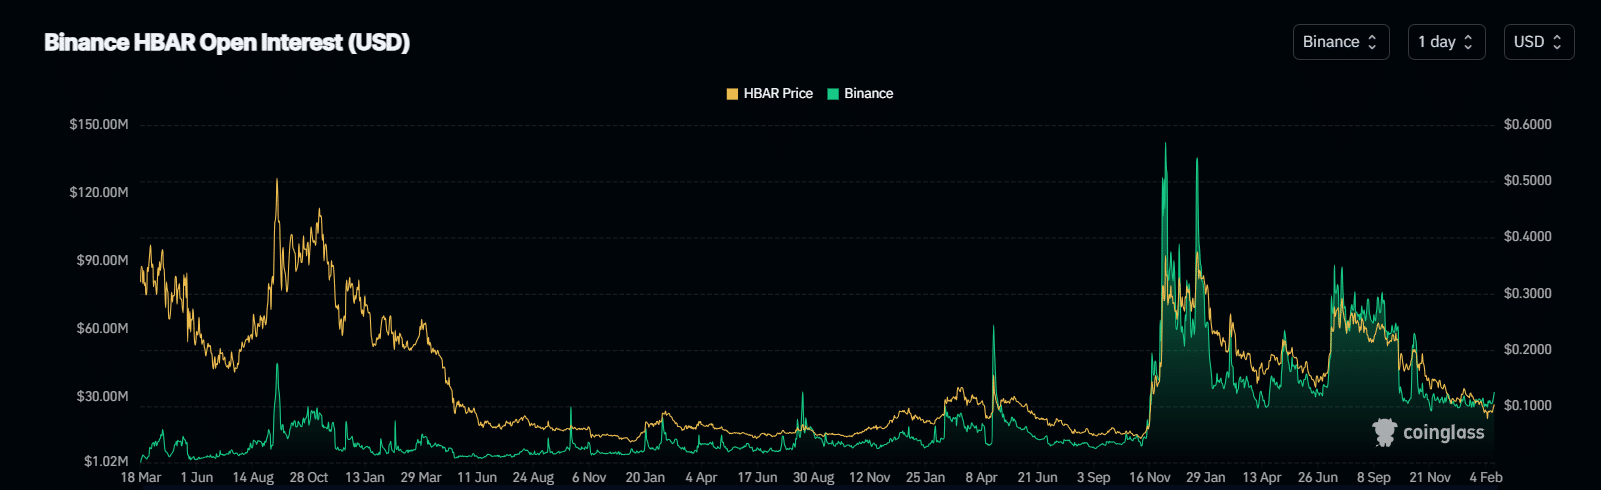
Derivatives positioning then added further context. Futures Open Interest climbed 9% to nearly $29 million between the 11th and the 12th of February.

At the same time, Funding Rates flipped positive near +0.05%. This shift indicated leveraged longs entering aggressively.

While leverage amplified upside momentum, it also introduced crowding risk. Elevated positioning increases squeeze potential if the price holds. However, it also raises vulnerability to pullbacks if spot demand fades.

HBAR: Reversal momentum builds

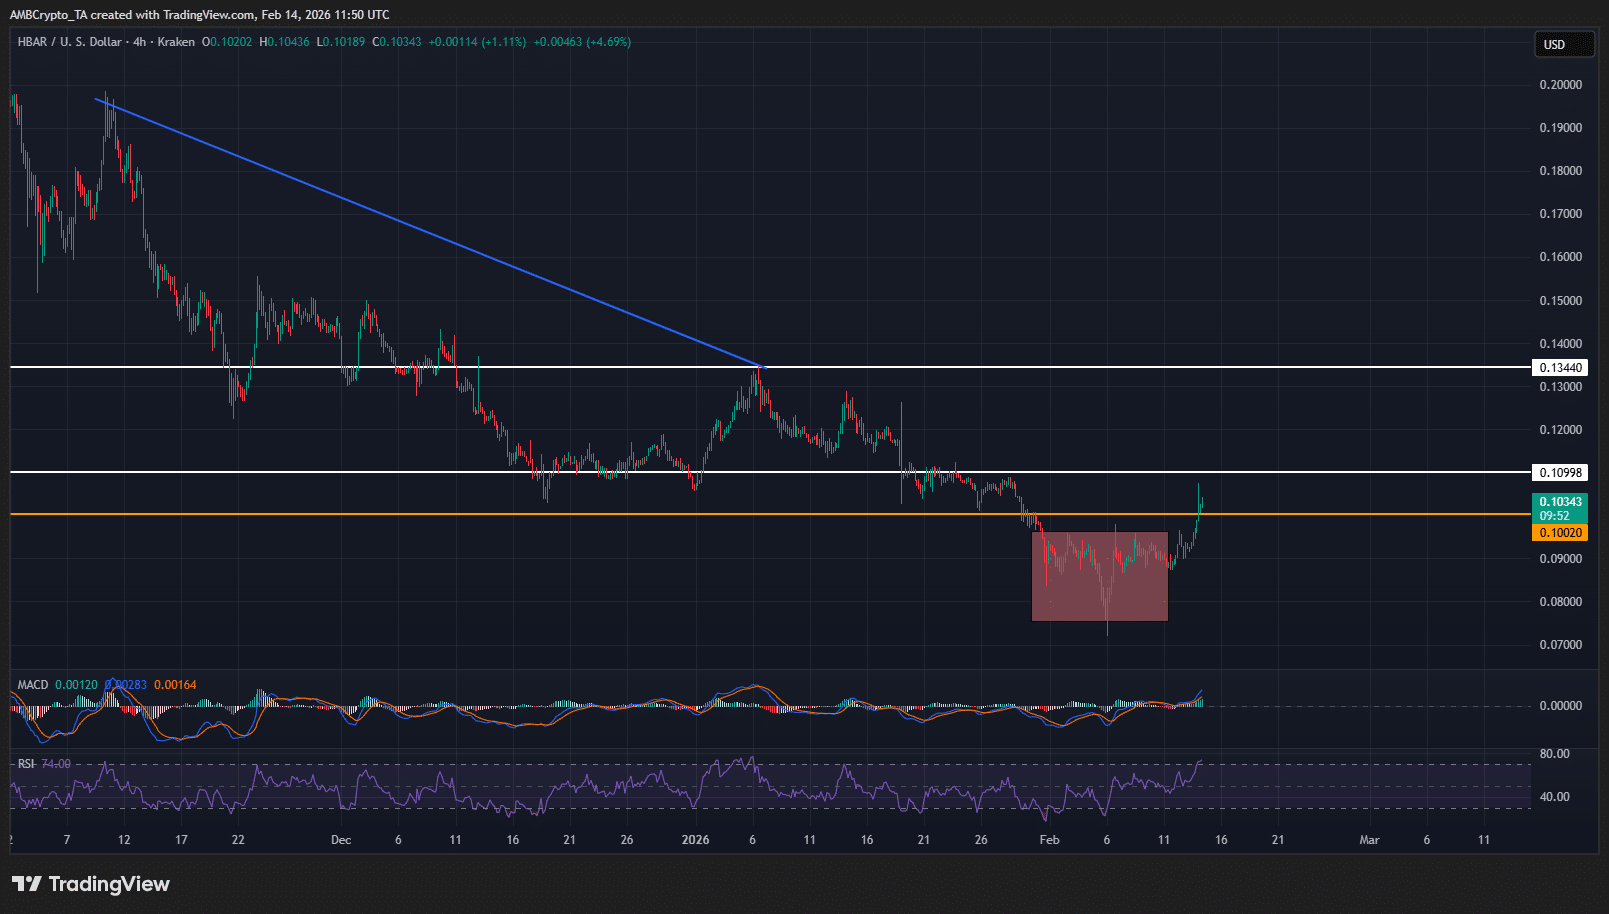
At the time of writing, HBAR continued confronting macro downside pressure as the price traded below the descending trendline from the $0.21 November 2025 peak.

Sellers still defended the lower-high structure, yet demand is beginning to rebuild near the $0.078 base.

However, buyers are now pressing into the $0.10–$0.104 supply band after breaking the short-term market structure breakout between $0.090 and $0.102.

Source: TradingView

If price secures sustained closes above $0.10, buyers will likely target the $0.11–$0.134 resistance corridor. Follow-through strength would confirm a breakout above and extend the emerging higher-low sequence.

However, repeated rejection wicks near $0.104–$0.107 signal active supply. If sellers force the price back below $0.098–$0.10, the breakout risks invalidation.

In that case, price may retrace toward $0.090 or retest the $0.078 demand floor.

Thus, the structure now sits at an inflection point where structural validation above supply will determine whether reversal momentum expands or fades.


Final Summary

  • HBAR’s break above $0.10, backed by higher lows and volume expansion, signals an early bullish trend transition from prior distribution.
  • Yet leveraged long crowding and supply near $0.104–$0.107 leaves continuation dependent on sustained breakout confirmation above $0.10.
Next: Solana’s divergence explained – Is SOL undervalued or not?
Share
  • Share
  • Tweet

Trending Cryptos

Related Questions

QWhat key resistance level did HBAR break above to signal a potential trend reversal?

AHBAR broke above the key resistance level of $0.10, which was a significant horizontal resistance and the descending long-term trendline.

QWhat fundamental news event contributed to the surge in HBAR's trading volume and price?

AGlobal logistics powerhouse FedEx announced it was joining the Hedera Council, which contributed to a 43% surge in spot volume and a 7% price increase.

QWhat technical pattern, mentioned in the article, strengthened the validity of the bullish move?

AAn inverse head-and-shoulders formation was mentioned, with rising volume into the neckline break strengthening the pattern's validity and sustainability.

QWhat are the two possible price targets for HBAR if it secures a sustained close above $0.10?

AIf HBAR secures a sustained close above $0.10, the likely resistance corridors to target are $0.11 and $0.134.

QWhat risk did the article associate with the increase in Futures Open Interest and positive Funding Rates?

AThe increase in leveraged long positions introduced a crowding risk, making the price more vulnerable to a squeeze if spot demand fades or to sharp pullbacks, increasing volatility.

Related Reads

Bitcoin Boom in Full Swing: Saylor's Latest Statement Fuels Buying Speculation

MicroStrategy's Executive Chairman Michael Saylor has fueled speculation about a new Bitcoin purchase by posting "Bitcoin Drive engaged" on August 2, accompanied by the company's customary purchase tracker. This aligns with his pattern of hinting at treasury changes ahead of weekly reports. The accompanying report showed MicroStrategy's Bitcoin holdings at 843,775 BTC, with an average cost of $75,653 per coin and an unrealized loss of -$10.58B. A similar signal preceded the company's July 27 announcement, strengthening expectations for a treasury update on Monday. However, MicroStrategy's real-time ledger reflects two recent Bitcoin sales totaling 3,588 BTC, reducing holdings from 847,363 BTC to the current 843,775 BTC. The company stated these sales funded preferred stock dividends and replenished its U.S. dollar reserve. Recent reports indicate the company made no Bitcoin purchases the week ending July 26 while increasing its dollar reserve to approximately $3.75B. The company faces financial headwinds after reporting an $8.33B operating loss for Q2 2026, including an $8.32B unrealized loss on its digital assets. Management may sell up to $1.25B more in Bitcoin to meet cash obligations. The expected Monday update will reveal if the "Bitcoin Drive" signal marks a return to accumulation as MicroStrategy balances its massive Bitcoin stash against growing cash commitments.

cryptonews.ru1h ago

Bitcoin Boom in Full Swing: Saylor's Latest Statement Fuels Buying Speculation

cryptonews.ru1h ago

Trading

Spot

Hot Articles

Discussions

Welcome to the HTX Community. Here, you can stay informed about the latest platform developments and gain access to professional market insights. Users' opinions on the price of S (S) are presented below.

活动图片