Why LAB crypto’s 34% crash has traders watching THIS support

ambcryptoPublicado a 2026-07-02Actualizado a 2026-07-02

Resumen

LAB crypto experienced a sharp 34% crash to $9.00, driven by the unwinding of excessive leverage and concerns over upcoming token unlocks and concentrated ownership. Despite a 121% surge in daily trading volume to $58.71 million, market activity was dominated by position closures, with Open Interest falling 23% to $130.39 million, indicating a broad reduction in speculative exposure without significant new buying. The price is now testing a crucial support level at $7.65, with the MACD indicating strong bearish momentum. A breakdown below this support could target the next major level near $4.00. Persistent negative funding rates confirm that short sellers remain in control of the derivatives market, sustaining the bearish pressure. The token's near-term outlook hinges on whether buyers can successfully defend the $7.65 support zone.

LAB recorded one of its sharpest daily declines after excessive leverage unwound and tokenomics concerns weighed heavily on sentiment. At the time of writing, the token traded at $9.00, down 34% over the past 24 hours, while its market capitalization declined to $3.88 billion.

Despite the sell-off, trading activity accelerated as daily volume climbed 121% to approximately $58.71 million, showing that market participation increased during the decline. Reports highlighting upcoming token unlocks and concerns over concentrated token ownership added further pressure, prompting participants to reassess LAB’s valuation.

As a result, leveraged positions closed rapidly, while heightened uncertainty encouraged additional selling across both spot and derivatives markets.

Leverage rapidly disappeared from LAB’s market

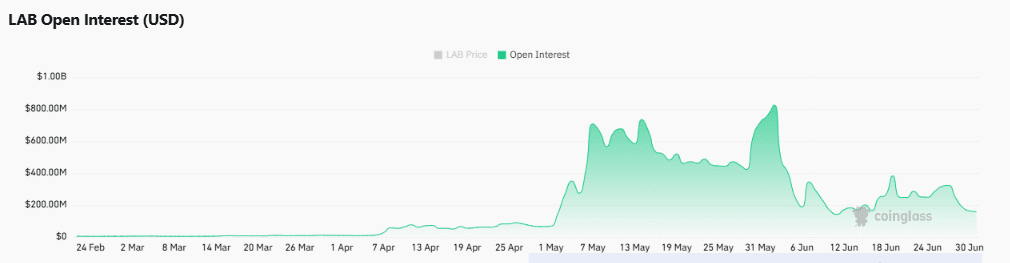
During the decline, derivatives activity reflected a broad reduction in speculative exposure rather than fresh risk-taking.

At press time, Open Interest (OI) fell 23.01% to $130.39 million, indicating that traders closed positions instead of adding new leverage during the decline. The contraction suggests that long positions absorbed most of the selling pressure as the market reacted to deteriorating sentiment.

Trading volume remained elevated despite the decline in OI, reinforcing the view that position unwinding dominated market activity. However, the absence of rising OI alongside heavy volume showed that new buyers had not stepped in aggressively.

Instead, capital exited leveraged positions while participants reduced exposure amid growing uncertainty surrounding LAB’s near-term outlook.
Source: CoinGlass

Can LAB defend its final support zone?

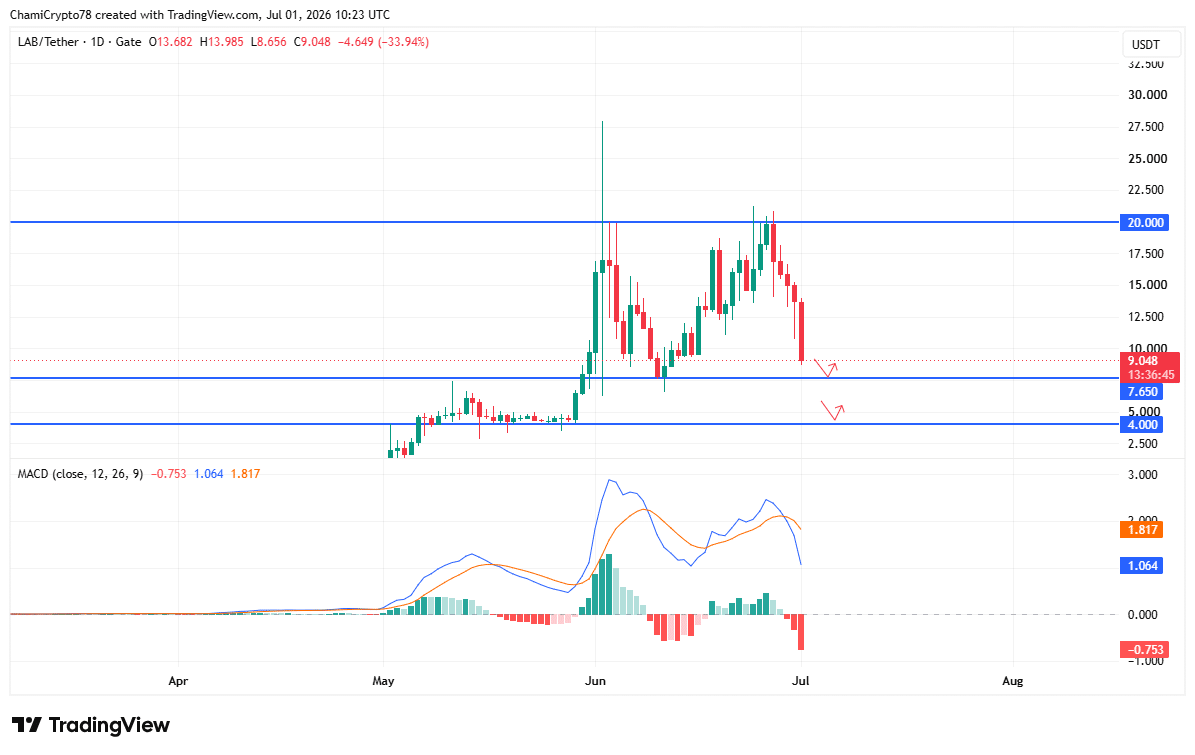
LAB approached the $7.65 support after a sharp rejection from the $20 resistance area, leaving sellers firmly in control of the broader trend.

Price closed near $9.04, placing the token only a short distance above this key demand level. At the time of writing, the MACD remained bearish as the MACD line stayed below the signal line.

The histogram continued expanding deeper into negative territory, confirming that downside pressure had strengthened throughout the latest decline. A decisive loss of $7.65 would expose the next major support near $4.00, where buyers previously emerged.

However, if buyers defend the current zone successfully, LAB could attempt a relief rebound toward $7.65 before challenging higher resistance levels, although confirmation would still require improving technical strength.
Source: TradingView

Why are short sellers still in control?

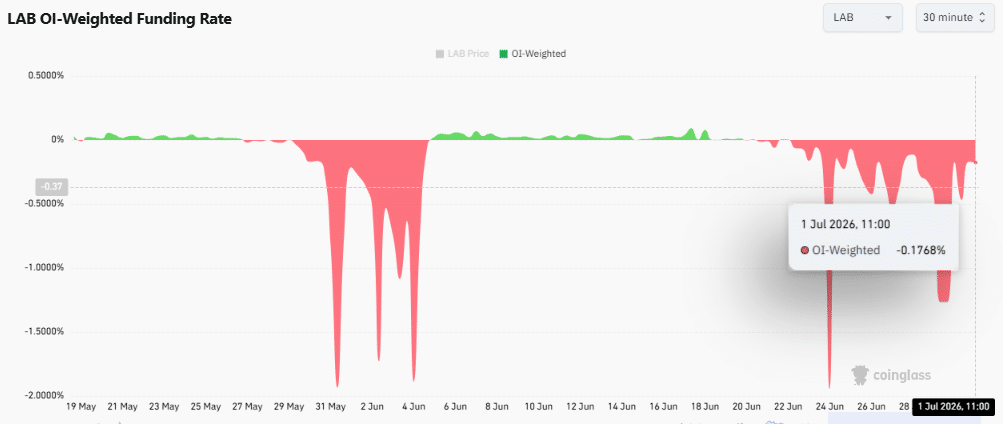
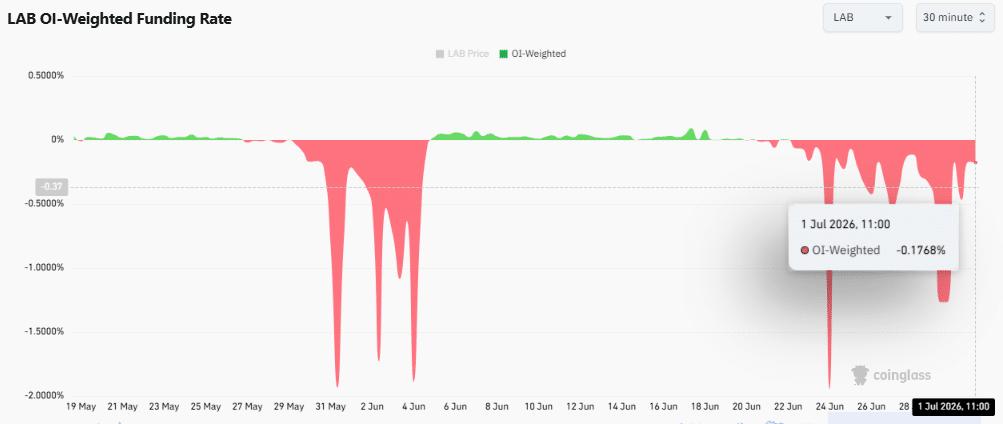
Funding data continued supporting the bearish derivatives outlook as the OI-Weighted Funding Rate remained below zero throughout the recent decline. The latest reading stood at approximately -0.1768%, showing that short sellers continued paying to maintain their positions.

Persistent negative funding reflected sustained bearish conviction despite the sharp correction. Unlike temporary funding dips, this trend extended across several sessions and aligned with the decline in OI, reinforcing the broader risk-off environment.

Although funding had not reached the extreme levels seen earlier in June, it still indicated that bearish positioning dominated the derivatives market. Until funding recovers toward positive territory, sellers would likely retain the upper hand.
Source: CoinGlass

If buyers defend the $7.65 support, the token could stabilize and attempt a recovery.

However, a confirmed breakdown below that level would likely shift attention toward the $4.00 support as bearish pressure remained dominant.


Final Summary

  • LAB trading volume surged while leverage rapidly exited, highlighting aggressive risk reduction across derivatives.
  • Bearish funding and weakening technical structure kept sellers firmly in control near critical support.


Criptos en tendencia

Preguntas relacionadas

QWhat were the main reasons for LAB crypto's 34% price crash mentioned in the article?

AThe main reasons were the unwinding of excessive leverage and concerns over tokenomics, specifically upcoming token unlocks and concentrated token ownership, which weighed heavily on sentiment.

QAccording to the article, what key support level is LAB approaching after its decline?

ALAB is approaching the $7.65 support level after a sharp rejection from the $20 resistance area.

QWhat does the decline in Open Interest (OI) for LAB derivatives indicate about trader behavior?

AThe 23.01% decline in Open Interest indicates that traders were closing existing leveraged positions rather than adding new leverage, showing a broad reduction in speculative exposure and risk-taking during the decline.

QWhat does the persistently negative OI-Weighted Funding Rate suggest about market sentiment?

AThe persistently negative OI-Weighted Funding Rate suggests sustained bearish conviction, with short sellers paying to maintain their positions. It indicates that sellers retain the upper hand and bearish positioning dominates the derivatives market.

QWhat are the potential price targets mentioned if LAB loses the $7.65 support level?

AIf LAB decisively loses the $7.65 support level, it would expose the next major support near $4.00.

Lecturas Relacionadas

Tras tres trimestres consecutivos de caída, ¿puede el mercado cripto encontrar una ventana de estabilización en el tercer trimestre?

El mercado cripto sufrió su peor trimestre desde 2022, con una caída del 12.6% en la capitalización total (ahora en $2.1 billones). El volumen de operaciones y el valor de las stablecoins también disminuyeron, señalando una salida generalizada de capitales. Bitcoin y Ethereum cayeron un 14.2% y 25.4% respectivamente, rompiendo su correlación con los mercados de riesgo tradicionales. Los ETFs de Bitcoin en EE.UU. registraron importantes salidas netas ($4.67 mil millones en Q2), aunque datos sugieren que el ciclo de ventas podría estar cerca de su fin. La atención del mercado se centra ahora en la reunión de la FED a finales de julio, cuya postura (halcón o paloma) podría definir el rango de trading de Bitcoin para el trimestre. El avance de la ley CLARITY en el Senado estadounidense se ha estancado, reduciendo la probabilidad de aprobación en 2026 y manteniendo una prima de riesgo regulatorio alta. Solo dos sectores mostraron crecimiento: los mercados de predicción (volumen +48.7%) y los coleccionables tokenizados (volumen +143% vs. Q1). El sentimiento general es de cautela. La lógica del mercado ha cambiado, priorizando fundamentos como la política monetaria y la regulación frente a los simples impulsos narrativos. Aunque las bases para una caída extrema parecen limitadas, la recuperación sostenida en Q3 depende críticamente de la FED y de un posible progreso regulatorio.

marsbitHace 15 hora(s)

Tras tres trimestres consecutivos de caída, ¿puede el mercado cripto encontrar una ventana de estabilización en el tercer trimestre?

marsbitHace 15 hora(s)

BIT Trading Moments: BTC aún presionado por la EMA 200 semanal, tras el rechazo podría reiniciar la caída, los valores de almacenamiento y semiconductores que subieron fuertemente anoche comenzaron a caer en la sesión nocturna

**BIT Trading Moments: BTC aún presionado por la EMA 200 semanal; almacenamiento y semiconductores caen en el after-hours** El mercado de cripto continúa su recuperación, con **Bitcoin** manteniéndose cerca de los $66,000. Enfrenta una fuerte resistencia en la zona de los $68,000, nivel que coincide con el costo promedio de los inversores en los últimos cinco meses y un punto de fallo anterior. Los analistas señalan que se encuentra atrapado entre la media móvil simple (MA) de 200 semanas (~$63,333) y la media exponencial (EMA) de 200 semanas (~$68,328). Se necesitaría un cierre semanal por debajo de $55,000 o por encima de $70,000 para confirmar una dirección de mayor alcance. Los ETF de Bitcoin registran entradas netas por sexto día consecutivo. En Wall Street, los **futuros de los principales índices** caen. Después de fuertes ganancias el martes, las acciones de **semiconductores y almacenamiento** retroceden en el after-hours: el ETF de semiconductores cae un 2.22%, Micron un 2.29% y SK Hynix casi un 5%. Sin embargo, **Super Micro Computer (SMCI)** se dispara más de un 20% tras el cierre, impulsada por sólidos pedidos. Otras noticias positivas incluyen un contrato de $266M de la Fuerza Aérea para **Rocket Lab**. A pesar del repunte bursátil, factores como el **crudo Brent por encima de $91** y el **rendimiento del bono estadounidense a 10 años subiendo a ~4.64%** generan preocupaciones inflacionarias y enfrían el optimismo. Las acciones relacionadas con cripto, como Coinbase y Robinhood, tuvieron un buen desempeño apoyadas por avances regulatorios. En Asia, los mercados siguieron la recuperación tecnológica. El **índice KOSPI de Corea del Sur** subió un 0.74%, con acciones de semiconductores mostrando volatilidad. El principal riesgo es el **yen japonés**, que tocó su nivel más bajo desde 1986, lo que genera temores a una intervención del gobierno. **Próximos eventos clave:** Este miércoles 22 de julio, el enfoque está en los eventos de **AMD AI** y los resultados financieros de **Alphabet (Google), Tesla e IBM** después del cierre. El jueves 23, la **decisión de tasas del BCE** y los resultados de **Intel** serán cruciales para el sentimiento del mercado.

marsbitHace 15 hora(s)

BIT Trading Moments: BTC aún presionado por la EMA 200 semanal, tras el rechazo podría reiniciar la caída, los valores de almacenamiento y semiconductores que subieron fuertemente anoche comenzaron a caer en la sesión nocturna

marsbitHace 15 hora(s)

Trading

Spot

Artículos destacados

Cómo comprar ONE

¡Bienvenido a HTX.com! Hemos hecho que comprar Harmony (ONE) sea simple y conveniente. Sigue nuestra guía paso a paso para iniciar tu viaje de criptos.Paso 1: crea tu cuenta HTXUtiliza tu correo electrónico o número de teléfono para registrarte y obtener una cuenta gratuita en HTX. Experimenta un proceso de registro sin complicaciones y desbloquea todas las funciones.Obtener mi cuentaPaso 2: ve a Comprar cripto y elige tu método de pagoTarjeta de crédito/débito: usa tu Visa o Mastercard para comprar Harmony (ONE) al instante.Saldo: utiliza fondos del saldo de tu cuenta HTX para tradear sin problemas.Terceros: hemos agregado métodos de pago populares como Google Pay y Apple Pay para mejorar la comodidad.P2P: tradear directamente con otros usuarios en HTX.Over-the-Counter (OTC): ofrecemos servicios personalizados y tipos de cambio competitivos para los traders.Paso 3: guarda tu Harmony (ONE)Después de comprar tu Harmony (ONE), guárdalo en tu cuenta HTX. Alternativamente, puedes enviarlo a otro lugar mediante transferencia blockchain o utilizarlo para tradear otras criptomonedas.Paso 4: tradear Harmony (ONE)Tradear fácilmente con Harmony (ONE) en HTX's mercado spot. Simplemente accede a tu cuenta, selecciona tu par de trading, ejecuta tus trades y monitorea en tiempo real. Ofrecemos una experiencia fácil de usar tanto para principiantes como para traders experimentados.

588 Vistas totalesPublicado en 2024.12.12Actualizado en 2026.06.02

Cómo comprar ONE

Discusiones

Bienvenido a la comunidad de HTX. Aquí puedes mantenerte informado sobre los últimos desarrollos de la plataforma y acceder a análisis profesionales del mercado. A continuación se presentan las opiniones de los usuarios sobre el precio de ONE (ONE).

活动图片