Unsteady Ground, Room to Bounce

insights.glassnodePubblicato 2026-03-04Pubblicato ultima volta 2026-03-04

Introduzione

Bitcoin remains in a tenuous consolidation below the $70k resistance level, with weakening buy-side momentum and declining realized profits. The Percent of Supply in Profit has fallen to levels historically associated with early bear markets. Short-term holder cost basis near $70k presents a key resistance zone. However, signs of stabilization are emerging: spot and ETF selling pressure is moderating, derivatives leverage is compressing, and options markets show fading downside fear with growing upside call interest around the $75k strike. The market appears to be transitioning from a stressed regime toward a more balanced state, though a sustained recovery depends on renewed spot demand.

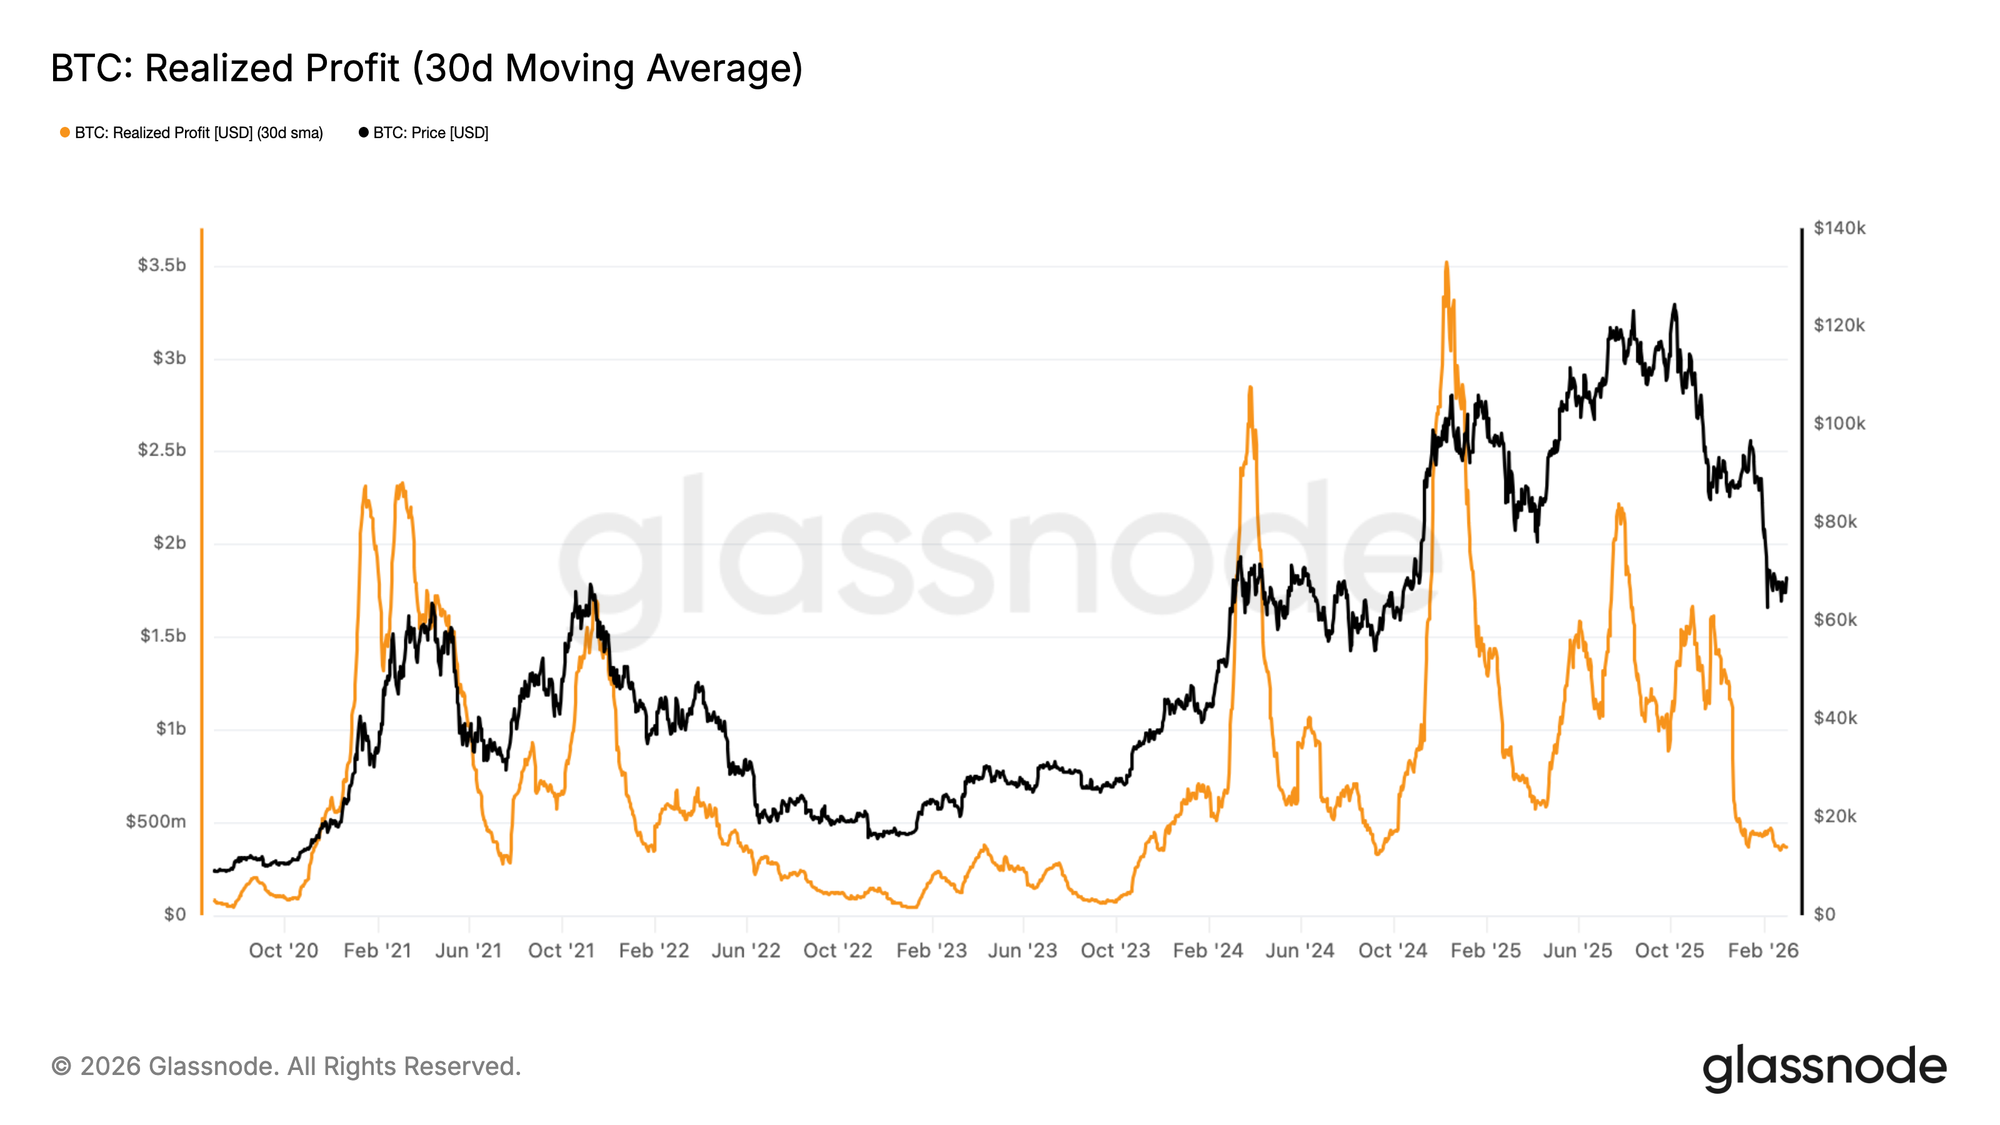
Since early February, Bitcoin has repeatedly failed to post a weekly close above $70k, establishing this region as a meaningful near-term resistance level. To assess whether this price rejection reflects a genuine deterioration in demand, we turn to the 30-day Simple Moving Average (30D-SMA) of Realized Profit, a metric that aggregates the USD-denominated profit locked in by on-chain participants at the moment coins are spent, smoothed to filter short-term noise.

As price stabilized beneath the $70K threshold, this indicator contracted sharply from above $1B per day to approximately $370M per day, a decline of roughly 63%. This compression in monthly-averaged realized profit signals that the cohort of buyers willing to transact at a premium has materially thinned, with buy-side liquidity now at its weakest since the August–September 2024 period.
Taken together, the evidence suggests that upside momentum has stalled, leaving the price in a state of directionless consolidation until fresh demand catalysts emerge.
Live Chart

Regime Detection in Bear Market

Sideways price action is a recurring structure across both bull and bear market cycles, therefore context is everything. Two periods of horizontal consolidation can carry vastly different implications depending on the underlying demand regime, making it essential to look beneath price for corroborating evidence.

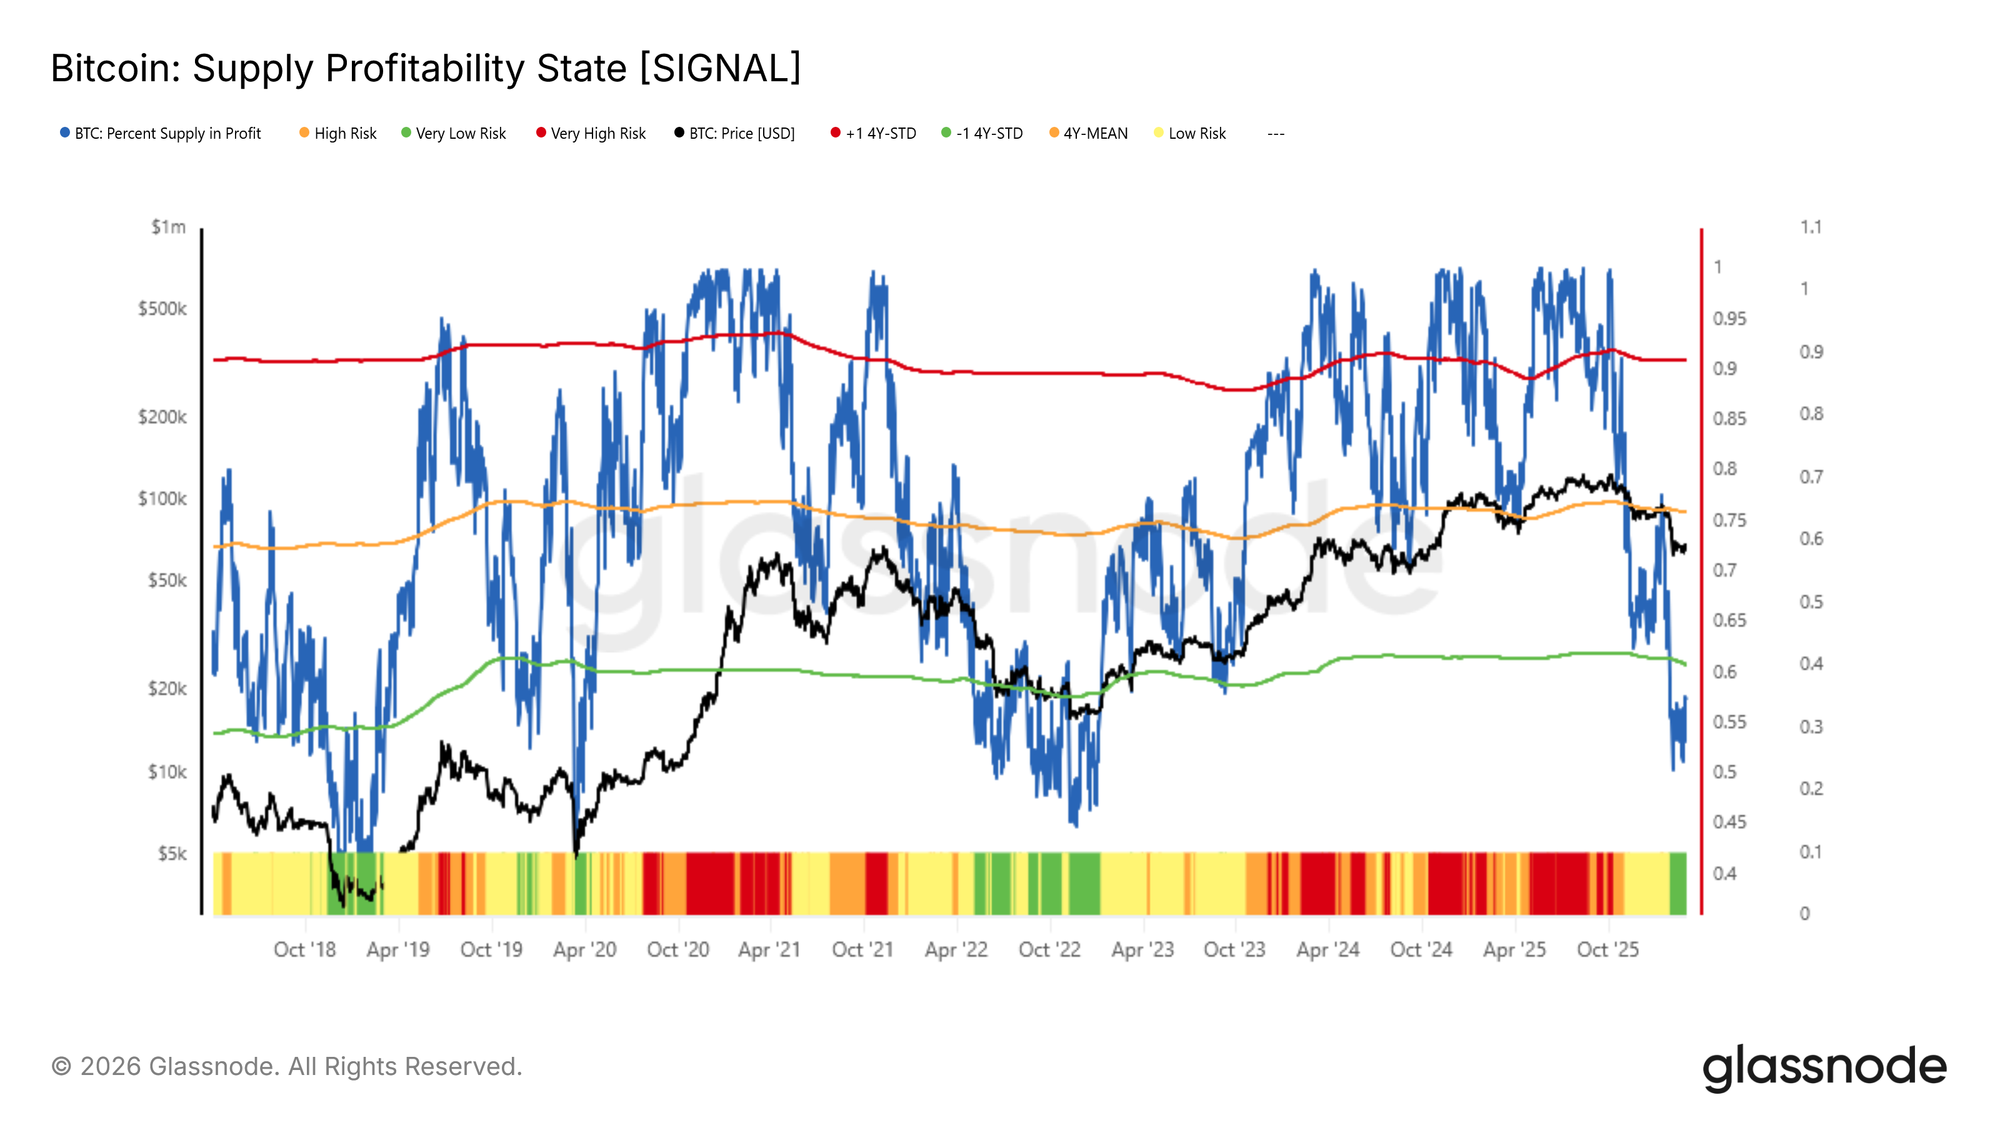
One effective lens for this purpose is the Percent of Supply in Profit, which measures the share of circulating Bitcoin supply held at an unrealized gain relative to each coin's on-chain acquisition cost.

When broadly elevated, this metric reflects widespread investor confidence; when it deteriorates, it signals a growing cohort of underwater holders, a condition historically associated with sustained selling pressure.

Since early February, this indicator has broken below its -1 standard deviation threshold near 60%, and currently sits at approximately 57%. Readings at this level have historically coincided with the early stages of deep bear markets, most notably May 2022 and November 2018. This suggests the present consolidation may be less a springboard for recovery, and more a continuation of the prevailing adverse market regime in mid-term.
Live Chart

Short-Term Relief Rallies and the Cost Basis Ceiling

Despite the headwinds posed by diminishing buy-side liquidity and a market regime starved of broad unrealized profitability, the multi-week sideways consolidation is not without a constructive interpretation. A local equilibrium of this nature can, and often does, precede short-term relief rallies.

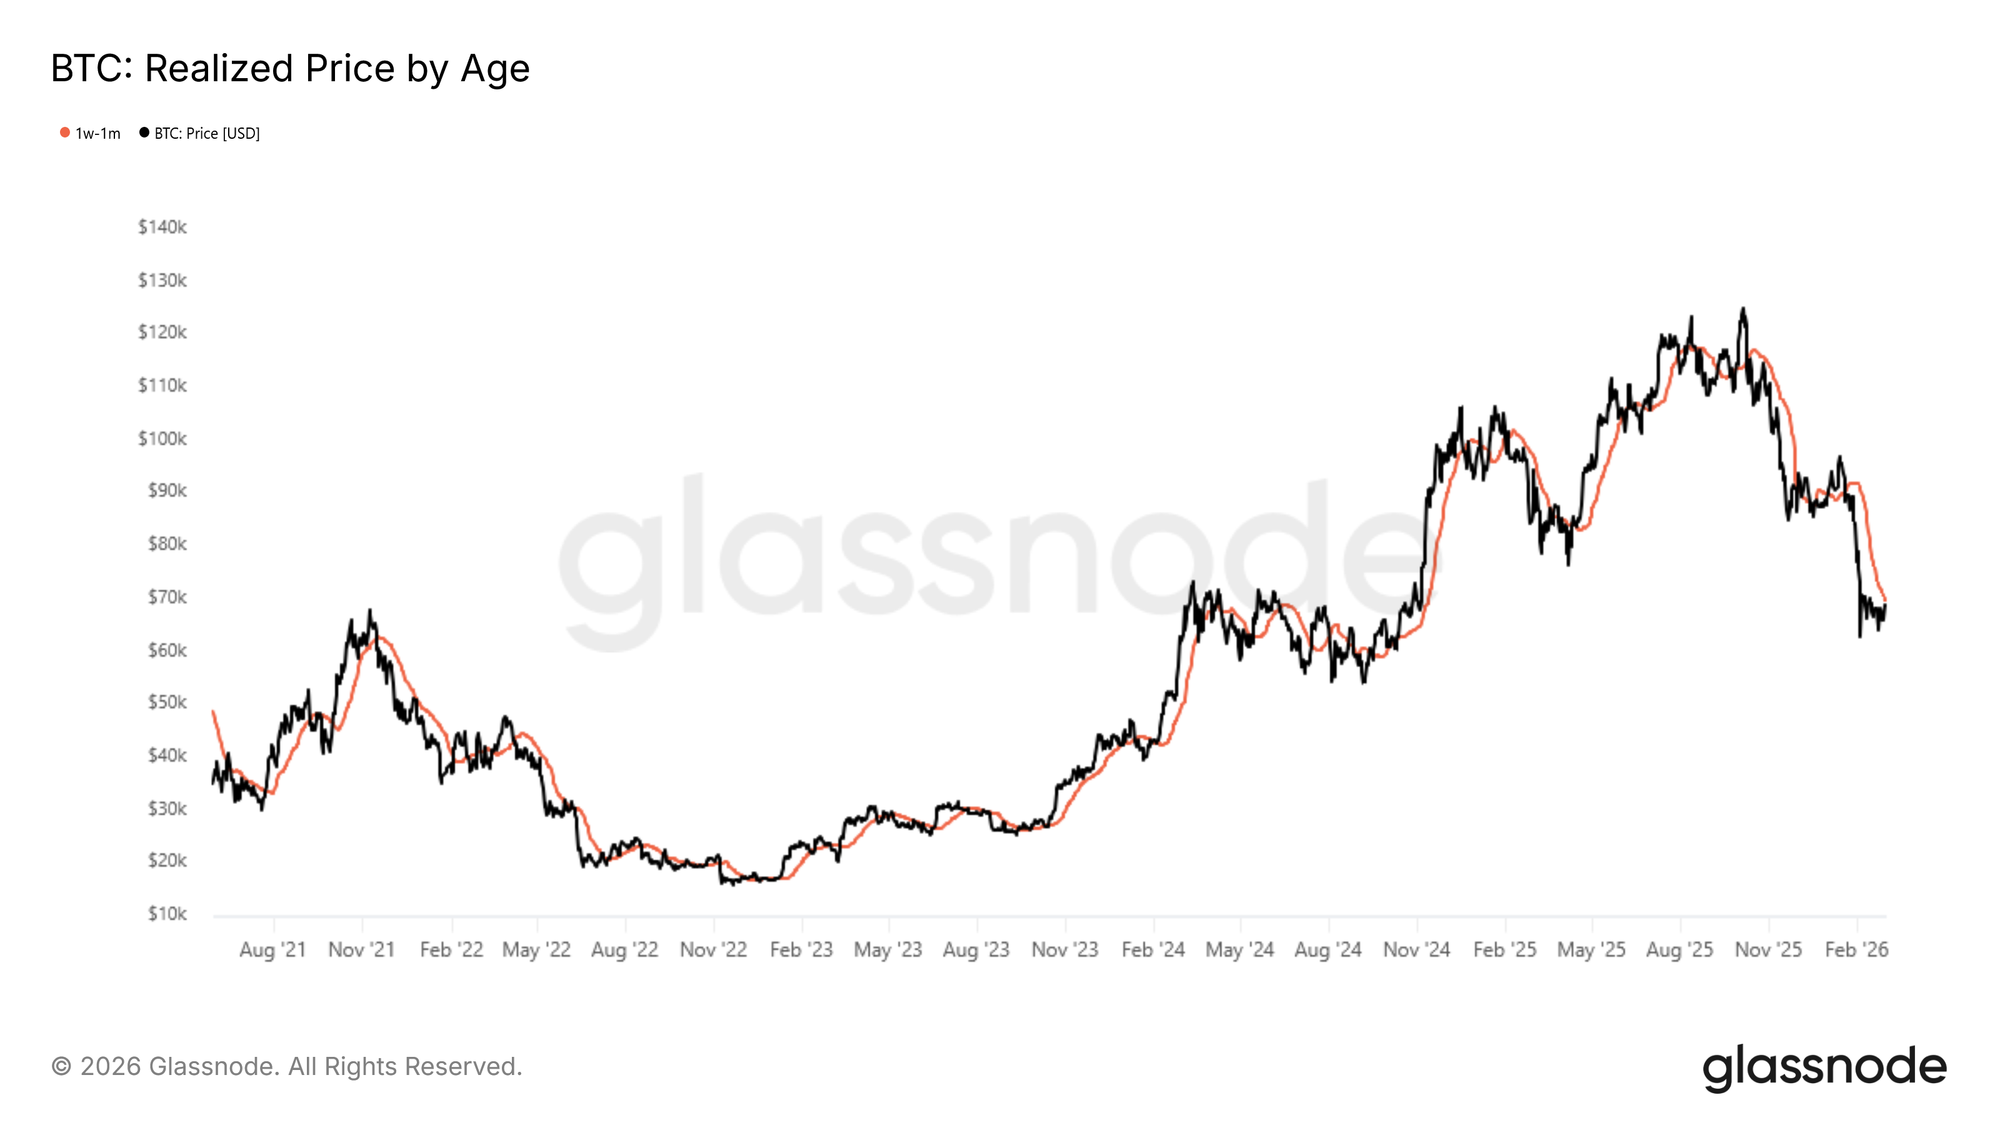
A practical on-chain tool for gauging the potential exhaustion point of such rallies is the Short-Term Holder Cost Basis, specifically for coins aged between one week and one month. This cohort represents the most recent wave of market participants, whose acquisition price acts as a key behavioral anchor: in the deeper stages of a bear market, local bounces tend to stall as these recent buyers approach breakeven, incentivizing them to exit positions or lock in thin profit margins before conditions deteriorate further.

Currently, the cost basis of this 1W–1M holder cohort sits near $70k, meaning the ±2% zone surrounding this level — roughly $68.5k to $71.5k— represents a significant potential resistance and distribution zone for any near-term price recovery.
Live Chart

Off-Chain Insights

Spot Flows Shows Signs of Recovery

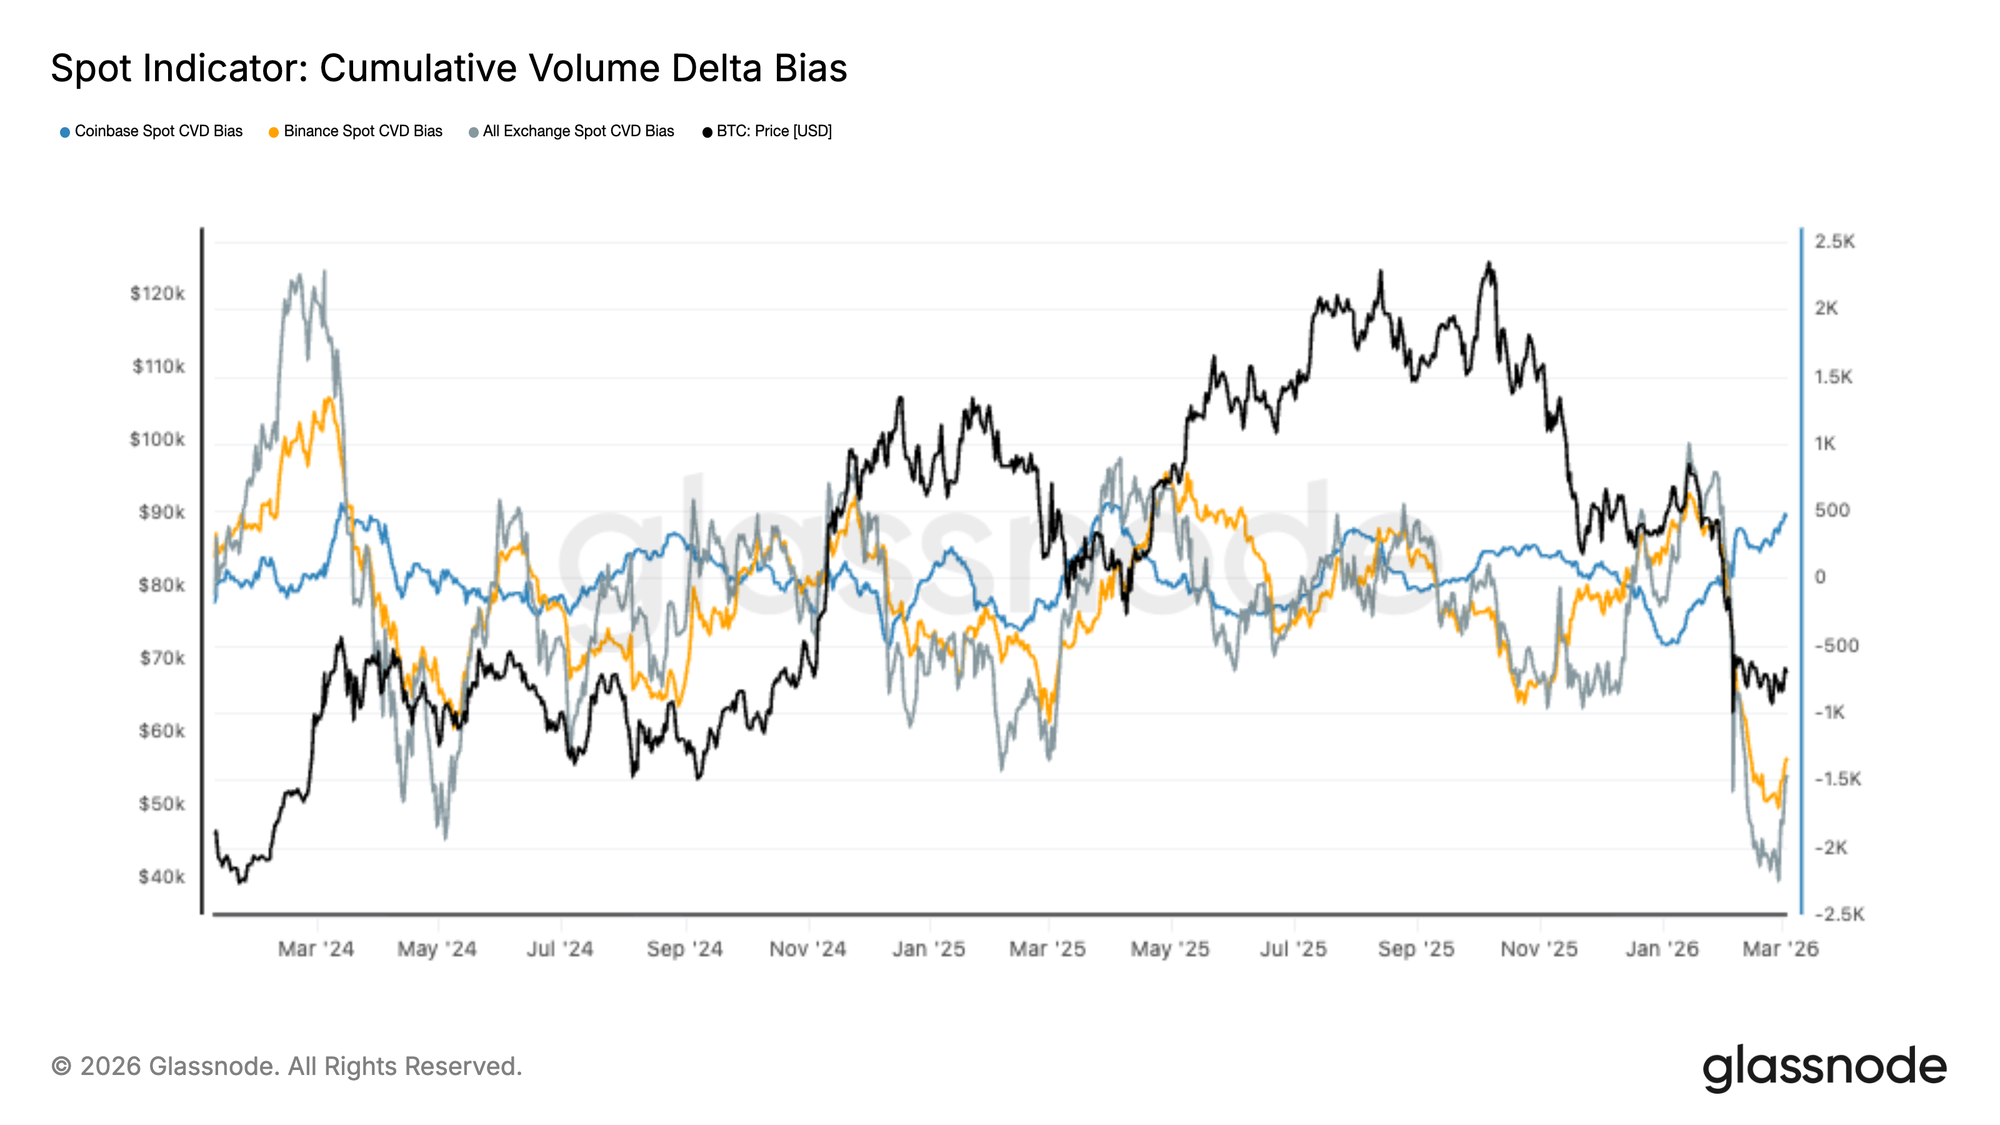
Spot markets recently experienced a sharp wave of sell-side dominance, with Cumulative Volume Delta (CVD) across major exchanges plunging to deeply negative levels as aggressive market sell orders drove the latest price drawdown.

Over the past few days, however, the pace of selling appears to be moderating. Coinbase spot CVD has begun to rebound, suggesting early signs of renewed bid-side activity, while Binance and aggregate exchange flows remain weak but are no longer accelerating lower.

This shift hints that the most intense phase of spot-driven distribution may be easing. Nevertheless, a sustained recovery will likely require broader improvement in spot bid absorption across multiple exchanges before stronger accumulation dynamics can take hold.
Live Chart

ETF Outflows Ease as Early Inflows Reappear

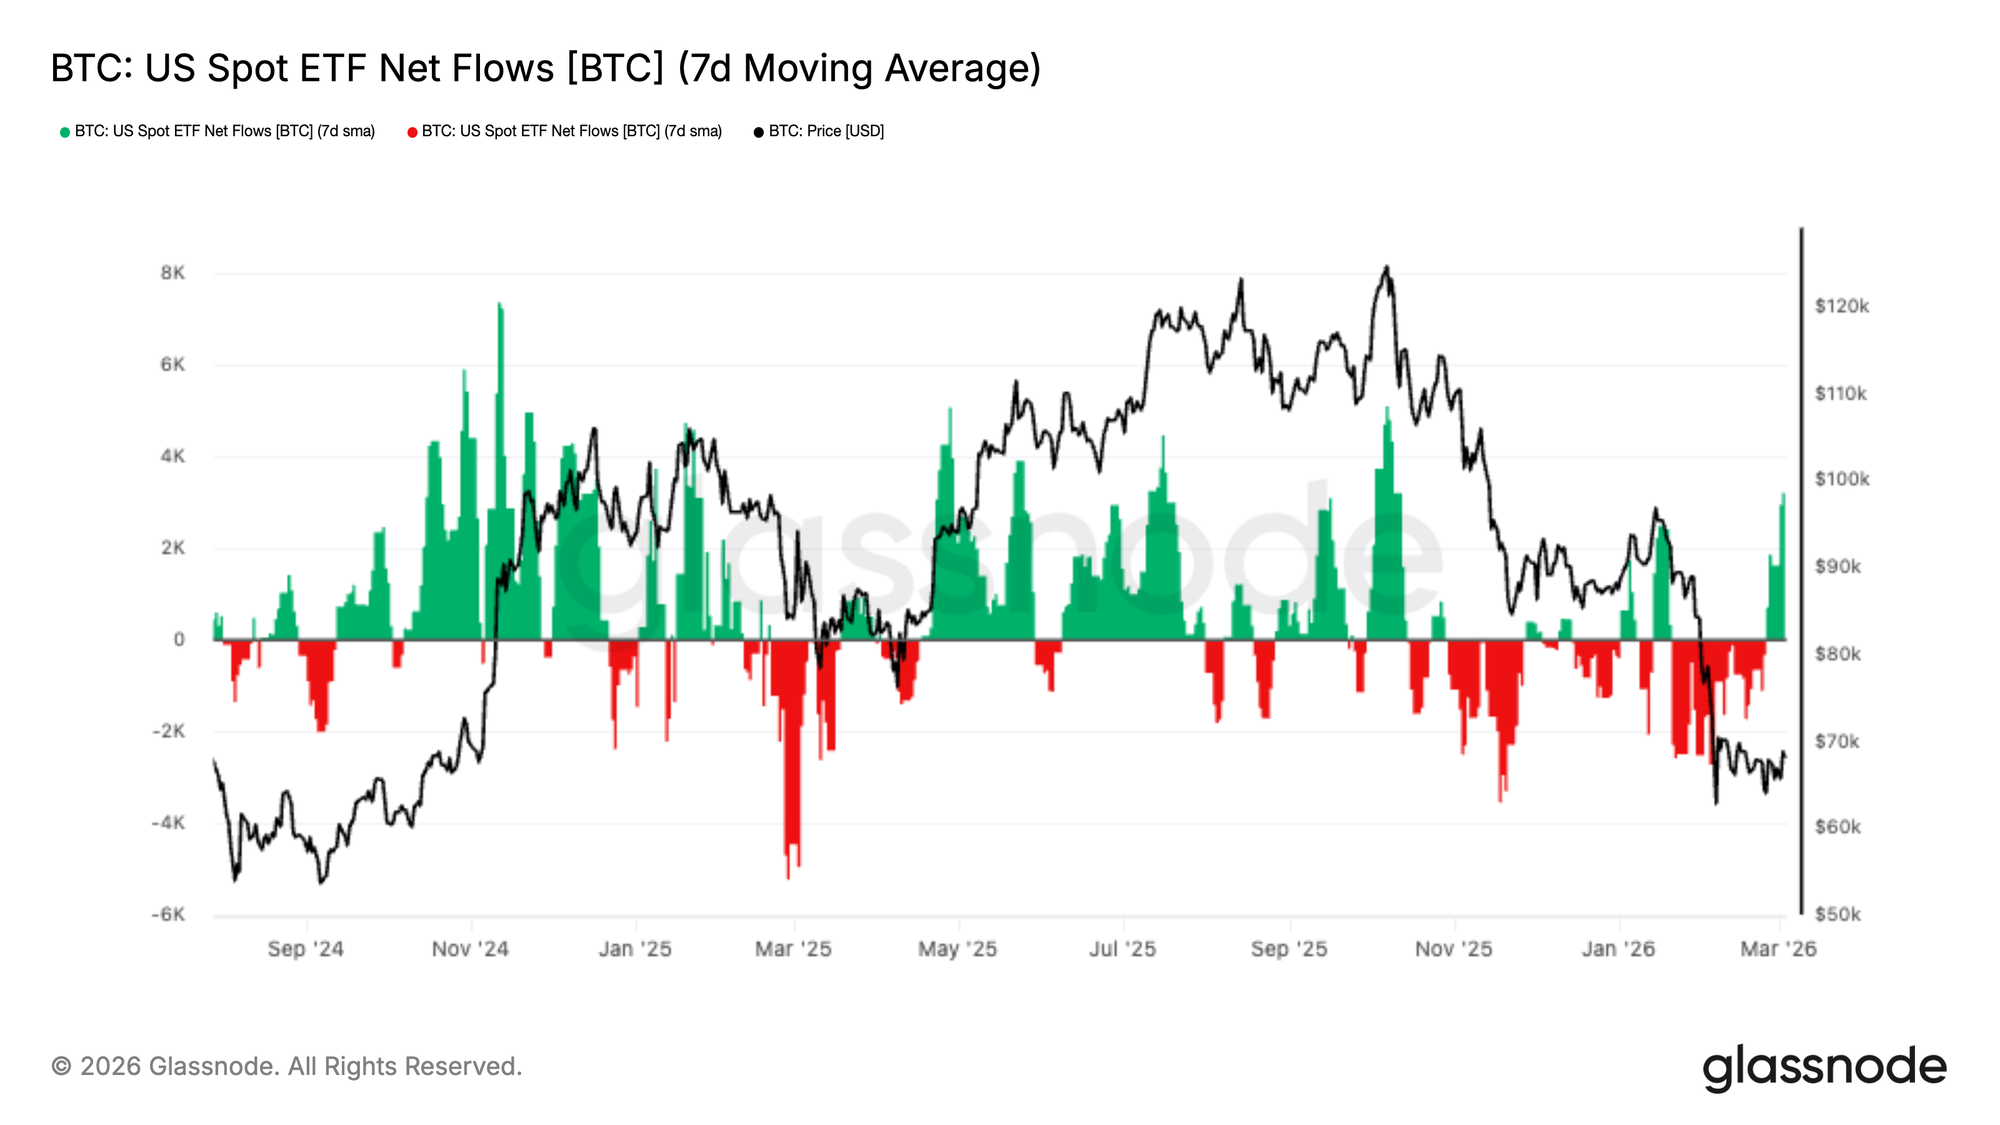
US Spot Bitcoin ETFs experienced sustained outflows during the recent market decline, reflecting persistent institutional de-risking as prices moved lower. The 7-day moving average of net flows remained negative for several weeks, reinforcing the broader risk-off environment across regulated investment channels.

Over the past few days, however, flows have begun to stabilize, with the first signs of renewed inflows emerging. This shift suggests that institutional selling pressure may be moderating as Bitcoin consolidates near recent lows.

While it is too early to confirm a durable reversal in demand, a continued recovery in ETF inflows would signal improving institutional sentiment and could provide an important source of spot-side support for the market.
Live Chart

Perpetual Premium Continues to Compress

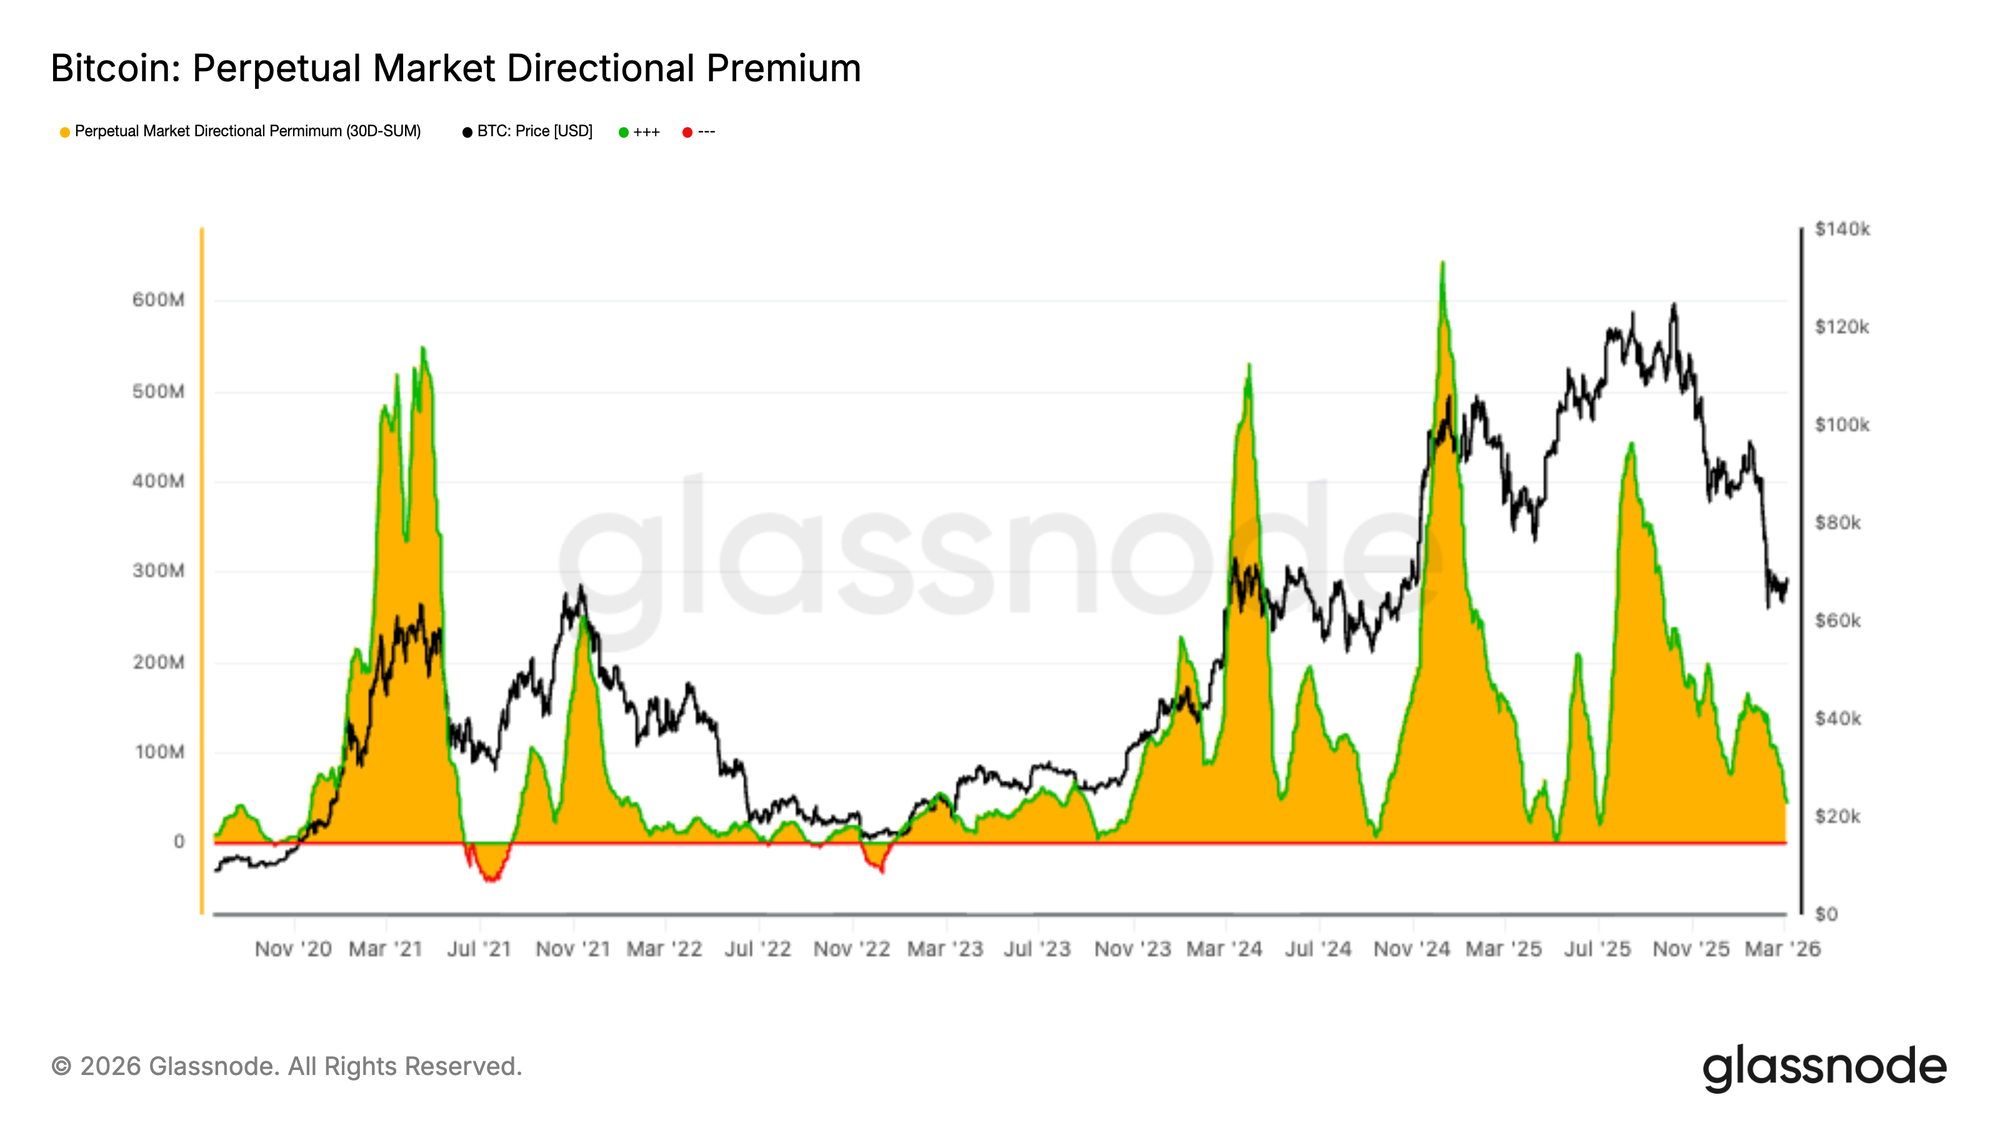
The Perpetual Market Directional Premium continues to trend lower, reflecting a sustained reduction in bullish positioning across perpetual futures markets. The metric has declined steadily in recent weeks as leverage and directional conviction have cooled alongside the broader market pullback.

Over the past few days, the premium has compressed further toward cycle lows, signalling that speculative long exposure is continuing to unwind. This dynamic suggests that derivatives traders remain cautious, with demand for leveraged upside exposure notably subdued.

While the decline reflects weakening bullish momentum, it also indicates that excess leverage is being flushed from the system. A stabilization in the premium could signal that derivatives positioning is approaching a more neutral footing.
Live Chart

Volatility Compression Signals Stabilization

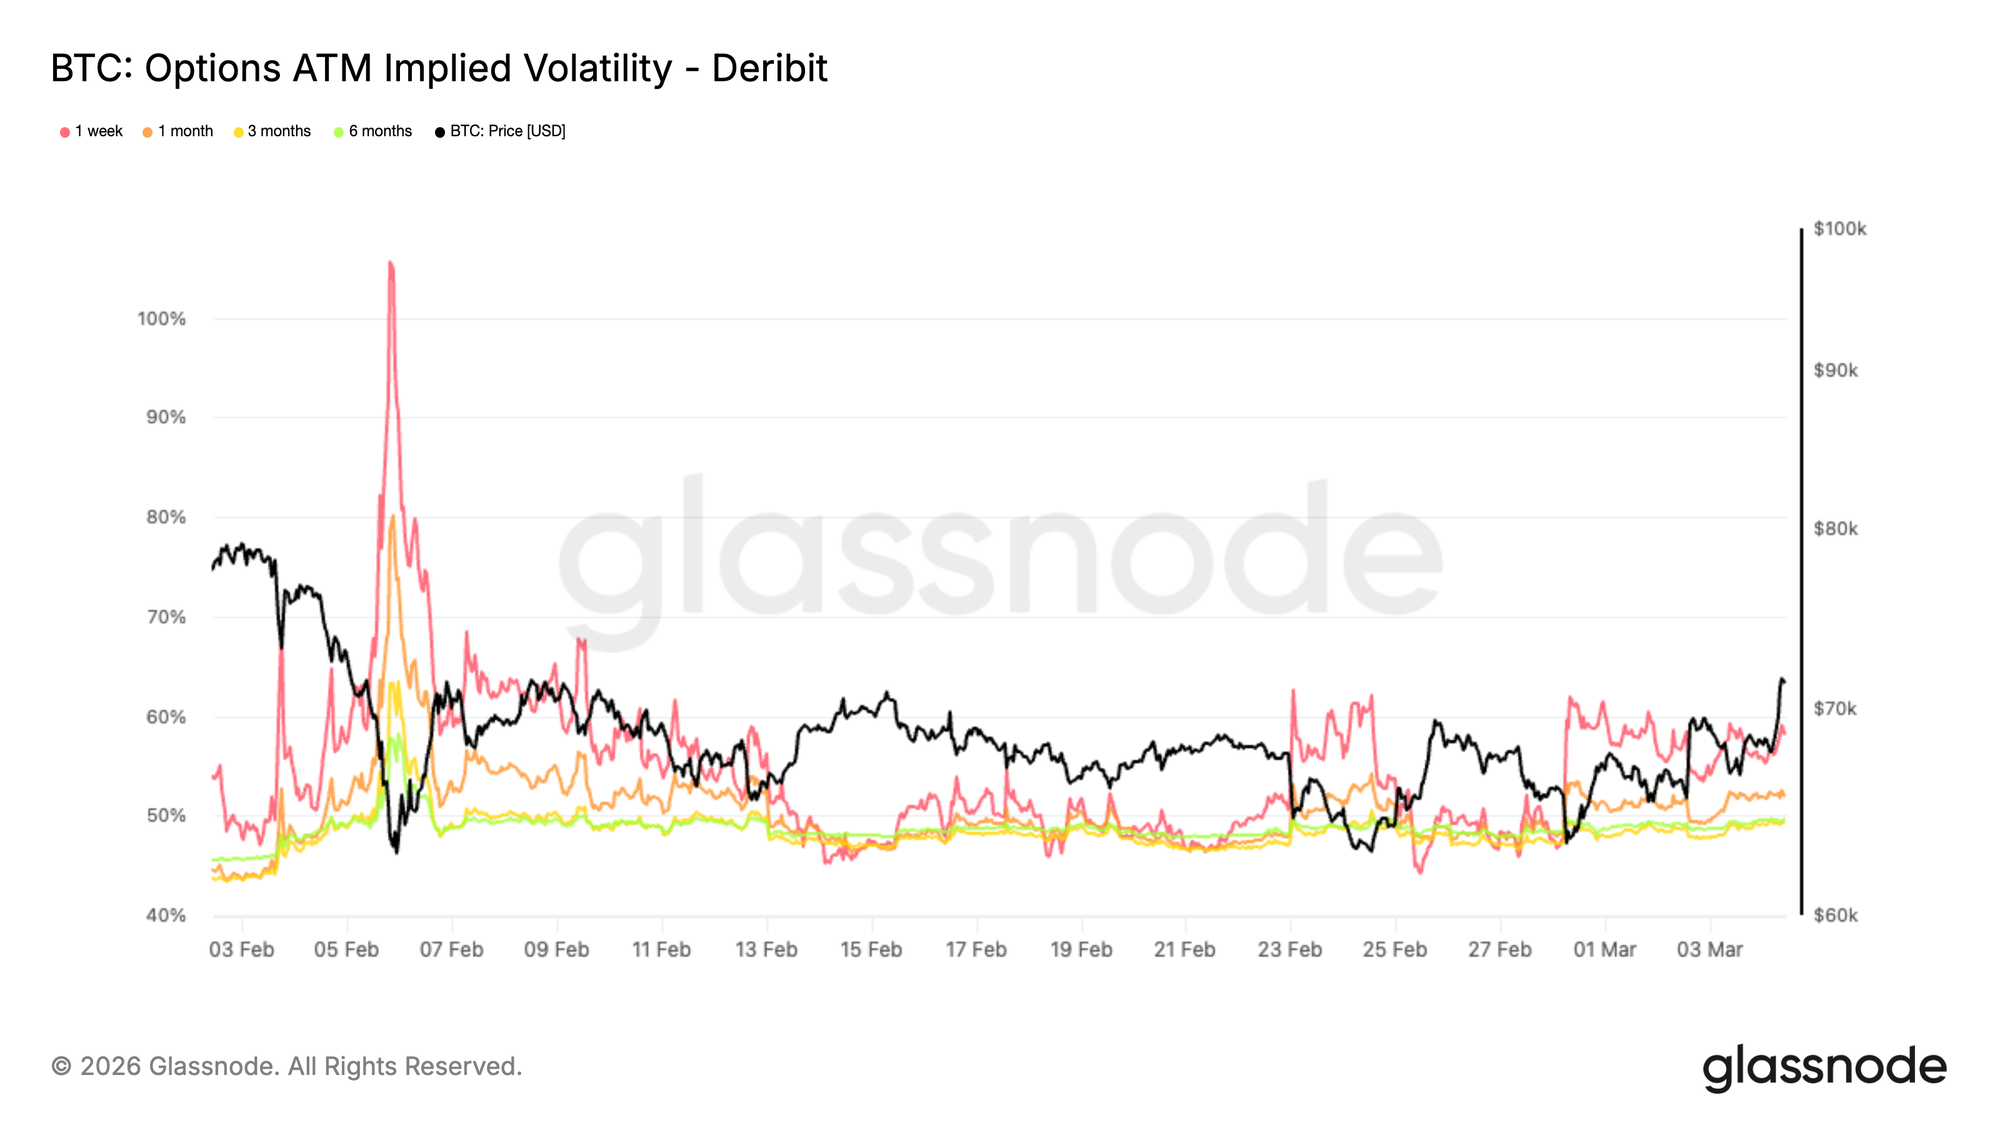
Implied volatility has continued to compress following the spike observed in early February. Across the main tenors, ATM IV has moved materially lower, indicating that traders are no longer aggressively pricing tail risk.

This shift reflects a stabilization in sentiment after a period of forced deleveraging and liquidation-driven volatility. As panic pricing fades, options markets begin transitioning from stress conditions toward a more neutral volatility regime.

Lower implied volatility also changes positioning dynamics. When volatility declines while price stabilizes, long option holders face increasing theta decay, making directional conviction more important.

For now, volatility compression suggests the market is moving away from crisis pricing and into a consolidation phase where positioning, rather than panic hedging, becomes the dominant driver of price action.
Live Chart

Skew Normalization Reflects Fading Downside Fear

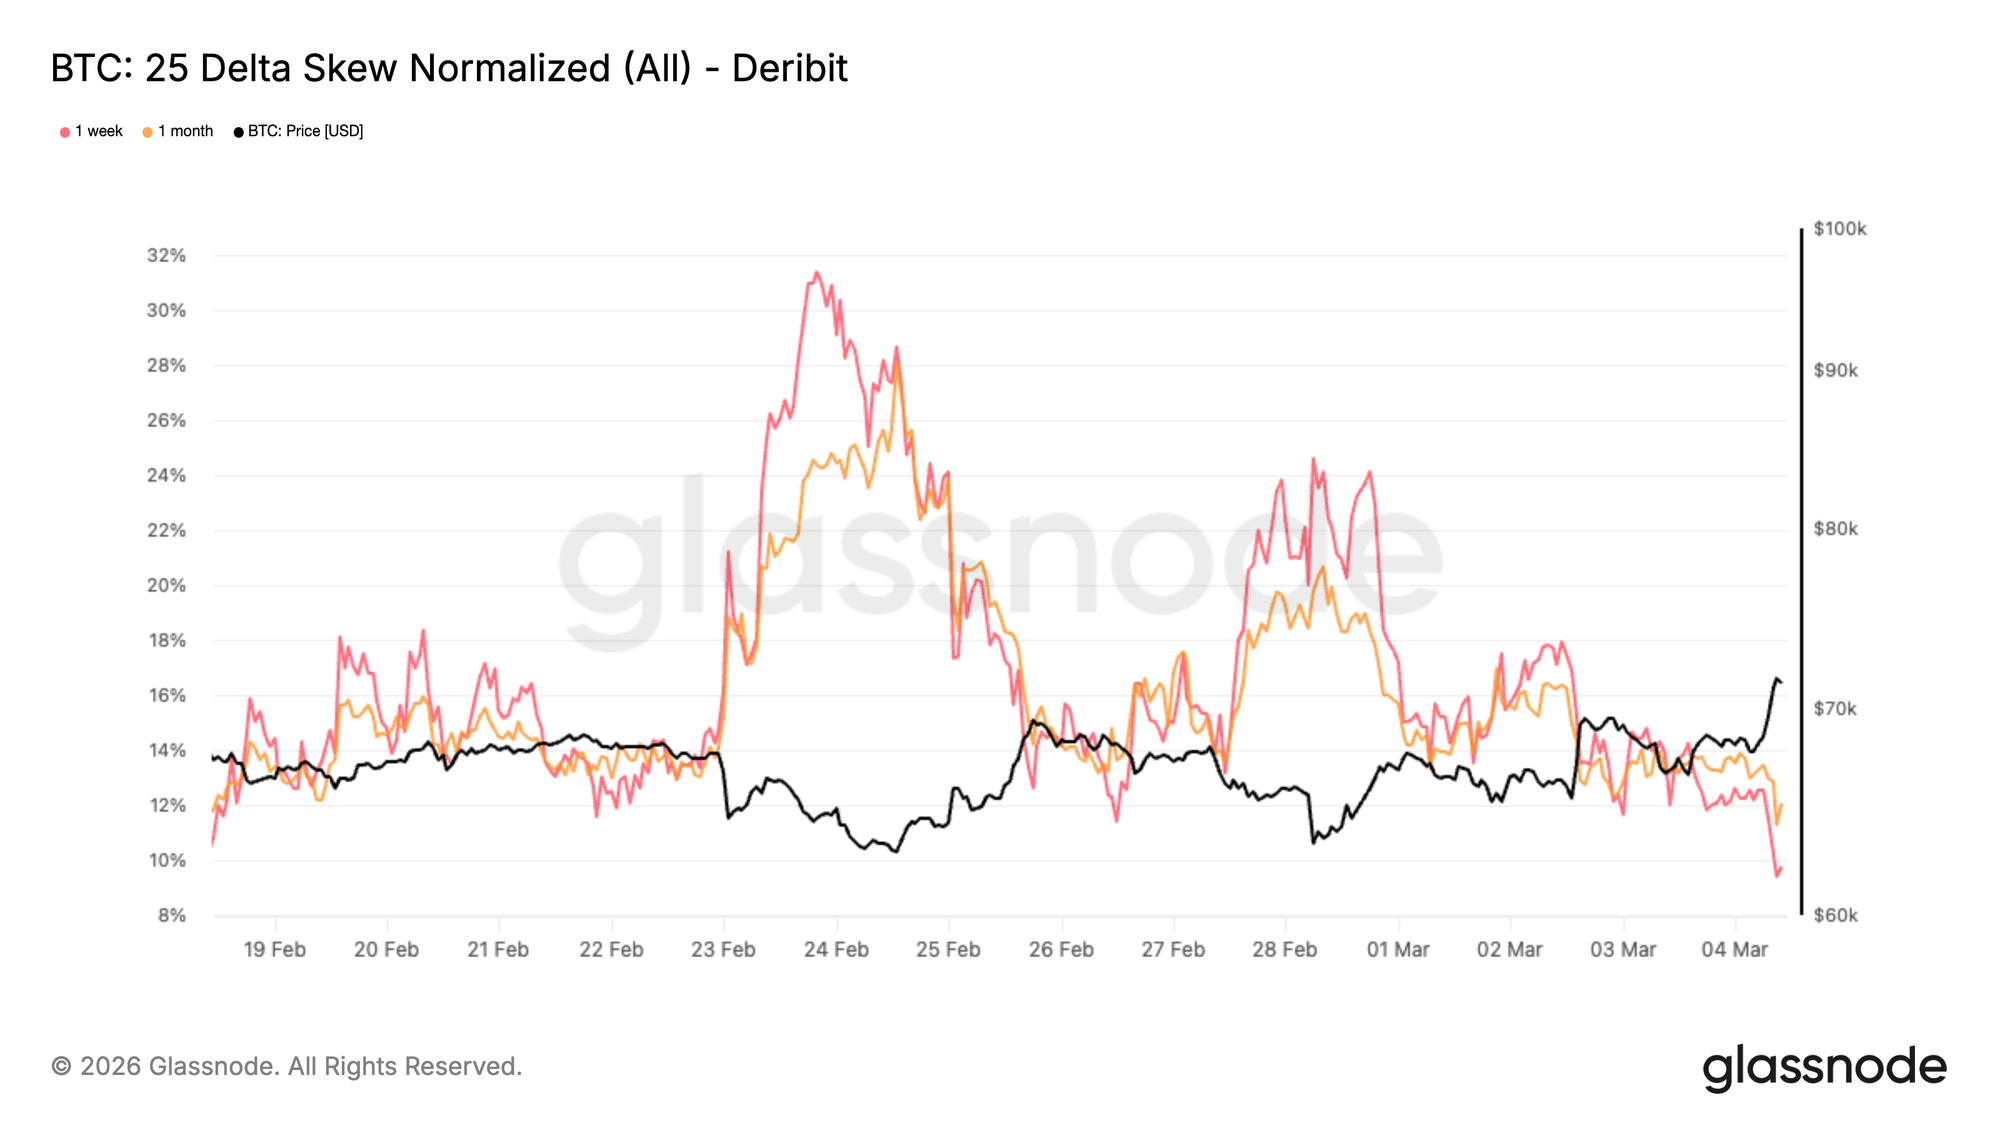
Skew has compressed materially from the extreme levels observed during the February sell-off. Over the past two weeks, as the chart shows, each move lower in BTC price has triggered a progressively milder reaction in the options market. Traders have been far less aggressive in bidding for downside protection, gradually pulling the skew lower. During the peak of the sell-off, put demand surged and pushed skew deep into put territory as traders rushed to hedge against further downside. That urgency has clearly eased.

Rather than a full normalization, what we are seeing is a repricing of risk: skew has moved from the mid-20s to the low-10s, still reflecting demand for protection but at far less stressed levels. This shift suggests that the immediate need for downside hedging is fading. Some protective positioning is being unwound, while interest in upside exposure is slowly reappearing.

Historically, this type of skew compression tends to occur when markets move out of stress phases and begin transitioning into more balanced positioning environments.
Live Chart

Options Flow Rotates Toward Upside Calls

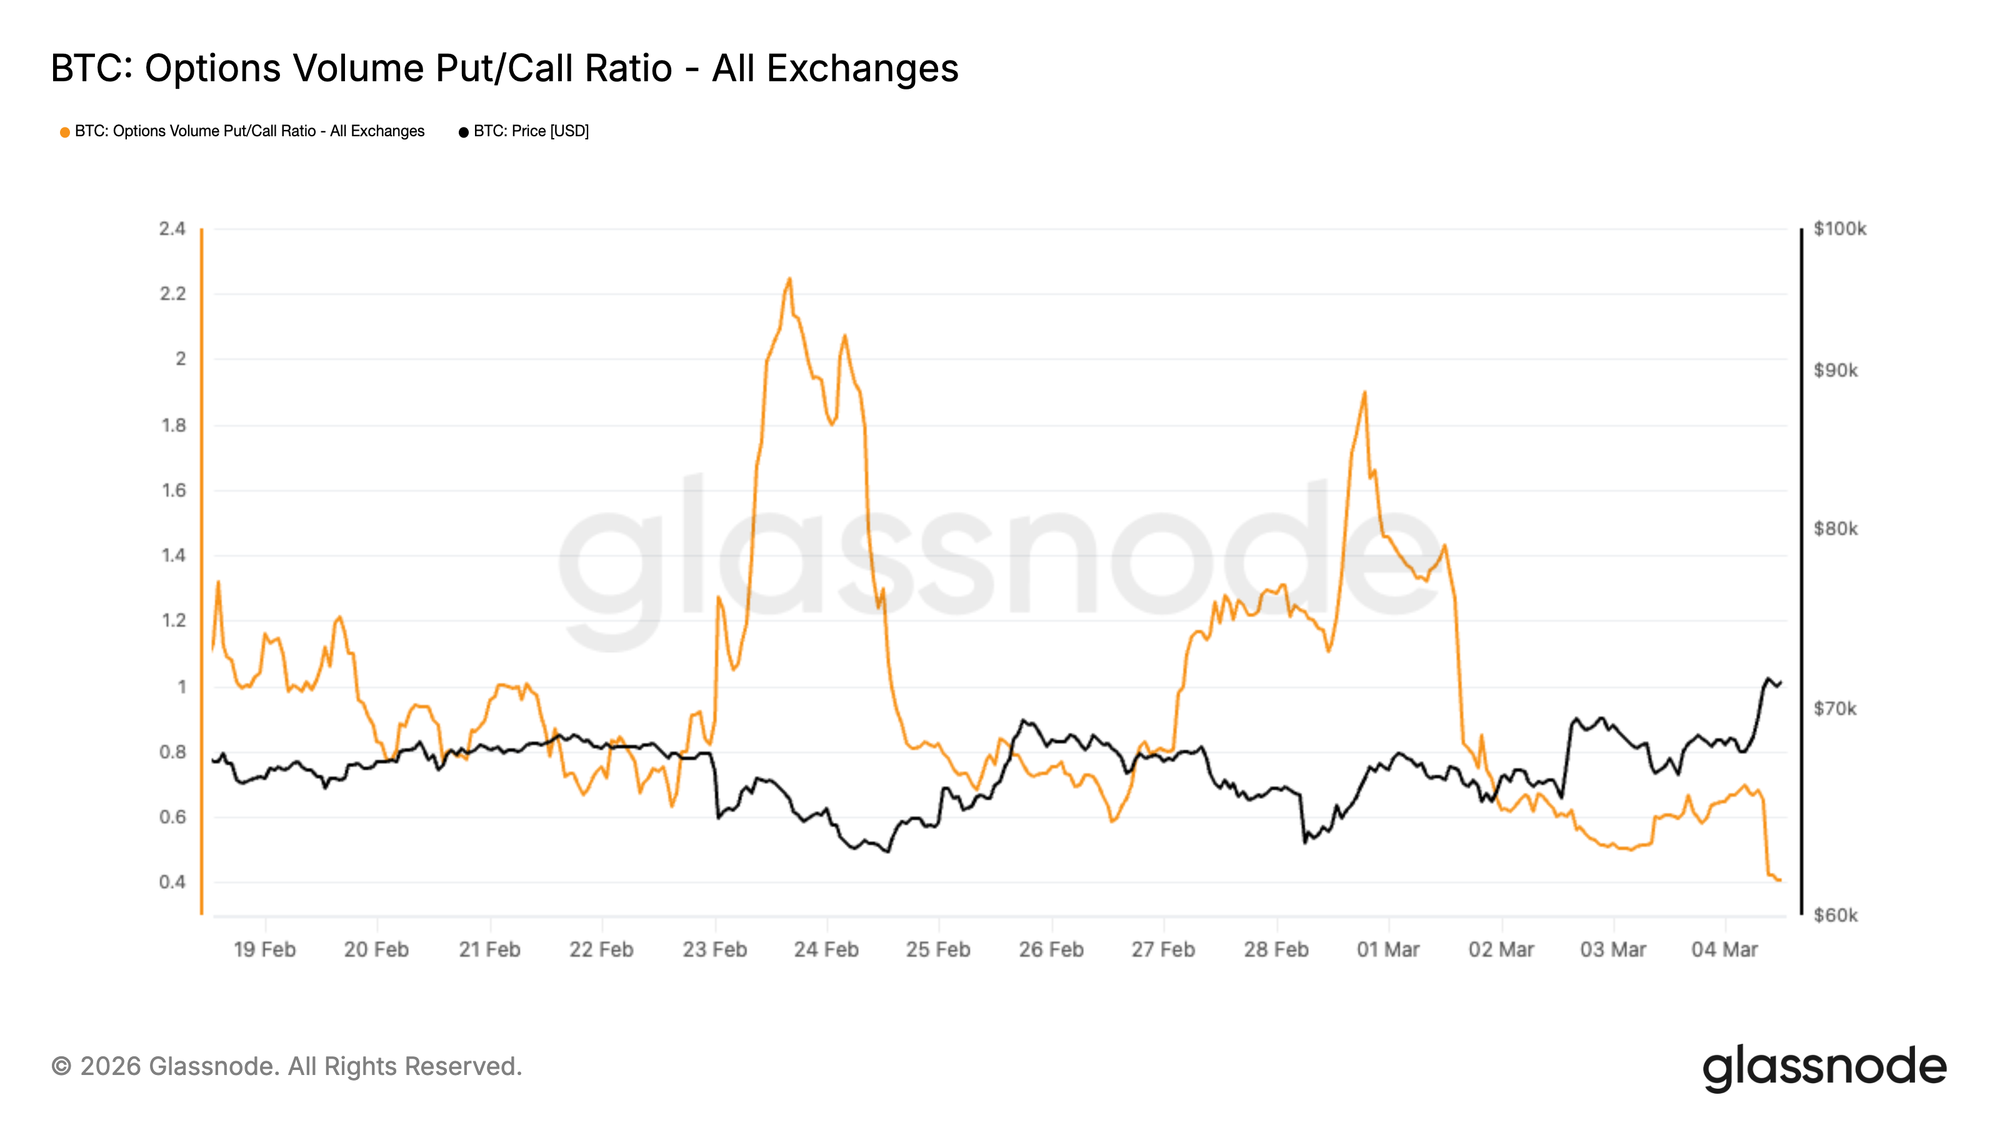
The Put/Call volume ratio measures the relative trading activity between puts and calls. When the ratio declines, it indicates that call activity is increasing relative to puts.

As implied volatility compresses, put holders face increasing theta decay and mark-to-market pressure. With downside momentum weakening, these positions become more costly to carry, prompting traders to buy back their hedges. This dynamic can create incremental spot demand as protective positions are unwound.

This environment has incentivized traders to position for a tactical upside move, a shift that is visible in the Put/Call volume ratio. Since February 28th, the ratio has moved from 1.89 to 0.4, marking a significant reversal in options flows and highlighting the growing willingness of the market to position for upside.

This shift is also reflected in the increasing interest around the $75,000 strike.

The combination of declining volatility and rising call activity suggests a market gradually transitioning away from defensive hedging toward more opportunistic upside positioning.
Live Chart

$75K Emerges as the Key Gamma Magnet

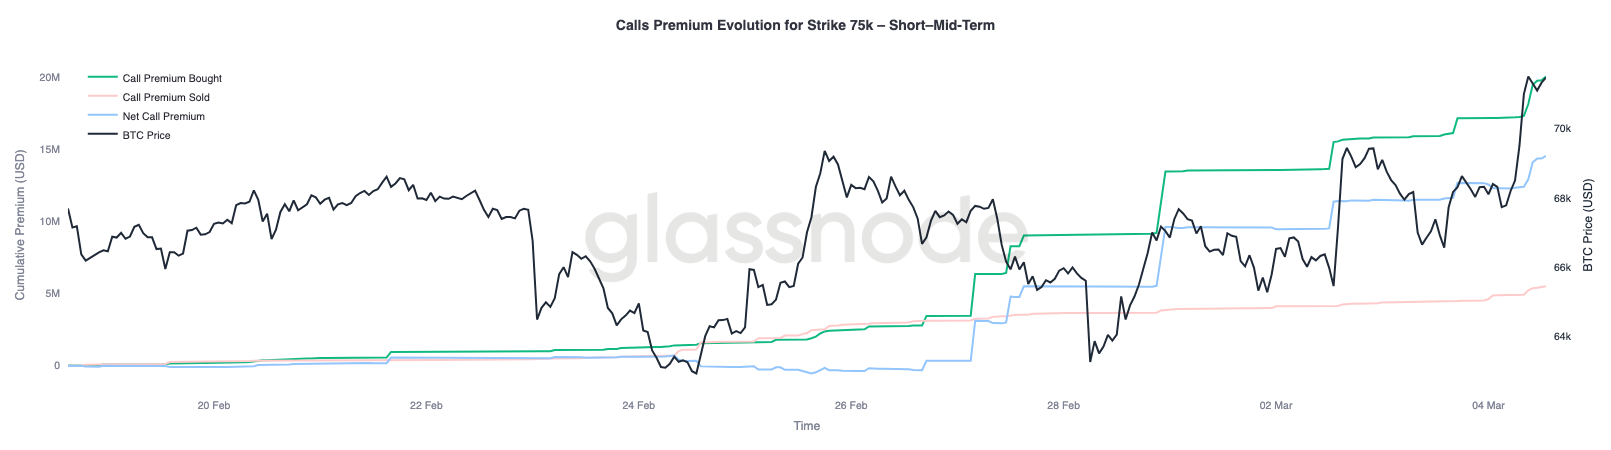
The rotation toward call activity is also visible in the growing interest around the $75,000 strike, which has become the most significant negative gamma level for dealers.

The $75,000 strike currently hosts a substantial concentration of negative gamma, estimated at around $2.3 billion across expiries, with approximately $1.8 billion concentrated in the March 27th expiry.

Negative gamma environments can amplify price movements as dealer hedging flows reinforce the prevailing trend. When price approaches these zones, hedging activity can pull the market toward the strike, creating a magnet effect. Over the past week, this magnet has effectively shifted from the $60K to $65K area up toward the $75K strike.

For now, $75K stands out as the key level where positioning and liquidity could converge in the coming sessions.

Looking at the premium dynamics for the $75K calls across the next three monthly expiries, roughly $14.5 million in net call premium has been traded. This represents the difference between premium bought and premium sold.
Notably, nearly two thirds of this net premium has been accumulated over the past week, helping fuel the current rebound.
Live Chart

Conclusion

Bitcoin remains locked in a tenuous consolidation below the $70k threshold, with several indicators suggesting that buy-side momentum has materially weakened. Realized profit has contracted sharply, highlighting reduced willingness among market participants to transact at elevated prices, while the decline in the Percent Supply in Profit places the current regime within a historical context often associated with the early stages of bear market conditions. At the same time, the cost basis of short-term holders near $70k is emerging as a key behavioural ceiling, likely acting as a distribution zone should price attempt a near-term recovery.

Beneath the surface, however, some signs of stabilization are beginning to appear. Spot selling pressure is moderating at the margin, ETF outflows are easing with early inflows returning, and derivatives leverage continues to be flushed from the system. In options markets, volatility and skew are normalizing as panic hedging fades and positioning rotates toward upside exposure. With the $75k strike emerging as a major gamma magnet, the market appears to be transitioning from stress-driven selling toward a more balanced positioning regime. Whether this evolves into a sustainable recovery will ultimately depend on the return of stronger spot demand to absorb overhead supply.


Disclaimer: This report does not provide any investment advice. All data is provided for informational and educational purposes only. No investment decision shall be based on the information provided here, and you are solely responsible for your own investment decisions.

Exchange balances presented are derived from Glassnode’s comprehensive database of address labels, which are amassed through both officially published exchange information and proprietary clustering algorithms. While we strive to ensure the utmost accuracy in representing exchange balances, it is important to note that these figures might not always encapsulate the entirety of an exchange’s reserves, particularly when exchanges refrain from disclosing their official addresses. We urge users to exercise caution and discretion when utilizing these metrics. Glassnode shall not be held responsible for any discrepancies or potential inaccuracies.


Crypto di tendenza

Domande pertinenti

QWhat key resistance level has Bitcoin repeatedly failed to close above since early February, and what does this indicate about current market momentum?

ABitcoin has repeatedly failed to post a weekly close above $70k since early February, establishing it as a significant near-term resistance level. This, combined with a sharp 63% contraction in the 30-day SMA of Realized Profit, indicates that upside momentum has stalled, leaving the price in a state of directionless consolidation.

QAccording to the 'Percent of Supply in Profit' metric, what does the current reading of approximately 57% historically suggest about the market regime?

AThe 'Percent of Supply in Profit' metric breaking below its -1 standard deviation threshold near 60% and sitting at approximately 57% suggests that the present consolidation may be less a springboard for recovery and more a continuation of the prevailing adverse market regime. Historically, readings at this level have coincided with the early stages of deep bear markets, such as in May 2022 and November 2018.

QWhat is the significance of the Short-Term Holder (1W-1M) Cost Basis being near $70k, and what zone does it create?

AThe cost basis of Short-Term Holders (coins aged between one week and one month) near $70k is significant because it acts as a key behavioral anchor. The ±2% zone surrounding this level (roughly $68.5k to $71.5k) represents a major potential resistance and distribution zone for any near-term price recovery, as these recent buyers are incentivized to exit their positions or lock in thin profits as they approach breakeven.

QWhat recent shifts in ETF flows and options market activity suggest a potential stabilization or change in sentiment?

ARecent shifts include ETF outflows easing with the first signs of renewed inflows appearing, suggesting institutional selling pressure may be moderating. In options markets, the Put/Call volume ratio has dramatically reversed from 1.89 to 0.4, indicating a significant rotation from defensive put buying to opportunistic call buying, and the $75k strike has emerged as a key gamma magnet, reflecting growing upside positioning.

QHow has implied volatility and skew changed, and what does this signal about the current market phase?

AImplied volatility has compressed materially, indicating traders are no longer aggressively pricing tail risk and that the market is moving away from crisis pricing. Skew has normalized from extreme put-heavy levels (mid-20s) to the low-10s, reflecting a fading immediate need for downside hedging. This compression suggests the market is transitioning from a stress phase into a more balanced consolidation phase where positioning, rather than panic, drives price action.

Letture associate

STAR 50 Soars 10.73%, Why Did A-Shares Stage a "V-Shaped Reversal"?

After a prolonged decline, the Chinese A-share market staged a strong rally on July 21. The STAR 50 index surged 10.73%, its largest single-day gain in nearly a year, leading a broad-based "V-shaped" reversal. The Shanghai Composite Index rose 1.79%, the Shenzhen Component Index gained 4.81%, and the ChiNext Index jumped 7.05%. Total market turnover reached 2.97 trillion yuan, an increase of 256.1 billion yuan from the previous session, with over 3,100 stocks advancing. The semiconductor sector spearheaded the rebound, with related ETFs posting significant gains. Analysts attribute the surge to three converging factors. First, coordinated capital inflows from "national team" institutions, insurance funds, listed company buybacks, and fund house self-purchases have bolstered market liquidity and confidence. Second, supportive policy signals, including commitments from regulators to ensure stable market operations, provided a favorable backdrop. Third, a stabilization and recovery in overseas markets, notably South Korea, created a positive external environment. Institutions suggest the most severe panic selling phase for the tech sector has likely passed, following a significant digestion of crowded positions and leveraged funds. While short-term volatility may persist, the medium to long-term outlook remains underpinned by enduring trends like AI computing demand expansion and semiconductor localization. The market's focus now shifts to the sustainability of supportive fund flows, earnings reports, and upcoming catalysts from the global AI industry chain.

marsbit3 min fa

STAR 50 Soars 10.73%, Why Did A-Shares Stage a "V-Shaped Reversal"?

marsbit3 min fa

U.S. Tech Momentum Stocks Post Largest Single-Day Gain Ever, But Is the Plunge Over?

US tech momentum stocks staged a sharp rebound on Tuesday (July 21st). Morgan Stanley's TMT Momentum Factor surged over 12%, marking its largest single-day gain on record, exceeding even peaks from the 2000 dot-com bubble. Key momentum indices from Goldman Sachs also posted their strongest daily performances in years. The rally was led by semiconductors, with the Philadelphia Semiconductor Index jumping 4.6%. This rebound followed three consecutive down days and a cumulative 33% plunge in momentum stocks, one of the steepest drawdowns since the dot-com era. Analysts attribute the surge largely to a short squeeze. Heavy selling had pushed high-beta momentum stocks into deeply oversold territory, forcing many short sellers, particularly in Asia, to cover their positions, creating a self-reinforcing buying spiral. However, the rebound's internals appear weak. Trading volume was notably low, and advancing stocks still lagged decliners on the S&P 500, indicating a narrow, concentrated rally rather than broad market participation. Diverging views emerge on the outlook. BTIG warns the bounce has hit key resistance and recommends selling into strength, citing extreme volatility and historical parallels to past market tops. Conversely, Goldman Sachs and UBS believe the momentum unwind is nearing its end, suggesting it may be time to gradually add exposure, as positioning has been significantly reduced. They caution, however, that high volatility warrants a measured approach, potentially using defined-risk strategies. The upcoming earnings season, particularly reports from major tech firms like Alphabet, is seen as a critical test for the rally's sustainability. Simultaneously, bond markets flashed a warning, with yields rising partly due to spiking oil prices. Analysts note that if long-term Treasury yields break decisively higher, it could pose a significant headwind for equities, especially growth stocks.

marsbit10 min fa

U.S. Tech Momentum Stocks Post Largest Single-Day Gain Ever, But Is the Plunge Over?

marsbit10 min fa

U.S. Tech Momentum Stocks Record Largest Single-Day Gain Ever, but Has the Rout Ended?

U.S. tech momentum stocks staged a dramatic rebound on Tuesday, July 21st. Key momentum indices like the Morgan Stanley TMT Momentum Factor and Goldman Sachs' High Beta Momentum Long Index posted historic or near-historic single-day gains, fueled largely by semiconductor stocks. This sharp rally followed a severe three-day sell-off that saw momentum stocks plunge 33%, marking one of the steepest pullbacks since the dot-com bubble. Analysts attribute the bounce primarily to a short squeeze, as forced covering from over-leveraged traders, particularly in Asia, created a buying spiral. However, the rally's health is questioned due to weak market breadth—overall trading volume was low, and decliners outnumbered advancers in the S&P 500 despite the index's gain—suggesting a narrow, concentrated surge rather than broad recovery. Opinions on the sustainability diverge. BTIG strategists warn the rebound has hit key resistance levels, citing extreme volatility and historic stock dispersion as signs of an ongoing broader correction, and recommend selling into strength. Conversely, Goldman Sachs and UBS view the aggressive momentum unwinding as nearing its end, noting reduced positioning and a lack of new fundamental catalysts. They suggest the sell-off presents a selective opportunity to add exposure, albeit cautiously and gradually using defined-risk strategies. The immediate trajectory hinges on the ongoing earnings season, with market focus on Alphabet's capital expenditure guidance for AI investment clarity. Meanwhile, bond markets present a risk, with rising Treasury yields—potentially heading toward 5.5%—and widening credit spreads for mega-cap tech companies posing a threat to equity valuations. The combination of technical factors, earnings results, and macro conditions leaves the durability of the rebound in doubt.

链捕手12 min fa

U.S. Tech Momentum Stocks Record Largest Single-Day Gain Ever, but Has the Rout Ended?

链捕手12 min fa

Long-Divided Must Unite, Long-United Must Divide: When L1 Becomes Its Own Rollup, What Is Ethereum's Endgame?

"The Inevitable Cycle: When L1 Becomes Its Own Rollup – What is Ethereum's Endgame?" For years, the Ethereum community grappled with concerns that L2s were fragmenting the ecosystem and eroding L1's value. While L2s provided cheaper execution, they also splintered liquidity and the unified user experience of a single chain. This has prompted a fundamental reassessment of the relationship between L1 and L2. Ethereum's roadmap is evolving. The "Scale" initiative merges L1 and L2 expansion into a holistic framework. L1 itself is advancing with higher gas limits, statelessness, and zkEVM verification, no longer content to be just a low-throughput settlement layer. Consequently, the primary value proposition of L2s is shifting from merely providing cheap blockspace to offering L1 cannot easily provide: application-specific optimizations, privacy features, and flexible governance models. L2s are becoming a spectrum of execution environments with varying degrees of security inheritance from Ethereum. A critical challenge in this multi-chain future is interoperability. The vision is to make Ethereum "feel like one chain again." This relies on advancements in native account abstraction (like EIP-7702) and intent-based architectures (Open Intents Framework), where users declare desired outcomes, and solvers handle the complex cross-chain execution. Furthermore, shortening Ethereum's finality time from minutes to seconds is crucial, as it underpins trust between chains for bridges, stablecoins, and cross-chain applications. Perhaps the most provocative idea is that Ethereum L1 itself could become a form of "its own Rollup." As zkEVM and proof systems mature, high-performance nodes could execute transactions and generate validity proofs. Regular validators would then verify these proofs instead of re-executing all transactions. This blurs the traditional L1/L2 hierarchy, making "Rollup" more of a general execution-verification architecture. Native Rollup aims to integrate L2 validation more directly into the Ethereum protocol, allowing L2s to inherit L1's security more fully and move away from reliance on security councils. In the end, L2s are not destined to replace L1 or be made obsolete by it. The likely future is a unified system where diverse execution environments—each optimized for specific use cases like DeFi, gaming, or privacy—coexist. They will share a common foundation of security, liquidity, and verifiable state, seamlessly connected to restore a cohesive user experience. The next phase for Ethereum is not just about scaling through separation, but about intelligently reintegrating what was separated back into a coherent whole.

链捕手29 min fa

Long-Divided Must Unite, Long-United Must Divide: When L1 Becomes Its Own Rollup, What Is Ethereum's Endgame?

链捕手29 min fa

Trading

Spot

Articoli Popolari

Cosa è BITCOIN

Comprendere HarryPotterObamaSonic10Inu (ERC-20) e la sua posizione nel mondo delle criptovalute Negli ultimi anni, il mercato delle criptovalute ha assistito a un aumento della popolarità delle meme coin, catturando l'interesse non solo dei trader, ma anche di coloro che cercano coinvolgimento comunitario e valore di intrattenimento. Tra questi token unici c'è HarryPotterObamaSonic10Inu (ERC-20), un progetto intrigante che mescola riferimenti culturali nel tessuto delle criptovalute. Questo articolo esplora gli aspetti chiave di HarryPotterObamaSonic10Inu, analizzando i suoi meccanismi, l'etica guidata dalla comunità e il suo coinvolgimento con il panorama crittografico più ampio. Che cos'è HarryPotterObamaSonic10Inu (ERC-20)? Come suggerisce il suo nome, HarryPotterObamaSonic10Inu è una meme coin costruita sulla blockchain di Ethereum, classificata secondo lo standard ERC-20. A differenza delle criptovalute tradizionali che possono enfatizzare l'utilità pratica o il potenziale investimento, questo token prospera grazie al valore di intrattenimento e alla forza della sua comunità. Il progetto mira a creare un ambiente in cui gli utenti coinvolti possono riunirsi, condividere idee e partecipare ad attività ispirate a diversi fenomeni culturali. Una caratteristica notevole di HarryPotterObamaSonic10Inu è la zero tassa sulle transazioni. Questo elemento allettante tende a incoraggiare il trading e il coinvolgimento della comunità, privo di costi aggiuntivi che possono scoraggiare i trader di piccole dimensioni. L'offerta totale della moneta è fissata a un miliardo di token, un numero che segna la sua intenzione di mantenere una circolazione sostanziale all'interno della comunità. Creatore di HarryPotterObamaSonic10Inu (ERC-20) Le origini di HarryPotterObamaSonic10Inu sono avvolte in un certo mistero; i dettagli sul creatore rimangono sconosciuti. Lo sviluppo di questo token non presenta un team identificabile o un piano esplicito, cosa non rara nel settore delle meme coin. Invece, il progetto è emerso organicamente, con il suo progresso fortemente dipendente dall'entusiasmo e dalla partecipazione della sua comunità. Investitori di HarryPotterObamaSonic10Inu (ERC-20) Per quanto riguarda investimenti esterni e finanziamenti, HarryPotterObamaSonic10Inu rimane ambiguo. Il token non elenca alcuna fondazione di investimento conosciuta o un sostegno organizzativo significativo. Invece, la linfa vitale del progetto è la sua comunità di base, che informa la sua crescita e sostenibilità attraverso azioni collettive e coinvolgimento nello spazio crittografico. Come funziona HarryPotterObamaSonic10Inu (ERC-20)? In quanto meme coin, HarryPotterObamaSonic10Inu opera principalmente al di fuori delle strutture tradizionali che governano spesso il valore degli asset. Ci sono diversi aspetti distintivi che definiscono il funzionamento del progetto: Transazioni senza tasse: Senza costi fiscali sulle transazioni, gli utenti possono comprare e vendere liberamente il token senza preoccuparsi di costi nascosti. Coinvolgimento della comunità: Il progetto prospera sull'interazione della comunità, sfruttando le piattaforme social per creare entusiasmo e facilitare il coinvolgimento. Discussioni, condivisione di contenuti e coinvolgimento sono elementi cruciali che aiutano ad espandere la sua portata e a favorire la lealtà tra i sostenitori. Nessuna utilità pratica: Va notato che HarryPotterObamaSonic10Inu non offre un'utilità concreta all'interno dell'ecosistema finanziario. Piuttosto, è classificato come un token principalmente per attività di intrattenimento e comunitarie. Riferimento culturale: Il token incorpora astutamente elementi della cultura pop per attirare interesse, collegandosi a appassionati di meme e seguaci delle criptovalute. HarryPotterObamaSonic10Inu esemplifica come le meme coin operino in modo diverso rispetto ai progetti di criptovalute più tradizionali, entrando nel mercato come costrutti sociali innovativi piuttosto che come asset utilitari. Cronologia di HarryPotterObamaSonic10Inu (ERC-20) La storia di HarryPotterObamaSonic10Inu è segnata da diversi traguardi notevoli: Creazione: Il token è emerso da un meme virale, catturando l'immaginazione di molti appassionati di criptovalute. Le date di creazione specifiche non sono disponibili, sottolineando la sua crescita organica. Inserimento negli scambi: HarryPotterObamaSonic10Inu ha fatto il suo ingresso in vari scambi, consentendo un accesso e un trading più facili da parte della comunità. Iniziative di coinvolgimento della comunità: Attività in corso volte a migliorare l'interazione della comunità, comprese gare, campagne sui social media e generazione di contenuti da parte di fan e sostenitori. Piani di espansione futura: La tabella di marcia del progetto include il lancio di una collezione NFT, merchandising e un sito di eCommerce relativo ai suoi temi culturali, coinvolgendo ulteriormente la comunità e cercando di aggiungere più dimensioni al suo ecosistema. Punti chiave su HarryPotterObamaSonic10Inu (ERC-20) Natura guidata dalla comunità: Il progetto dà priorità al contributo collettivo e alla creatività, garantendo che il coinvolgimento degli utenti sia al centro del suo sviluppo. Classificazione come meme coin: Rappresenta l'epitome delle criptovalute basate sull'intrattenimento, distinguendosi dai veicoli d'investimento tradizionali. Nessuna affiliazione diretta con Bitcoin: Nonostante la somiglianza nel nome del ticker, HarryPotterObamaSonic10Inu è distintivo e non ha alcuna relazione con Bitcoin o altre criptovalute consolidate. Focus sulla collaborazione: HarryPotterObamaSonic10Inu è progettato per creare uno spazio per la collaborazione e la condivisione di storie tra i suoi detentori, fornendo un canale per la creatività e il legame comunitario. Prospettive future: L'ambizione di espandersi oltre il suo presupposto iniziale verso NFT e merchandising delinea un percorso per il progetto per potenzialmente entrare in strade più mainstream all'interno della cultura digitale. Poiché le meme coin continuano a catturare l'immaginazione della comunità crittografica, HarryPotterObamaSonic10Inu (ERC-20) si distingue per i suoi legami culturali e il suo approccio centrato sulla comunità. Anche se potrebbe non adattarsi al modello tipico di un token orientato all'utilità, la sua essenza risiede nella gioia e nella camaraderia coltivate tra i suoi sostenitori, evidenziando la natura in evoluzione delle criptovalute in un'epoca sempre più digitale. Con la continuazione dello sviluppo del progetto, sarà importante osservare come le dinamiche della comunità influenzano la sua traiettoria nel panorama in continuo cambiamento della tecnologia blockchain.

1.8k Totale visualizzazioniPubblicato il 2024.04.01Aggiornato il 2024.12.03

Cosa è BITCOIN

Come comprare BTC

Benvenuto in HTX.com! Abbiamo reso l'acquisto di Bitcoin (BTC) semplice e conveniente. Segui la nostra guida passo passo per intraprendere il tuo viaggio nel mondo delle criptovalute.Step 1: Crea il tuo Account HTXUsa la tua email o numero di telefono per registrarti il tuo account gratuito su HTX. Vivi un'esperienza facile e sblocca tutte le funzionalità,Crea il mio accountStep 2: Vai in Acquista crypto e seleziona il tuo metodo di pagamentoCarta di credito/debito: utilizza la tua Visa o Mastercard per acquistare immediatamente BitcoinBTC.Bilancio: Usa i fondi dal bilancio del tuo account HTX per fare trading senza problemi.Terze parti: abbiamo aggiunto metodi di pagamento molto utilizzati come Google Pay e Apple Pay per maggiore comodità.P2P: Fai trading direttamente con altri utenti HTX.Over-the-Counter (OTC): Offriamo servizi su misura e tassi di cambio competitivi per i trader.Step 3: Conserva Bitcoin (BTC)Dopo aver acquistato Bitcoin (BTC), conserva nel tuo account HTX. In alternativa, puoi inviare tramite trasferimento blockchain o scambiare per altre criptovalute.Step 4: Scambia Bitcoin (BTC)Scambia facilmente Bitcoin (BTC) nel mercato spot di HTX. Accedi al tuo account, seleziona la tua coppia di trading, esegui le tue operazioni e monitora in tempo reale. Offriamo un'esperienza user-friendly sia per chi ha appena iniziato che per i trader più esperti.

4.1k Totale visualizzazioniPubblicato il 2024.12.12Aggiornato il 2026.06.02

Come comprare BTC

Cosa è $BITCOIN

ORO DIGITALE ($BITCOIN): Un'Analisi Completa Introduzione all'ORO DIGITALE ($BITCOIN) L'ORO DIGITALE ($BITCOIN) è un progetto basato su blockchain che opera sulla rete Solana, con l'obiettivo di combinare le caratteristiche dei metalli preziosi tradizionali con l'innovazione delle tecnologie decentralizzate. Sebbene condivida un nome con Bitcoin, spesso definito “oro digitale” a causa della sua percezione come riserva di valore, l'ORO DIGITALE è un token separato progettato per creare un ecosistema unico all'interno del panorama Web3. Il suo obiettivo è posizionarsi come un asset digitale alternativo valido, anche se i dettagli riguardanti le sue applicazioni e funzionalità sono ancora in fase di sviluppo. Cos'è l'ORO DIGITALE ($BITCOIN)? L'ORO DIGITALE ($BITCOIN) è un token di criptovaluta esplicitamente progettato per l'uso sulla blockchain di Solana. A differenza di Bitcoin, che fornisce un ruolo di stoccaggio di valore ampiamente riconosciuto, questo token sembra concentrarsi su applicazioni e caratteristiche più ampie. Aspetti notevoli includono: Infrastruttura Blockchain: Il token è costruito sulla blockchain di Solana, nota per la sua capacità di gestire transazioni ad alta velocità e a basso costo. Dinamiche di Offerta: L'ORO DIGITALE ha un'offerta massima fissata a 100 quadrilioni di token (100P $BITCOIN), sebbene i dettagli riguardanti la sua offerta circolante siano attualmente non divulgati. Utilità: Sebbene le funzionalità precise non siano esplicitamente delineate, ci sono indicazioni che il token potrebbe essere utilizzato per varie applicazioni, potenzialmente coinvolgendo applicazioni decentralizzate (dApp) o strategie di tokenizzazione degli asset. Chi è il Creatore dell'ORO DIGITALE ($BITCOIN)? Attualmente, l'identità dei creatori e del team di sviluppo dietro l'ORO DIGITALE ($BITCOIN) rimane sconosciuta. Questa situazione è tipica tra molti progetti innovativi nel settore blockchain, in particolare quelli allineati con la finanza decentralizzata e i fenomeni delle meme coin. Sebbene tale anonimato possa favorire una cultura guidata dalla comunità, intensifica le preoccupazioni riguardo alla governance e alla responsabilità. Chi sono gli Investitori dell'ORO DIGITALE ($BITCOIN)? Le informazioni disponibili indicano che l'ORO DIGITALE ($BITCOIN) non ha alcun sostenitore istituzionale noto o investimenti di venture capital prominenti. Il progetto sembra operare su un modello peer-to-peer incentrato sul supporto e sull'adozione della comunità piuttosto che su percorsi di finanziamento tradizionali. La sua attività e liquidità si trovano principalmente su exchange decentralizzati (DEX), come PumpSwap, piuttosto che su piattaforme di trading centralizzate consolidate, evidenziando ulteriormente il suo approccio di base. Come Funziona l'ORO DIGITALE ($BITCOIN) Le meccaniche operative dell'ORO DIGITALE ($BITCOIN) possono essere elaborate in base al suo design blockchain e alle caratteristiche della rete: Meccanismo di Consenso: Sfruttando il proof-of-history (PoH) unico di Solana combinato con un modello di proof-of-stake (PoS), il progetto garantisce una validazione efficiente delle transazioni contribuendo all'alta performance della rete. Tokenomics: Sebbene meccanismi deflazionistici specifici non siano stati dettagliati ampiamente, l'ampia offerta massima di token implica che potrebbe soddisfare microtransazioni o casi d'uso di nicchia che devono ancora essere definiti. Interoperabilità: Esiste il potenziale per l'integrazione con l'ecosistema più ampio di Solana, inclusi vari piattaforme di finanza decentralizzata (DeFi). Tuttavia, i dettagli riguardanti integrazioni specifiche rimangono non specificati. Cronologia degli Eventi Chiave Ecco una cronologia che evidenzia traguardi significativi riguardanti l'ORO DIGITALE ($BITCOIN): 2023: Il dispiegamento iniziale del token avviene sulla blockchain di Solana, contrassegnato dal suo indirizzo di contratto. 2024: L'ORO DIGITALE guadagna visibilità poiché diventa disponibile per il trading su exchange decentralizzati come PumpSwap, consentendo agli utenti di scambiarlo contro SOL. 2025: Il progetto assiste a un'attività di trading sporadica e a un potenziale interesse per impegni guidati dalla comunità, sebbene non siano state documentate partnership significative o avanzamenti tecnici fino ad ora. Analisi Critica Punti di Forza Scalabilità: L'infrastruttura sottostante di Solana supporta alti volumi di transazioni, il che potrebbe migliorare l'utilità di $BITCOIN in vari scenari di transazione. Accessibilità: Il potenziale basso prezzo di trading per token potrebbe attrarre investitori al dettaglio, facilitando una partecipazione più ampia grazie a opportunità di proprietà frazionata. Rischi Mancanza di Trasparenza: L'assenza di sostenitori, sviluppatori o di un processo di audit pubblicamente noti potrebbe generare scetticismo riguardo alla sostenibilità e all'affidabilità del progetto. Volatilità del Mercato: L'attività di trading è fortemente dipendente dal comportamento speculativo, il che può comportare una significativa volatilità dei prezzi e incertezze per gli investitori. Conclusione L'ORO DIGITALE ($BITCOIN) emerge come un progetto intrigante ma ambiguo all'interno dell'evolvente ecosistema di Solana. Sebbene tenti di sfruttare la narrativa dell'“oro digitale”, la sua partenza dal ruolo consolidato di Bitcoin come riserva di valore sottolinea la necessità di una chiara differenziazione della sua utilità e struttura di governance. L'accettazione e l'adozione future dipenderanno probabilmente dall'affrontare l'attuale opacità e dalla definizione più esplicita delle sue strategie operative ed economiche. Nota: Questo rapporto comprende informazioni sintetizzate disponibili a ottobre 2023, e potrebbero essersi verificati sviluppi oltre il periodo di ricerca.

154 Totale visualizzazioniPubblicato il 2025.05.13Aggiornato il 2025.05.13

Cosa è $BITCOIN

Discussioni

Benvenuto nella Community HTX. Qui puoi rimanere informato sugli ultimi sviluppi della piattaforma e accedere ad approfondimenti esperti sul mercato. Le opinioni degli utenti sul prezzo di BTC BTC sono presentate come di seguito.

活动图片