STAR 50 Soars 10.73%, Why Did A-Shares Stage a "V-Shaped Reversal"?

marsbitPubblicato 2026-07-22Pubblicato ultima volta 2026-07-22

Introduzione

After a prolonged decline, the Chinese A-share market staged a strong rally on July 21. The STAR 50 index surged 10.73%, its largest single-day gain in nearly a year, leading a broad-based "V-shaped" reversal. The Shanghai Composite Index rose 1.79%, the Shenzhen Component Index gained 4.81%, and the ChiNext Index jumped 7.05%. Total market turnover reached 2.97 trillion yuan, an increase of 256.1 billion yuan from the previous session, with over 3,100 stocks advancing. The semiconductor sector spearheaded the rebound, with related ETFs posting significant gains. Analysts attribute the surge to three converging factors. First, coordinated capital inflows from "national team" institutions, insurance funds, listed company buybacks, and fund house self-purchases have bolstered market liquidity and confidence. Second, supportive policy signals, including commitments from regulators to ensure stable market operations, provided a favorable backdrop. Third, a stabilization and recovery in overseas markets, notably South Korea, created a positive external environment. Institutions suggest the most severe panic selling phase for the tech sector has likely passed, following a significant digestion of crowded positions and leveraged funds. While short-term volatility may persist, the medium to long-term outlook remains underpinned by enduring trends like AI computing demand expansion and semiconductor localization. The market's focus now shifts to the sustainability of supportive fund...

After several consecutive days of declines, the market welcomed a strong rebound.

On the morning of July 21, A-shares staged a "V-shaped reversal," with multiple indices subsequently surging rapidly. At the close, the STAR 50 Index soared 10.73%, marking its highest single-day gain in nearly a year. The three major indices all closed in positive territory, with the Shanghai Composite Index rising 1.79%, the Shenzhen Component Index climbing 4.81%, and the ChiNext Index advancing 7.05%.

The combined trading volume for the three major exchanges was 2.97 trillion yuan, an increase of 256.1 billion yuan from the previous day. At the individual stock level, over 3,100 stocks rose, with more than a hundred hitting their daily upside limit. As the vanguard of the rebound, the semiconductor industry chain saw a full-scale surge, led by sectors such as equipment, memory, wafers, and HBM. Sectors like oil and gas, banking, coal, and motorcycles were among the decliners.

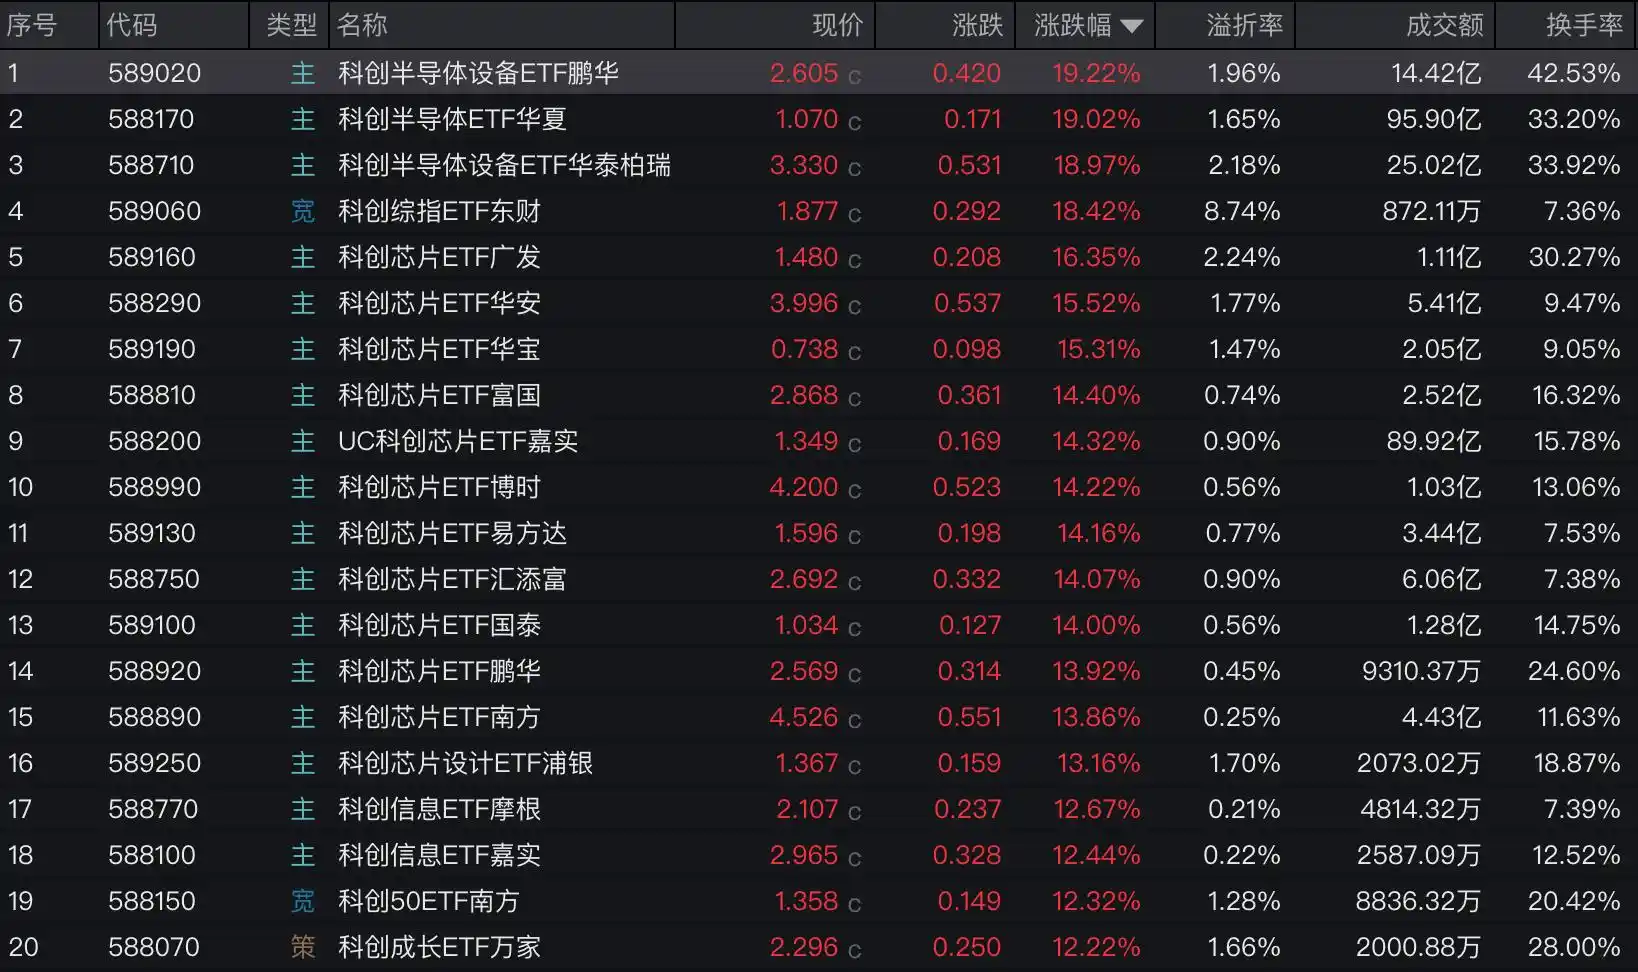
Boosted by the semiconductor rally, related thematic ETFs surged sharply, with as many as 73 products gaining over 10% intraday. Among them, Penghua STAR Semiconductor Equipment ETF, ChinaAMC STAR Semiconductor ETF, Huatai-PineBridge STAR Semiconductor Equipment ETF, and East Money STAR Composite Index ETF all rose over 18%. GF, Huaan, and Huabao's STAR Chip ETFs gained over 15%.
Triple Factors in Resonance

Today's powerful rebound in A-shares stemmed from the resonance of three factors.

First, multiple sources of funds announced market entry. Since July 19th, positive signals have emerged frequently from the capital side, ranging from "national team" and insurance capital increases in holdings to listed company buybacks and self-purchases by public and private funds.

Jinying Fund's analysis notes that the sustained entry of stabilizing funds has effectively boosted market confidence. "During the previous sustained and significant market decline, investors' risk-averse sentiment was concentratedly released, and A-share valuations gradually returned to a reasonable range. Meanwhile, major capital players seized the opportunity to enter the market, not only supporting market liquidity but also laying a solid foundation for market stabilization."

Wind data shows that over the last two trading days, multiple broad-based ETFs experienced significant volume expansion. On July 20th, broad-based ETFs saw a combined net inflow of 59.061 billion yuan. Among them, ChinaAMC STAR 50 ETF, Huatai-PineBridge CSI 300 ETF, and E Fund ChiNext ETF recorded net inflows of 13.7 billion yuan, 12.52 billion yuan, and 9.4 billion yuan, respectively. On July 21st, these three broad-based ETFs remained active, with trading volumes reaching 17.322 billion yuan, 15.266 billion yuan, and 12.895 billion yuan respectively.

Second, policy support. On July 20th, China Securities Regulatory Commission (CSRC) Chairman Wu Qing presided over an investor symposium, clearly stating the commitment to "fully maintain stable market operation." Bosera Fund believes that after the technology sector experienced a full adjustment earlier, releasing valuation pressure, coupled with the resonance of policy and capital factors, triggered today's concentrated rebound in the technology growth sector.

Third, the stabilization and rebound of overseas markets provided a favorable external environment for this round of A-share recovery. Jinying Fund points out that the global equity market previously underwent a rapid deleveraging and relatively full adjustment process, with indices in many regions experiencing deep valuation corrections, establishing an objective basis for stabilization and rebound.

Overseas markets, represented by the Korean stock market, took the lead in initiating a recovery. After falling over 30% from its historical peak, effectively clearing substantial risks, the Korea Composite Index (KOSPI) today saw a reversal from its decline, rebounding sharply by 3.56%, led by core Korean tech giants.

Jinying Fund states that alongside the collective warming of the global technology sector, it provided strong support for the synchronized rebound of A-share technology stocks.

The Most Panicked Stage Is Likely Over

Regarding whether the technology sector has emerged from the gloom, institutions provided analysis from short, medium, and long-term perspectives.

"After the rapid adjustment earlier, the crowdedness of the technology sector has been significantly digested," believes Bosera Fund. After consecutive days of decline in margin financing balances, the deleveraging process is nearing its end. Statements from central SOEs increasing holdings and insurance capital's commitment to add positions have released clear signals of long-term capital entering the market, supporting the valuation floor for the technology sector.

Jinying Fund indicates that the current market is still in the tail end of the deleveraging and sentiment-grinding stage. With the continuous inflow of allocation funds and significant clearance of panic-driven selling, follow-up attention can be paid to relatively good investment opportunities within the short-term oversold rebound.

"In the short term, the positive release of policy signals has to some extent alleviated the market's liquidity shock and panic sentiment. The concentrated deleveraging of margin financing has relatively eased, but the market still needs time to find its bottom. After the index's single-day overshoot, volatility in the technology sector remains high, and follow-up requires lowering market volatility." China Europe Fund suggests focusing on the sustainability of the 'national team' holdings increase, the pace of margin financing and quantitative fund replenishment, and performance verification during the intensive mid-year report disclosure period.

"After this round of oversold rebound, a new medium-term market cycle still awaits new heavyweight industrial catalysts. The Q2 earnings reports from overseas cloud providers in late July are a key node for verifying returns on capital expenditure." Jinying Fund analyzes that, from a medium-term perspective, subsequent differentiation clues within the AI industry chain depend on whether specific segments can maintain their rising share of demand and continued supply bottlenecks. For links where supply bottlenecks may loosen, valuation centers might face downward revisions. AI technology investment still needs to focus on core links with relatively tight supply and demand.

In the view of Bosera Fund, industrial trends such as the expansion of AI computing demand and semiconductor import substitution have not changed due to short-term adjustments. The growth resilience of technology leaders has been preliminarily verified in mid-year report performances. The short-term market may still experience fluctuations, but the most panicked stage for the technology sector is likely over. Subsequently, with the continuous landing of industrial catalysts, the technology growth direction still possesses medium- to long-term allocation value.

This article is from "*Caijing* New Media," author: Jiang Jinli, editor: Jiang Shizhou

Domande pertinenti

QWhy did the A-share market stage a 'V-shaped reversal' on July 21st according to the article?

AThe article states that the strong rebound in the A-share market stemmed from the resonance of three key factors: 1) Multiple sources of funds announcing entry into the market, including the 'national team,' insurance funds, company buybacks, and public and private fund self-purchases. 2) Policy support, highlighted by a speech from the CSRC chairman pledging to 'fully maintain stable market operations.' 3) The stabilization and rebound of overseas markets, such as the South Korean stock market, which provided a favorable external environment for A-shares' recovery.

QWhat was the single-day percentage gain for the STAR 50 Index on July 21st, and what is its significance?

AThe STAR 50 Index surged by 10.73% on July 21st. According to the article, this represents its highest single-day gain in nearly a year.

QWhich sector was the main driving force behind the market rebound, and how did related ETFs perform?

AThe semiconductor industry chain was the main driving force behind the rebound, with equipment, storage, wafers, HBM, and other segments leading the gains. Bolstered by this sector's performance, related thematic ETFs saw sharp increases. The article notes that 73 products saw intraday gains exceeding 10%, with several prominent ETFs, like those tracking STAR Board semiconductor equipment, gaining over 18%.

QWhat are the short- to medium-term outlooks provided by fund managers for the technology sector after this rebound?

AFund managers offered a tiered outlook. In the short term, institutions like Boshi Fund believe the most panic-driven stage for the tech sector has likely passed, though volatility may persist. Jin Ying Fund suggests the market is in the tail-end of deleveraging and sentiment bottoming, presenting opportunities from the short-term oversold bounce. For the medium term, they caution that a sustained new uptrend requires fresh, significant industry catalysts and advise focusing on AI supply chain segments with tight supply-demand dynamics, as others facing looser supply might see valuation corrections.

QHow did the trading volume and breadth of the market change on July 21st compared to the previous day?

AThe combined turnover for the three major exchanges reached 2.97 trillion yuan on July 21st, an increase of 256.1 billion yuan from the previous day. In terms of market breadth, over 3,100 stocks rose, with more than 100 hitting their daily price limit (涨停).

Letture associate

Bitmine's Tom Lee Now Owns 4.8% of Ethereum's Total Supply. Is It Worth Buying ETH Now?

Tom Lee, founder of Fundstrat Global Advisors and a staunch cryptocurrency bull, now serves as chairman of Bitmine. Under his guidance, Bitmine has evolved from a bitcoin miner into the world's largest corporate holder of Ethereum, owning 5.81 million ETH tokens (4.8% of the total supply) as of August 10, with a target of reaching 5%. Lee, who correctly advised buying Bitcoin in 2017, is similarly bullish on Ethereum. He began recommending ETH in late 2024 at around $3,400; despite its current price near $1,900, he predicts it could reach $22,000 in the coming years and $62,000-$250,000 long-term. His optimism stems from Ethereum's role as the leading smart contract blockchain. He expects growth from increased stablecoin issuance, tokenized real-world assets (RWA), and the need for AI agents to use neutral, secure blockchains like Ethereum for identity verification and machine-to-machine payments. With a market cap of $226 billion, Ethereum remains much smaller than Bitcoin's $1.26 trillion, suggesting significant room for growth once macroeconomic headwinds ease. While past success doesn't guarantee future results, and ETH is down nearly 60% over the past year, the article argues Ethereum has clearer long-term catalysts than many altcoins. These include growing dApp usage, AI integration, and the potential for approved spot ETFs to attract more investors. The conclusion suggests that while not buying as aggressively as Bitmine, accumulating the world's second-largest cryptocurrency during market pessimism could be a prudent long-term strategy.

cryptonews.ru8 min fa

Bitmine's Tom Lee Now Owns 4.8% of Ethereum's Total Supply. Is It Worth Buying ETH Now?

cryptonews.ru8 min fa

Consolidation and Jackson Hole: Trader Assesses Bitcoin and Ethereum Movement Scenarios

**Analysis: Bitcoin and Ethereum Consolidation Ahead of Jackson Hole** Bitcoin (BTC) is consolidating near $63,513, with liquidity accumulating around the $62,484 support level. The primary resistance is an unfilled 4-hour Fair Value Gap (FVG) at $64,000-$65,000. Analysts outline three potential scenarios: A) a rejection from the FVG leading to a cascade down to $60,000-$61,000; B) a bullish breakout above the FVG targeting $65,373 and higher; C) (prioritized) a quick stop-loss hunt below $62,484 followed by a rapid reversal upward into the imbalance. Ethereum (ETH) is similarly stagnant, failing to test $2,000 and remaining within its own 4H FVG. Key resistance is at $1,931.50 (PWH). Scenarios include: A) a genuine breakout and hold above this level; B) a deep liquidity grab below $1,852 followed by a powerful reversal; C) a false breakout above resistance leading to a cascading dump towards $1,780-$1,800. Despite ETF inflows, ETH's price lacks momentum. The US Dollar Index (DXY) broke below key support at 99.475, opening a path toward lower FVGs near 99,000. This weakness, if sustained, could support crypto markets. Key triggers this week are FOMC meeting minutes and preliminary PMI data, with positioning ahead of the Jackson Hole symposium being crucial. The overall sentiment is cautiously positive, but the recommended strategy is to stay out of medium-term positions in major assets until a clear directional move occurs, favoring intraday trading on lower timeframes with strict risk control.

cryptonews.ru9 min fa

Consolidation and Jackson Hole: Trader Assesses Bitcoin and Ethereum Movement Scenarios

cryptonews.ru9 min fa

From Speculation to Risk Management: Predictive Markets Are Filling the Gap in Commercial Insurance

From Speculation to Risk Management: Predictive Markets Filling the Commercial Insurance Gap The emergence of AI risk management tools like Blanket is exploring the potential of predictive markets as a genuine insurance tool for businesses. These markets, with their simple contract structure—paying $1 if an event occurs, $0 if not—allow the real-time market price to reflect collective probability assessments. Businesses can use them to hedge against operational risks (e.g., abnormal weather, energy price fluctuations) that are often not covered by traditional business interruption insurance, which typically requires physical damage. A key question is whether these markets are genuinely used for hedging or remain primarily speculative. Analysis of Kalshi markets from August 2025 to August 2026 compared weather contracts (a potential hedge instrument) against sports contracts (largely speculative) and traditional CME grain futures. Three behavioral metrics were examined: 1. **Daily Turnover Rate:** Weather contracts showed the lowest rate (0.210), lower than corn futures (0.266) and significantly lower than sports contracts (0.315), suggesting longer holding periods. 2. **Hold-to-Expiry Ratio:** Weather contracts had a much higher ratio (over 0.5) compared to near-zero ratios for sports contracts, indicating a stronger tendency to hold positions until settlement, consistent with hedging behavior. 3. **Position Buildup Timing:** Weather market positions reached 50% of their peak much earlier in their lifecycle than sports market positions, aligning with the early risk-locking behavior seen in traditional futures hedging markets. The data indicates that the Kalshi weather market exhibits transaction patterns distinct from pure speculation and more aligned with hedging markets, suggesting real hedging demand exists alongside speculative activity. Crucially, speculation provides the essential liquidity and pricing mechanism that enables the hedging function. The future growth of predictive markets as viable risk management infrastructure depends not on eliminating speculation, but on building real enterprise hedging demand atop this existing liquidity base.

marsbit14 min fa

From Speculation to Risk Management: Predictive Markets Are Filling the Gap in Commercial Insurance

marsbit14 min fa

Trading

Spot
活动图片