Original Title: The Bond Market Is Flashing Red, The Next "Phase" Of The Iran War
Original Author: The Kobeissi Letter
Compiled by: Peggy, BlockBeats
Editor's Note: Against the backdrop of escalating geopolitical conflicts, the market's focus is quietly shifting. Initially, discussions centered on oil price shocks and the Middle East situation, but as the war enters a stalemate phase, a more systemic variable is emerging: financial conditions themselves are tightening.
The core argument presented in this article is that what truly dominates the current market is no longer the war itself, but the disorder in the bond market.
Over the past month, the rapid rise in the U.S. 10-year Treasury yield has directly reshaped interest rate expectations, shifting from a "rate cut path" to a "rate hike discussion," and has suppressed stocks, commodities, and even policy space. In this process, the continued weakening of the labor market and the renewed rise in inflation expectations have amplified the Fed's dilemma.
More notably, the author places this round of market volatility within the policy response function: when yields approach the 4.50%–4.70% "policy shift zone," the probability of government intervention rises significantly. Whether it was the historical tariff suspension or recent changes in the pace of "peace talks," these are interpreted as concrete manifestations of bond market pressure influencing policymakers.
This also raises a deeper question: when the bond market begins to dominate asset pricing and policy rhythms, what signals should market participants follow? Geopolitical narratives or marginal changes in the yield curve?
In this round of structural transformation, this article attempts to provide a clear answer—keep an eye on the bond market. Because it not only reflects risks but also determines the boundaries of risk.
Below is the original text:
As peace talks for the Iran war stall, an urgent issue is emerging in the U.S. market: the bond market is "malfunctioning." Amid the bond market's severe turbulence, we believe the probability of "intervention" is rapidly rising. What does this mean? Let's explain below.
Before we begin, we recommend saving this article—it will serve as a reference guide for market movements in the coming weeks.
When the Iran war broke out on February 28 (marked by the U.S. and Israel's assassination of Iran's Supreme Leader Khamenei), oil prices initially rose by less than 15%. The U.S. assessment at the time was that assassinating Khamenei would quickly trigger a regime change in Iran, leading to a relatively swift and less disruptive outcome. But as of now, the Iran war has entered its 27th day, the U.S. proposed "15-point peace plan" has been rejected by Iran, and peace talks have clearly stalled.
It is now uncertain whether any party still clearly desires to end this war. As a result, oil prices remain high, with WTI crude once again approaching $100 per barrel. But this is no longer the biggest problem facing the market. The real issue has shifted to the bond market and its rapid evolution into the largest source of阻力 for the global economy.
Core Issue
In the early stages of the war, oil prices were the market's focus, and they still are. The reason is simple: the oil market most directly and quickly reflects the war's impact.
But now, the bigger problem is the sudden surge in U.S. Treasury yields.
As shown below, over the 27 days since the Iran war began, the U.S. 10-year Treasury yield has risen from about 3.92% to 4.42%, a cumulative increase of 50 basis points. Remember, before the war broke out, the market's focus was on how many rate cuts would occur in 2026.
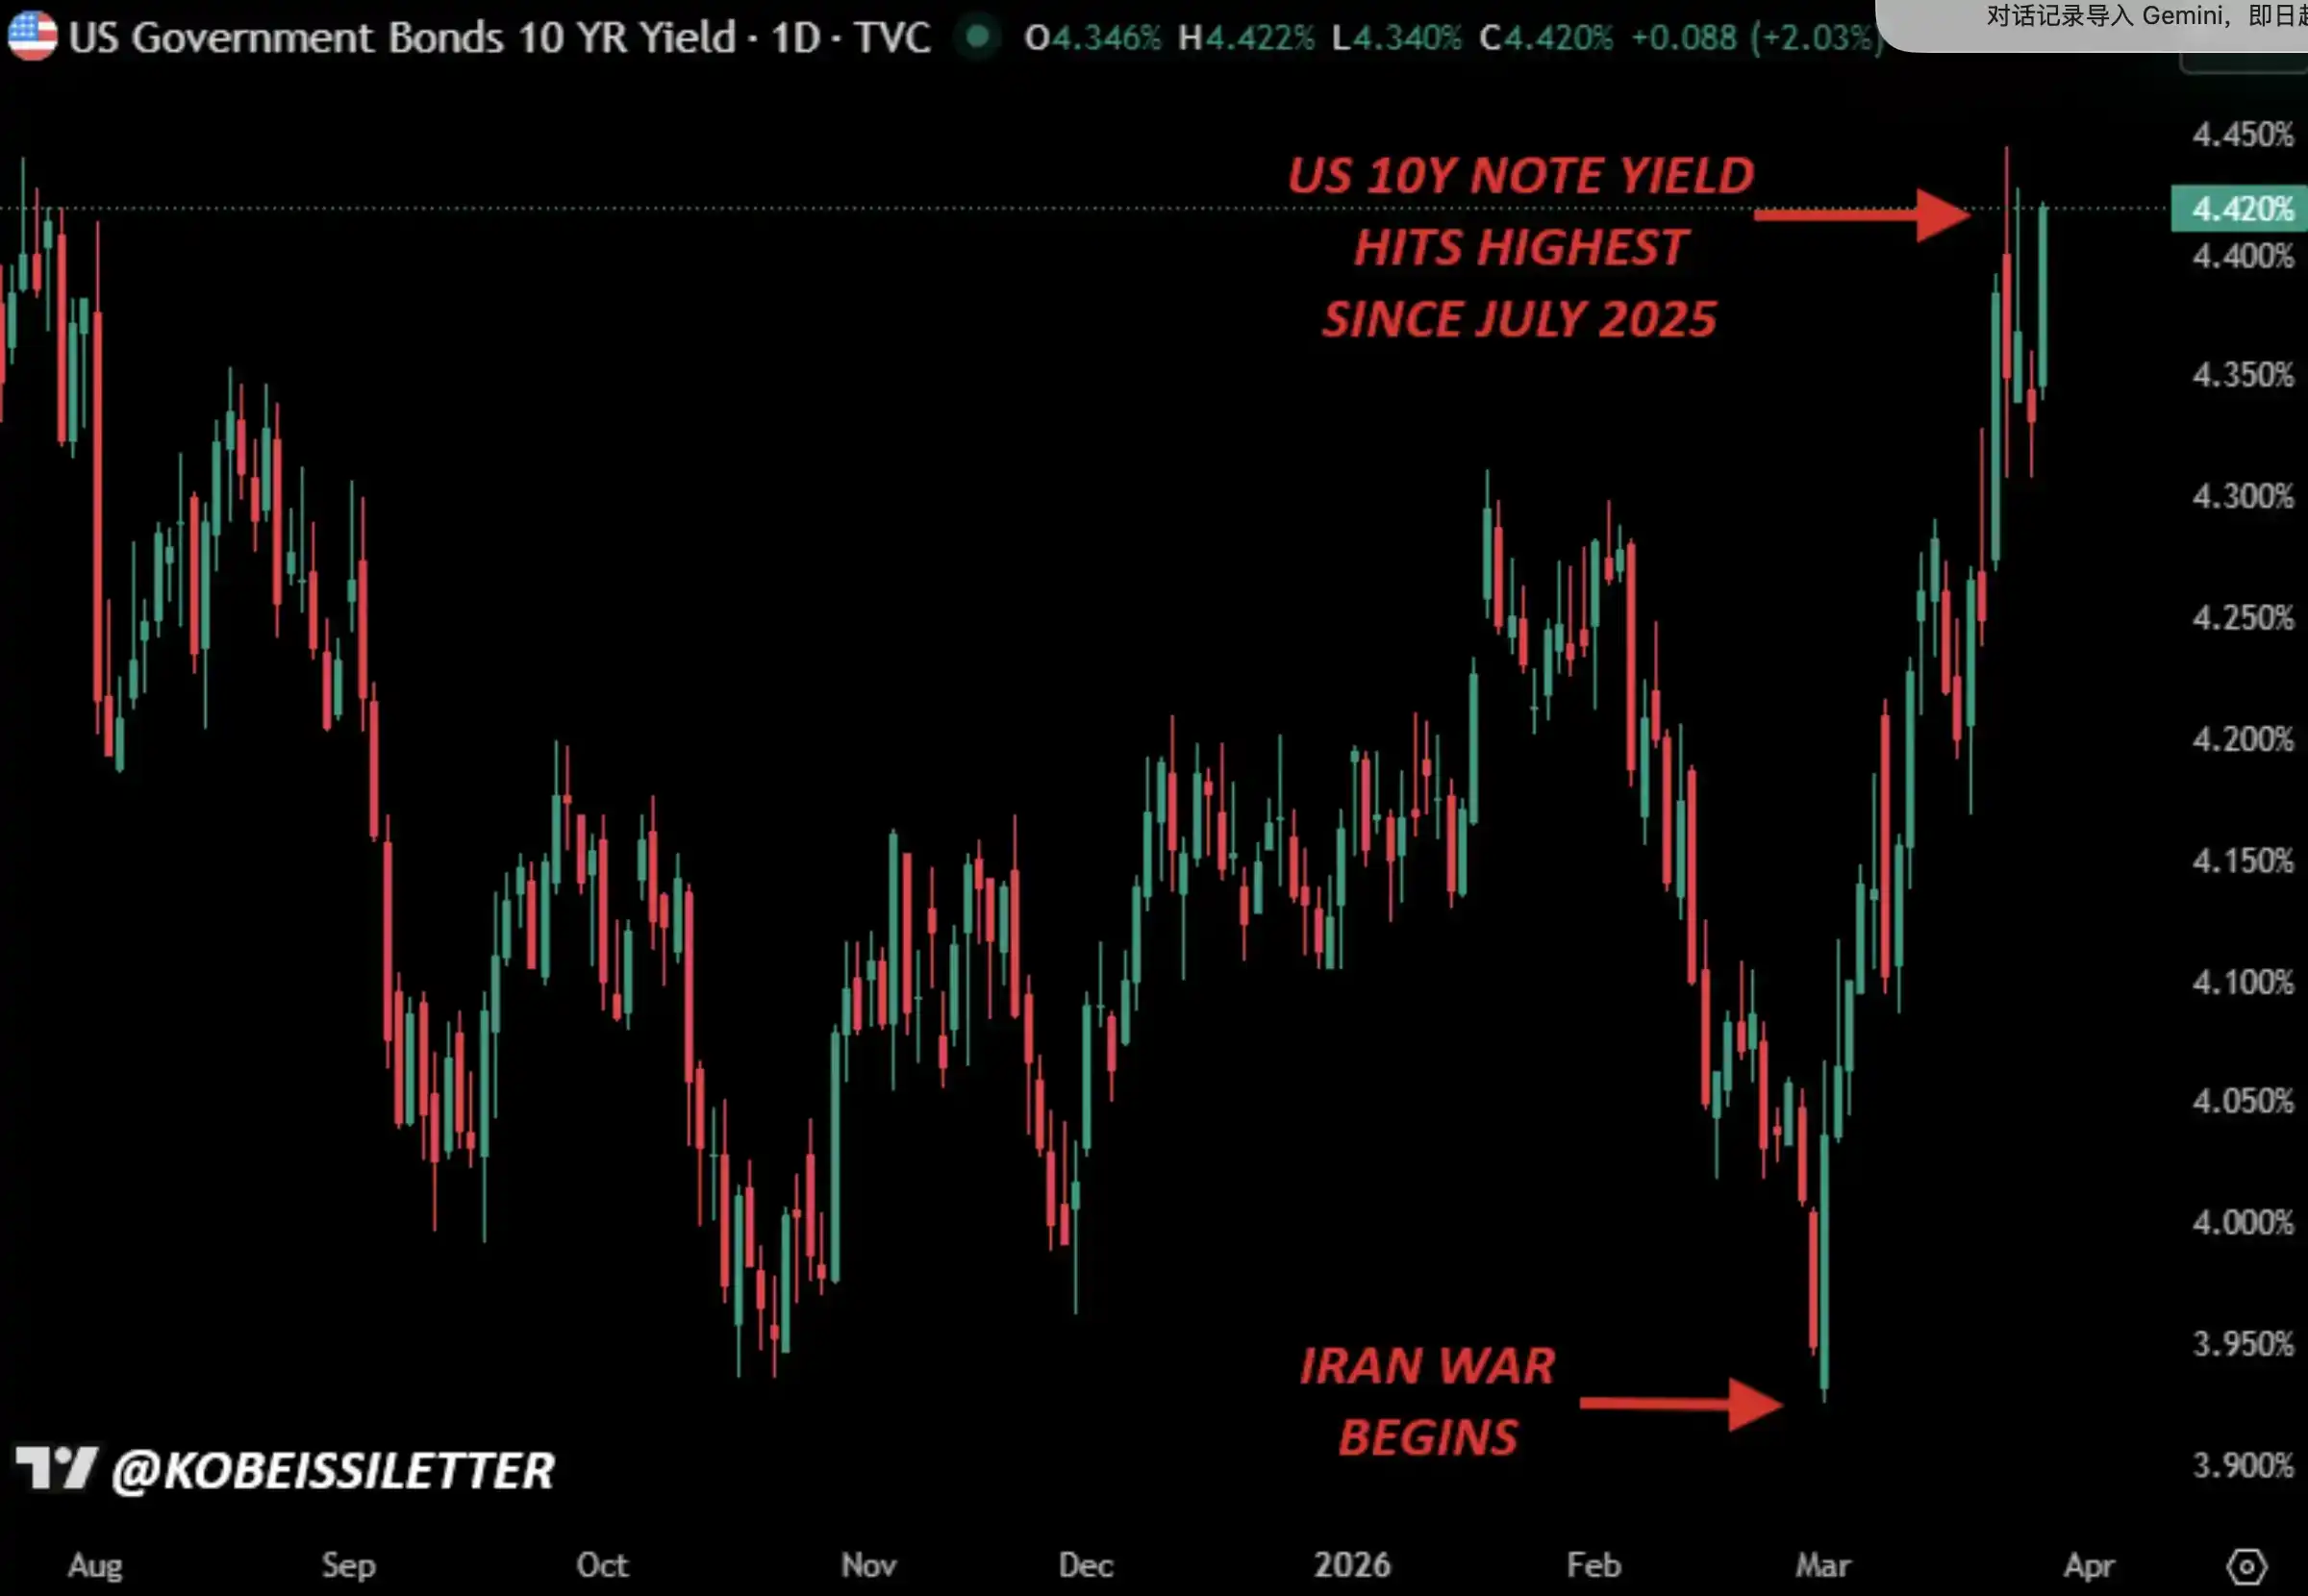
U.S. 10-Year Treasury Yield Since the Iran War Began
The current pace of the rise in the U.S. 10-year Treasury yield, and the broader climb in U.S. bond yields, is roughly equivalent to the performance during the "Liberation Day" period in April 2025.
But the context this time is far more complex, and stabilizing the bond market is not as simple as it seems on the surface. This will soon become the market's core narrative.
From Rate Cut Expectations to Rate Hike Pressure
To better understand the intensity of this shift, recall the market's interest rate expectations at the end of 2025.
As shown below, the market's "base case" at the time was that by 2026, the Fed's federal funds rate would fall to the 2.75% to 3.00% range. There was even a more than 25% probability that rates would fall even lower.
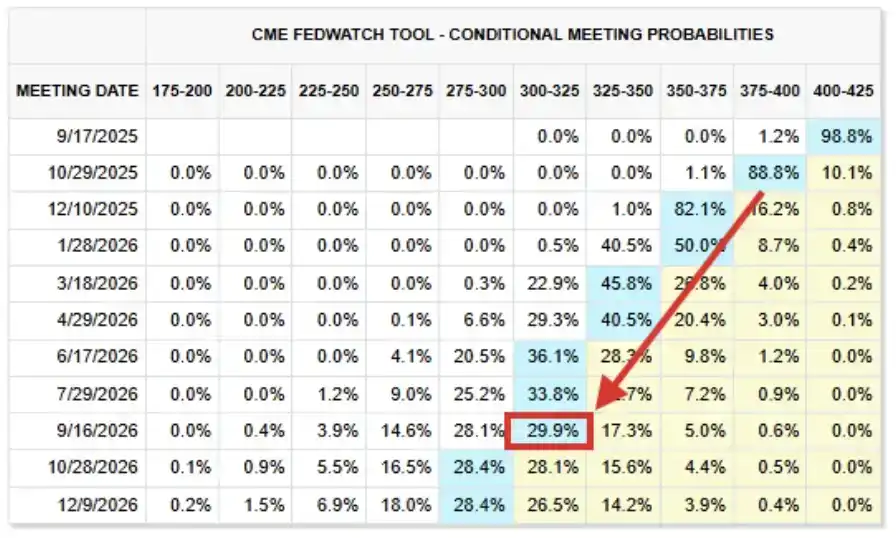
2026 Interest Rate Expectations (Screenshot from September 2025)
Now look at the current pricing in interest rate futures. The current "base case" shows that rates will remain largely unchanged at current levels until September 2027, with the Fed's federal funds rate expected to be in the 3.50% to 3.75% target range.
This level is 75 to 100 basis points higher than expectations a few months ago, and this outlook extends to the end of 2027.
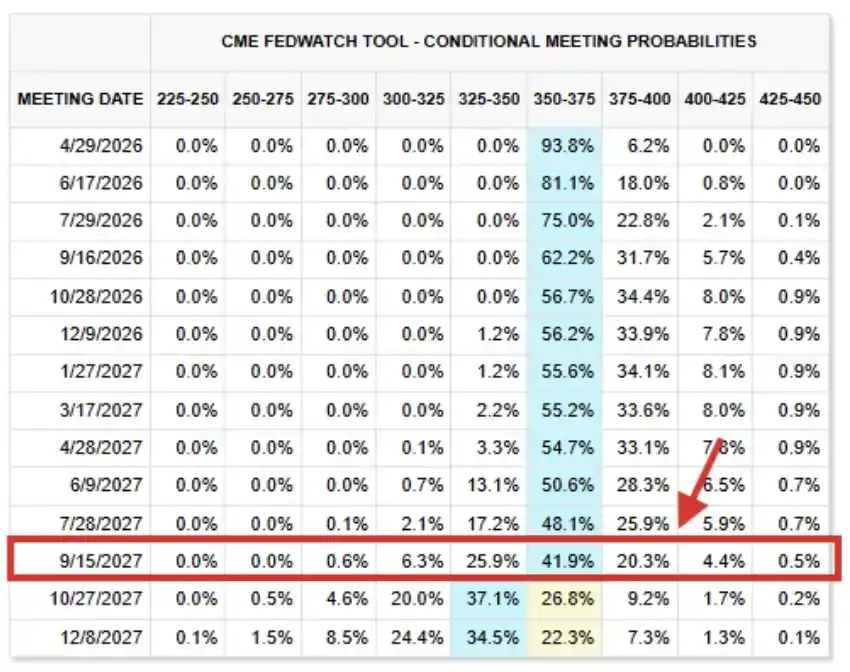
Interest Rate Futures as of March 26, 2026
In fact, the market has once again begun discussing the possibility of "rate hikes": there is currently about a 43% probability that the Fed will raise rates by the end of 2026. Objectively speaking, the market can hardly withstand such a shock.
Next, let's explain why.
The Labor Market Will Only Worsen
On September 17, 2025, the Fed implemented a rate cut as widely expected by the market and hinted at two more cuts before year-end. At the time, although inflation was still significantly above the Fed's long-term 2.00% target, concerns about the U.S. labor market were intensifying.
In the post-meeting statement, the FOMC described economic activity as "having slowed" and added that "job growth has decelerated," while noting that inflation "has risen and remains relatively high." Weak employment and rising inflation actually deviated from both of the Fed's dual mandates of "price stability" and "maximum employment," but the labor market issue was more prominent at the time.
Fast forward to today, the labor market situation has only worsened. Compared to September 2025, the market's ability to withstand higher rates is actually weaker now.
The reality is: first, U.S. employment data for 2025 was revised down significantly by 1.029 million jobs, the largest annual downward revision in at least 20 years. Previously, 2024 and 2023 employment data were revised down by 818,000 and 306,000, respectively.
Cumulatively over the past three years, 2.153 million jobs have been "revised away" from the initially reported data. Since 2019, a total of 2.5 million jobs have been revised away, and in 6 of the past 7 years, employment data has been revised downward.
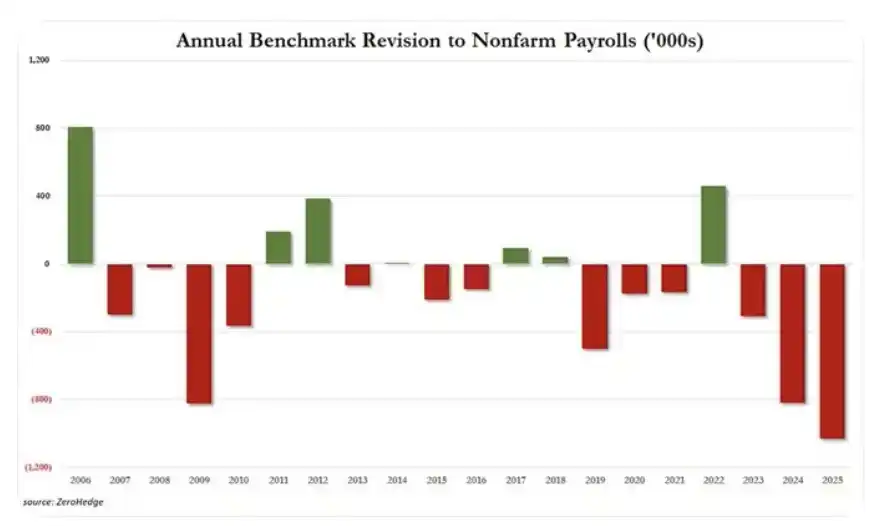
Nonfarm Payroll Annual Revisions
Here's another example; there are many similar cases. The average duration of unemployment in the U.S. rose by 2 weeks in February to 25.7 weeks, a 4-year high. Since October 2023, the duration of unemployment has increased by 6.3 weeks cumulatively, the fastest pace since 2020-2021. This level is now significantly higher than pre-pandemic levels in 2018-2019.
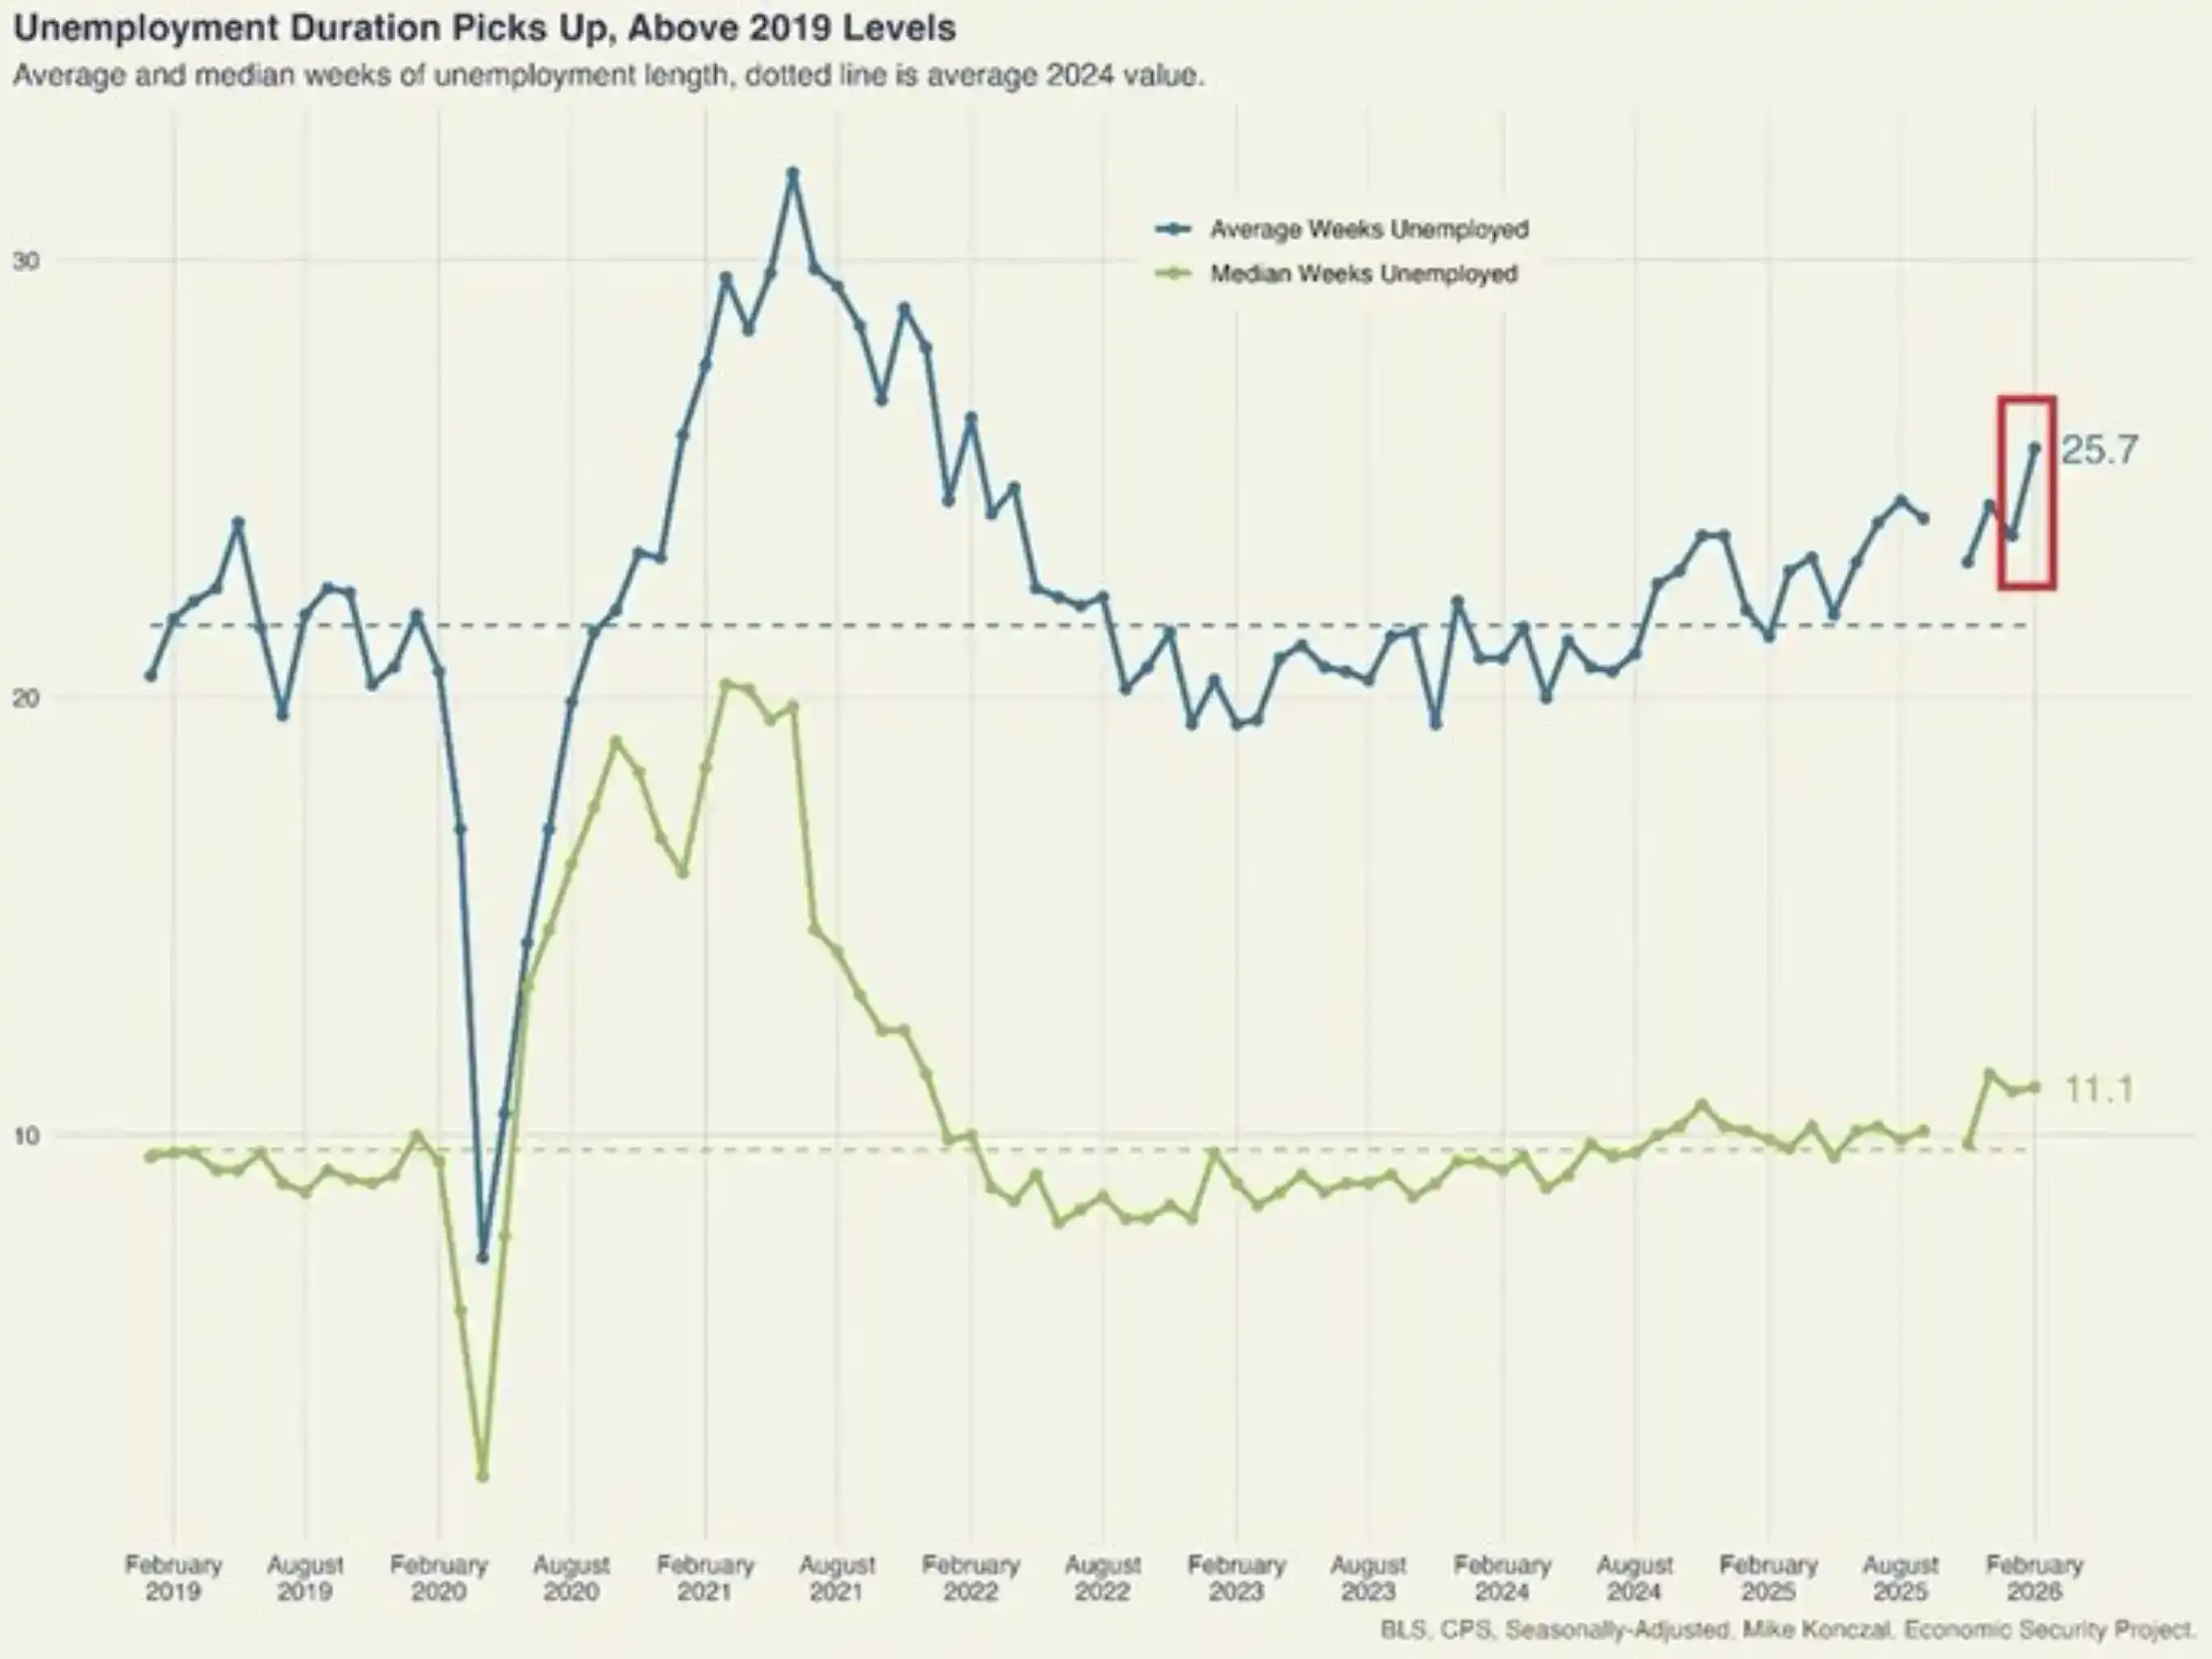
U.S. Duration of Unemployment Soars
Again, these signs are not isolated; we are seeing sustained and intensifying weakness in the labor market.
In our view, the U.S. economy cannot withstand the 10-year Treasury yield approaching 4.50%, let alone rising above 5.00%.
Why Is This Happening?
From a macro perspective, the surge in U.S. Treasury yields and the reversal of rate cut expectations can be attributed to one core variable: inflation.
The Fed's "dual mandate" was established by the U.S. Congress in 1977, requiring the central bank to achieve two main objectives through monetary policy: maximum employment and price stability. As mentioned earlier, when the Fed restarted rate cuts in 2025, the FOMC believed that the weakness in the labor market was a "more important" issue compared to still-elevated inflation.
But with rising energy prices, the ongoing Iran war, and the prolonged post-war energy recovery cycle, inflation has once again become the primary矛盾—not because the labor market has improved, but because inflation itself has become more severe.
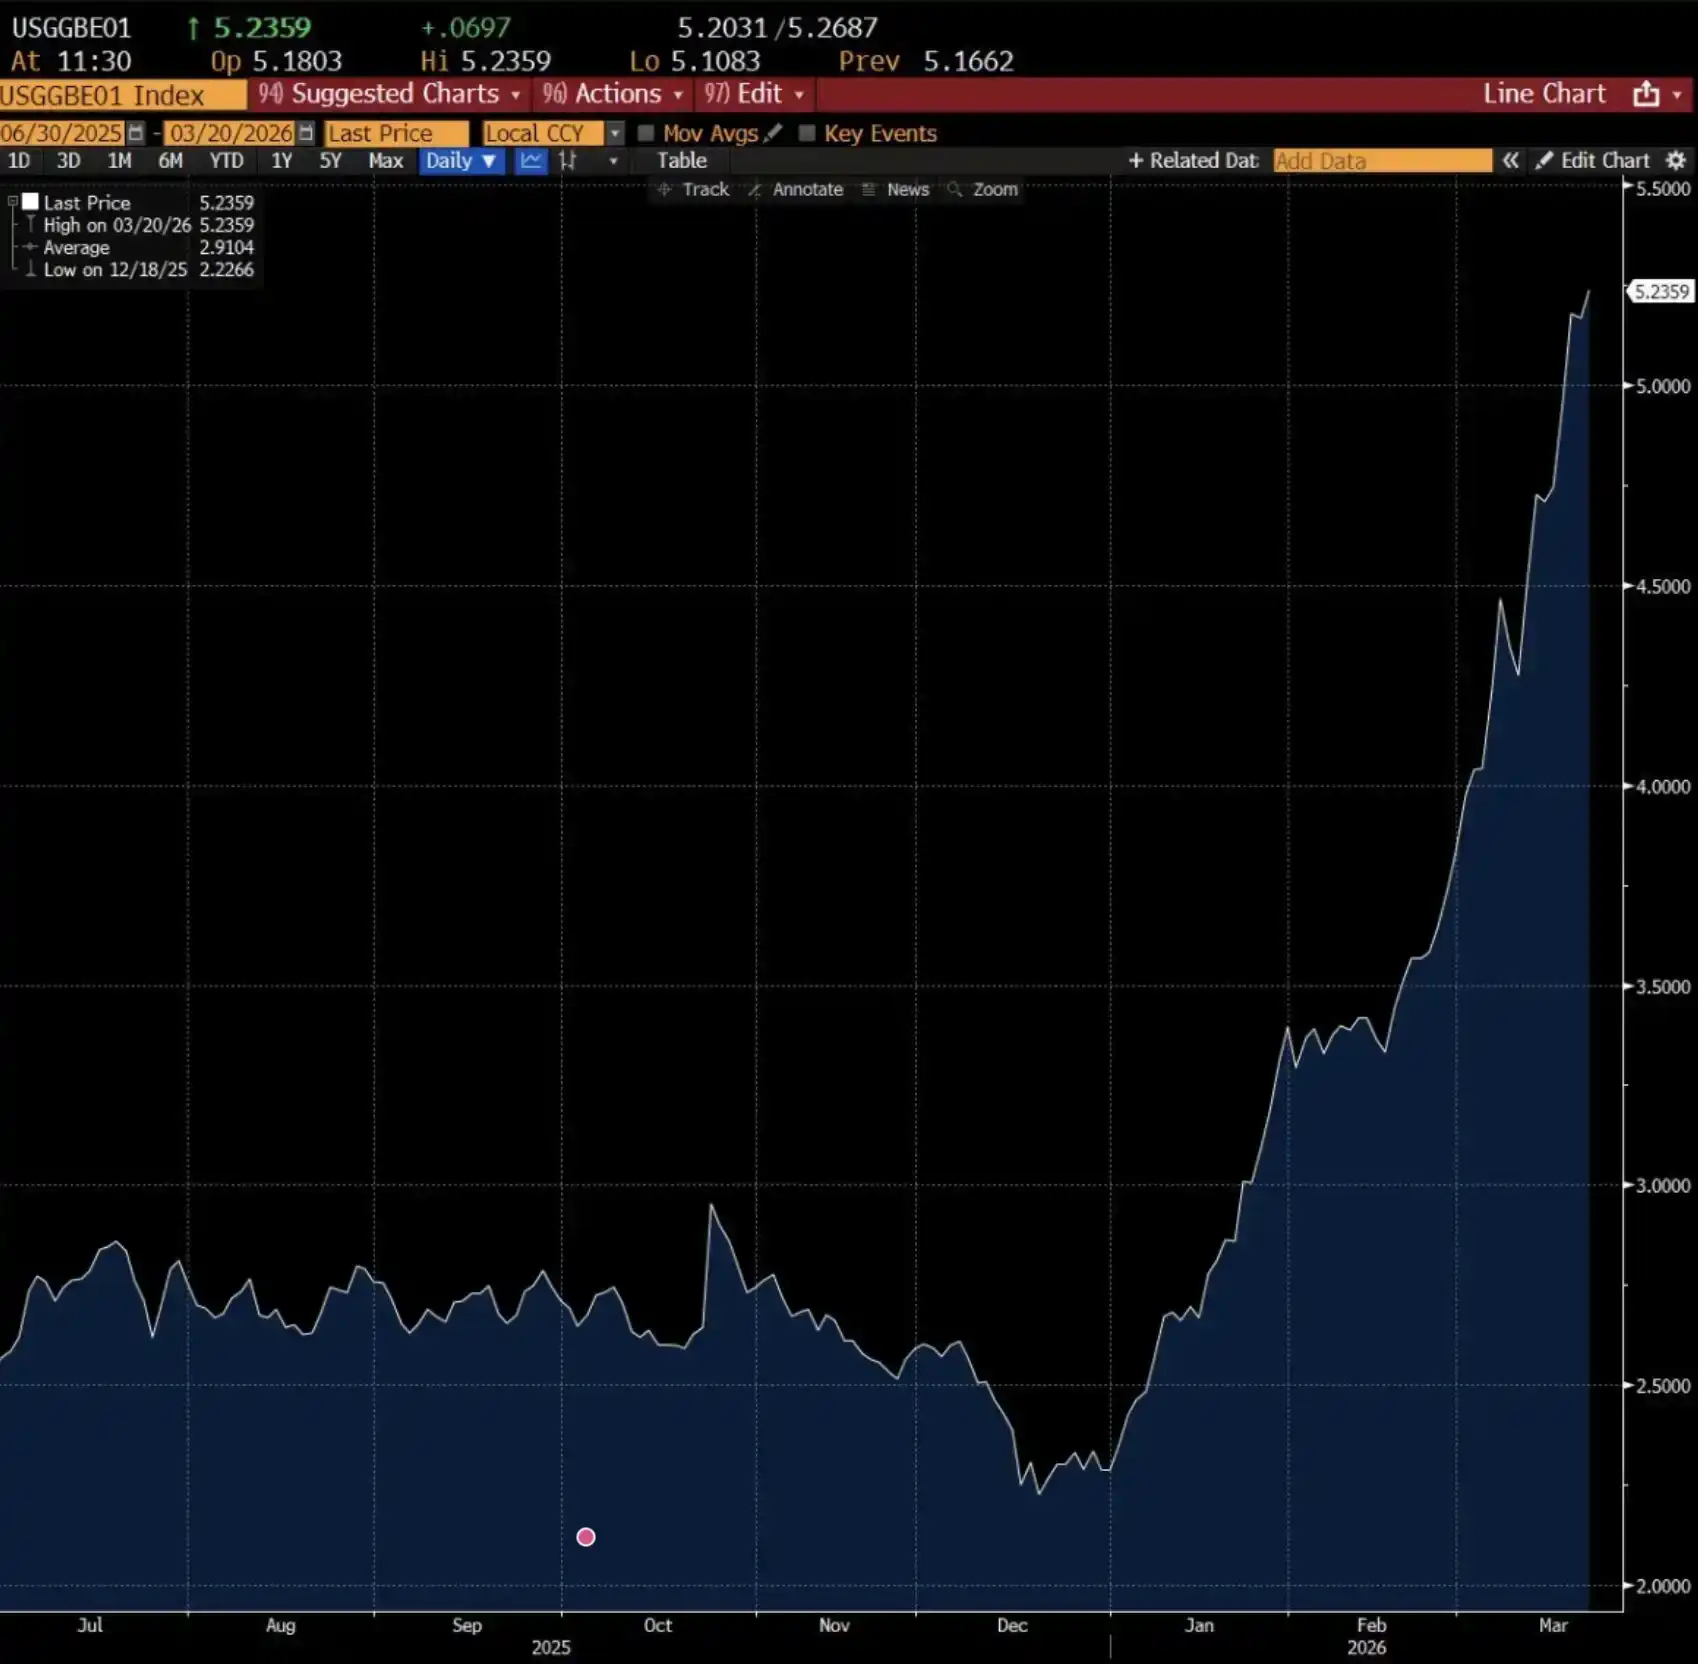
U.S. 12-Month Inflation Expectations
As shown above, U.S. 12-month inflation expectations have surged to 5.2%, the highest level since March 2023. Notably, this expectation reversal began in early January and accelerated rapidly as President Trump threatened Iran, assembled forces in the Middle East, and ultimately launched strikes against Iran on February 28.
This brings us back to the model-based CPI inflation chart below. As we have repeatedly emphasized since the war began, if oil prices average $95 per barrel over three months, U.S. CPI inflation will rise to 3.2%.
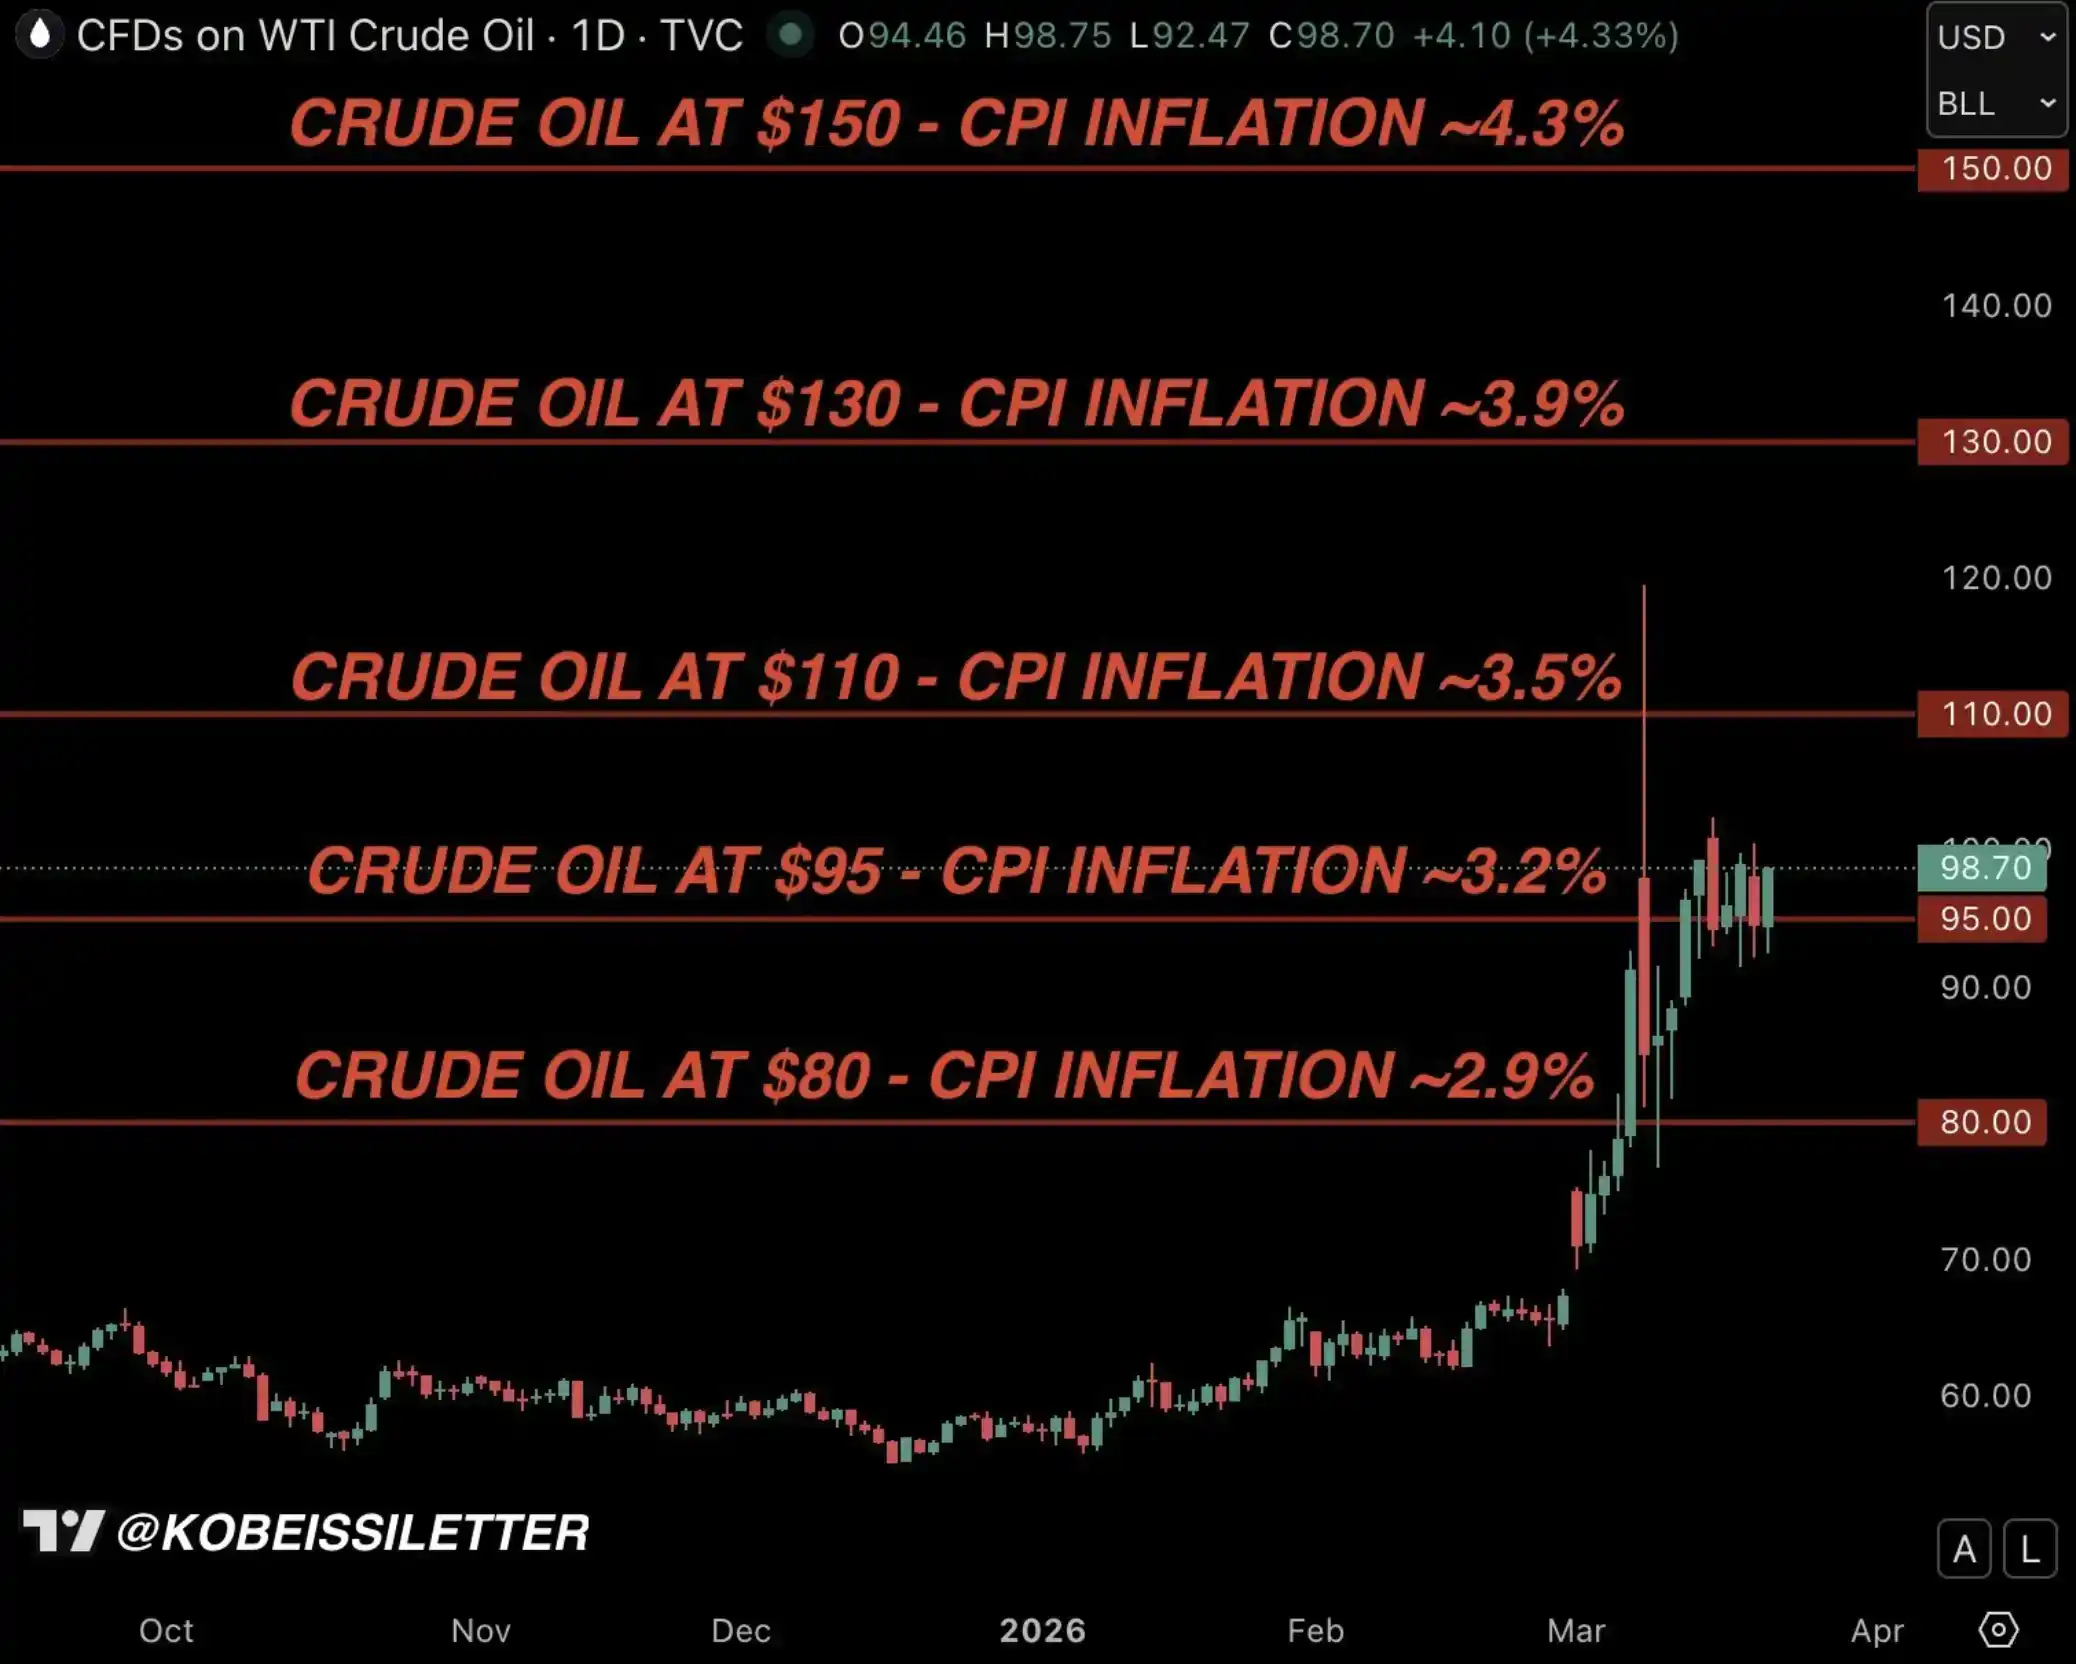
Kobeissi Letter: U.S. Oil Price and Inflation Model
But the reality is, considering the current chain of ripple effects, the rise in inflation is likely to be more than 3.2%.
We Believe "Intervention" Is Imminent
During the severe market volatility triggered by the trade war in early 2025, there was a key factor that ultimately prompted President Trump to announce a 90-day tariff suspension on April 9, 2025—the bond market.
In the chart below, we outline the complete timeline of the U.S. Treasury yield increase during the so-called "Liberation Day" period. It was this round of yield surge that ultimately led to the policy shift on April 9, alleviating market pressure.
And in a live interview on April 10, Trump explicitly stated that he was closely watching the bond market's movements.
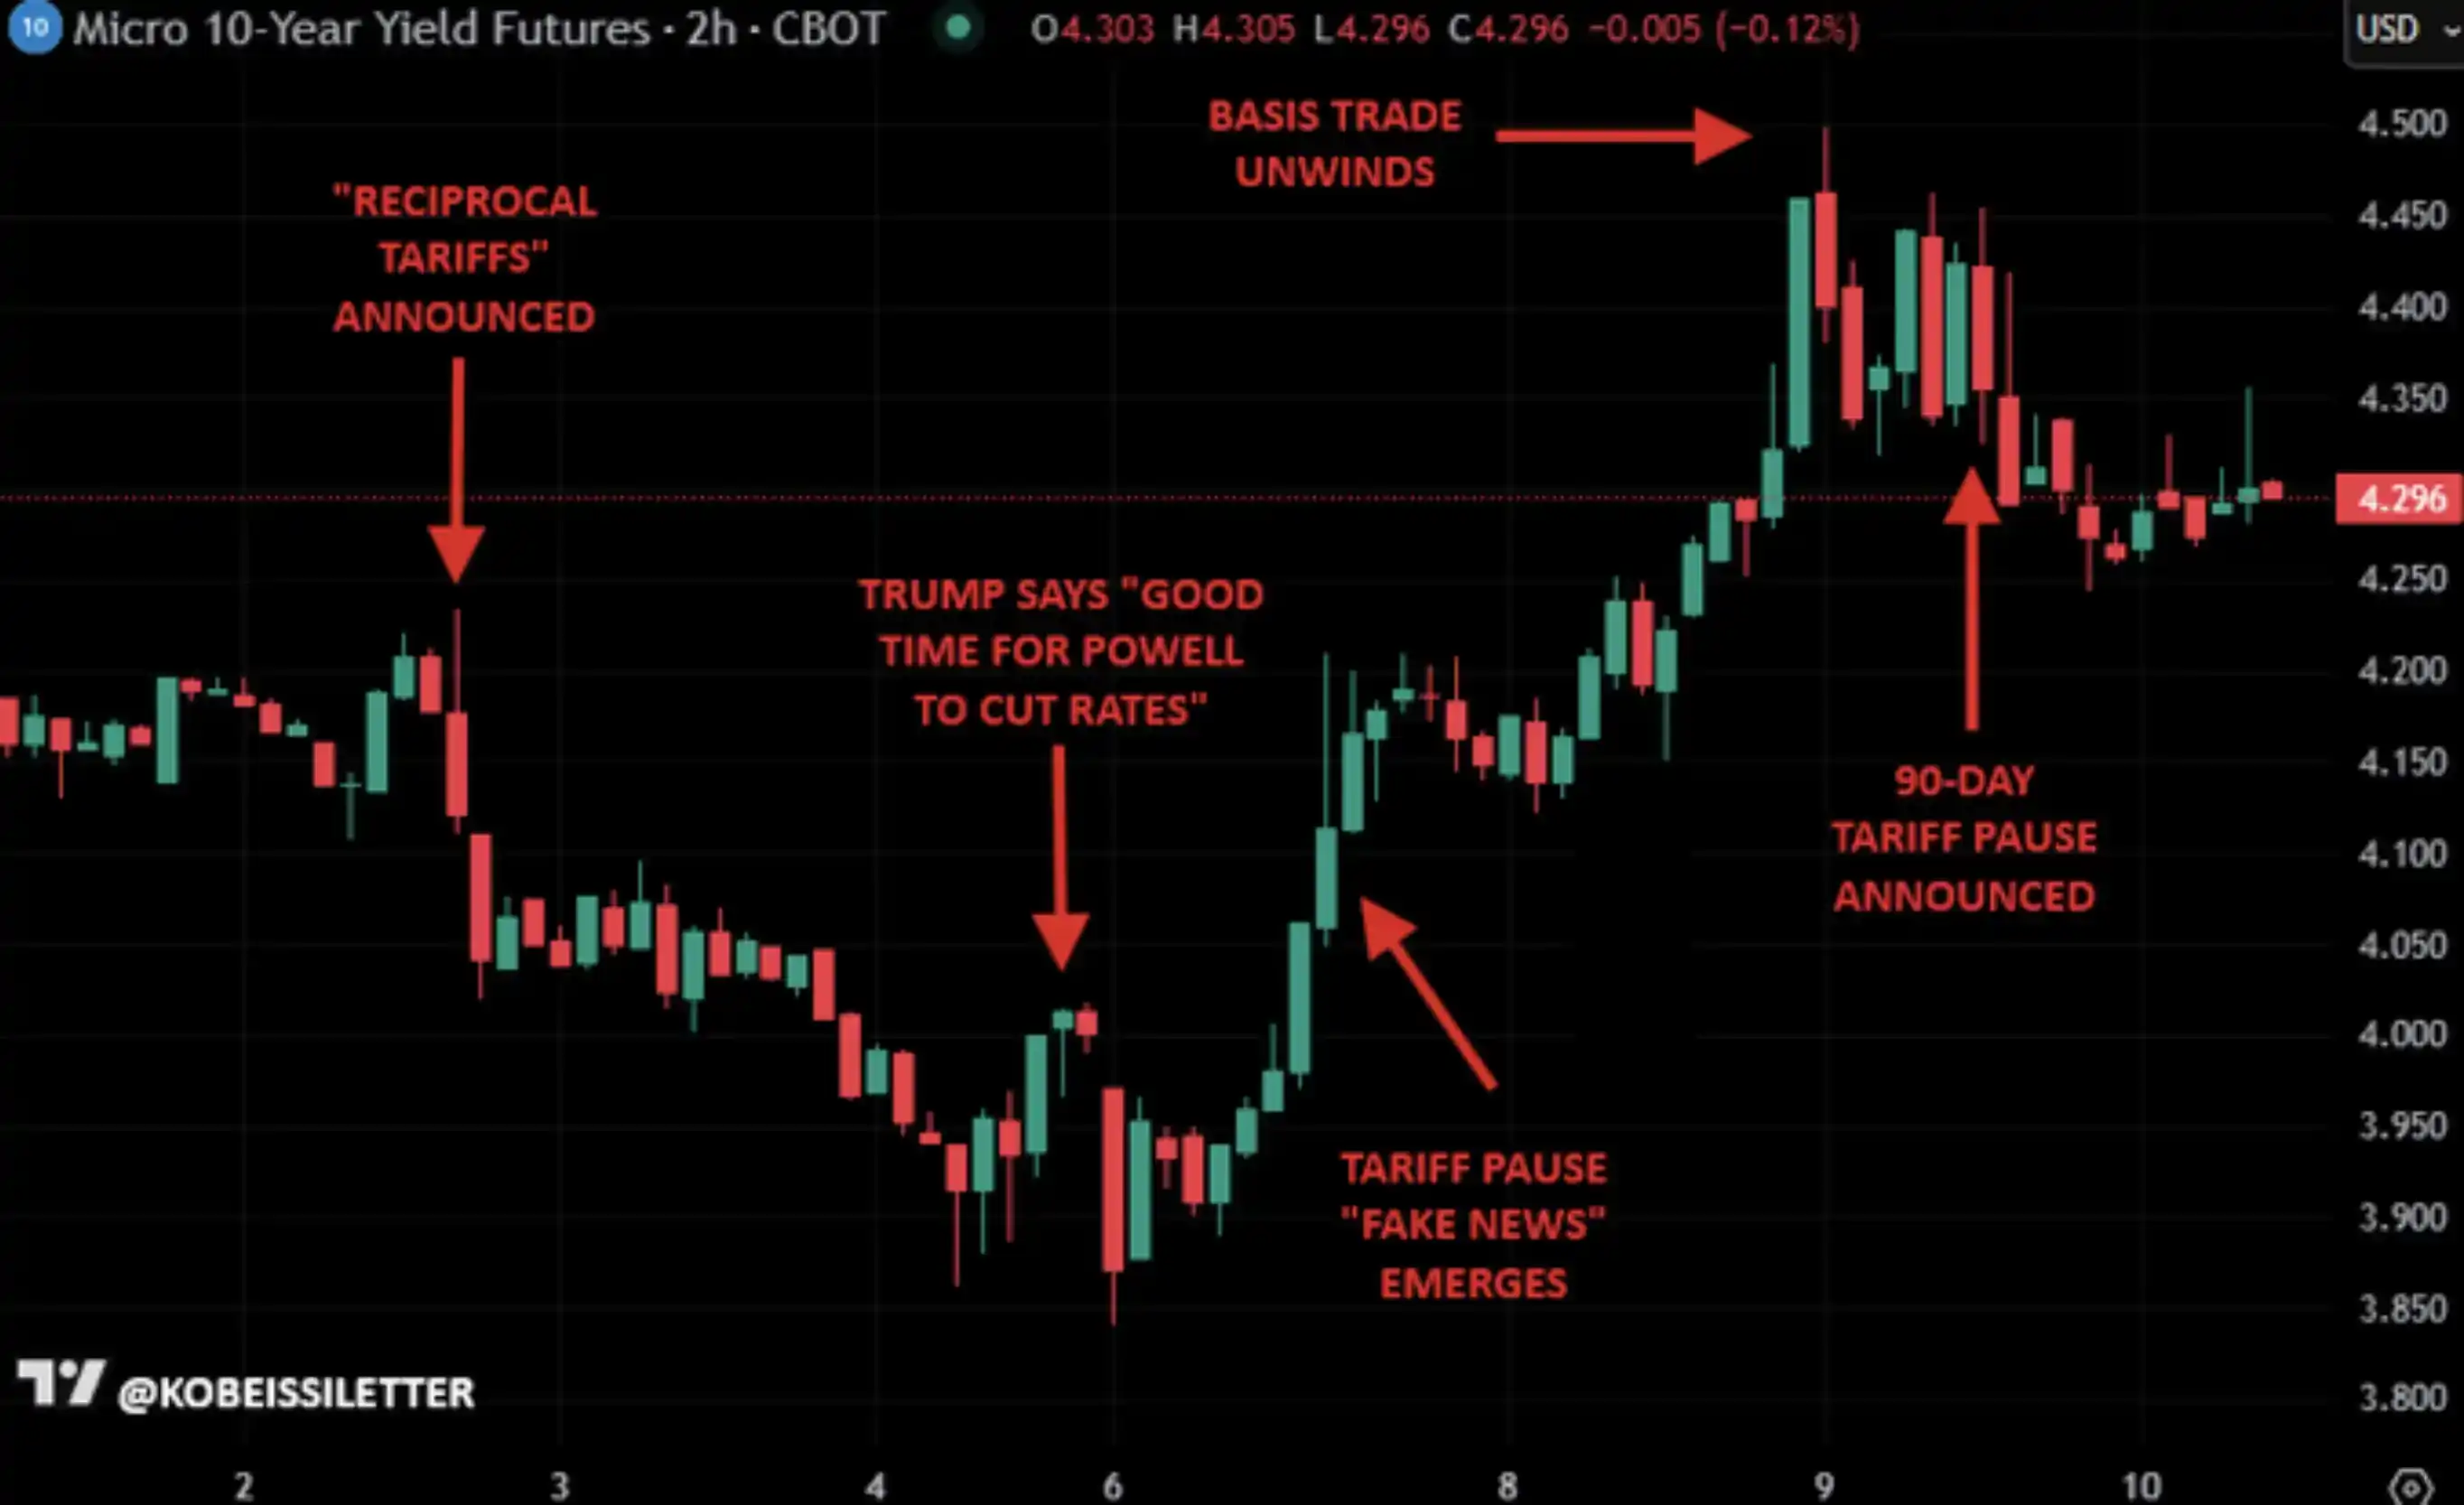
U.S. 10-Year Treasury Yield in April 2025
From this, it can be seen that the U.S. 10-year Treasury yield in the 4.50% to 4.70% range likely constitutes what we call Trump's "Policy Shift Zone." This level is slightly above the current position, and we largely agree: once yields reach this zone, policy intervention will become necessary to avoid a severe downturn in the U.S. economy.
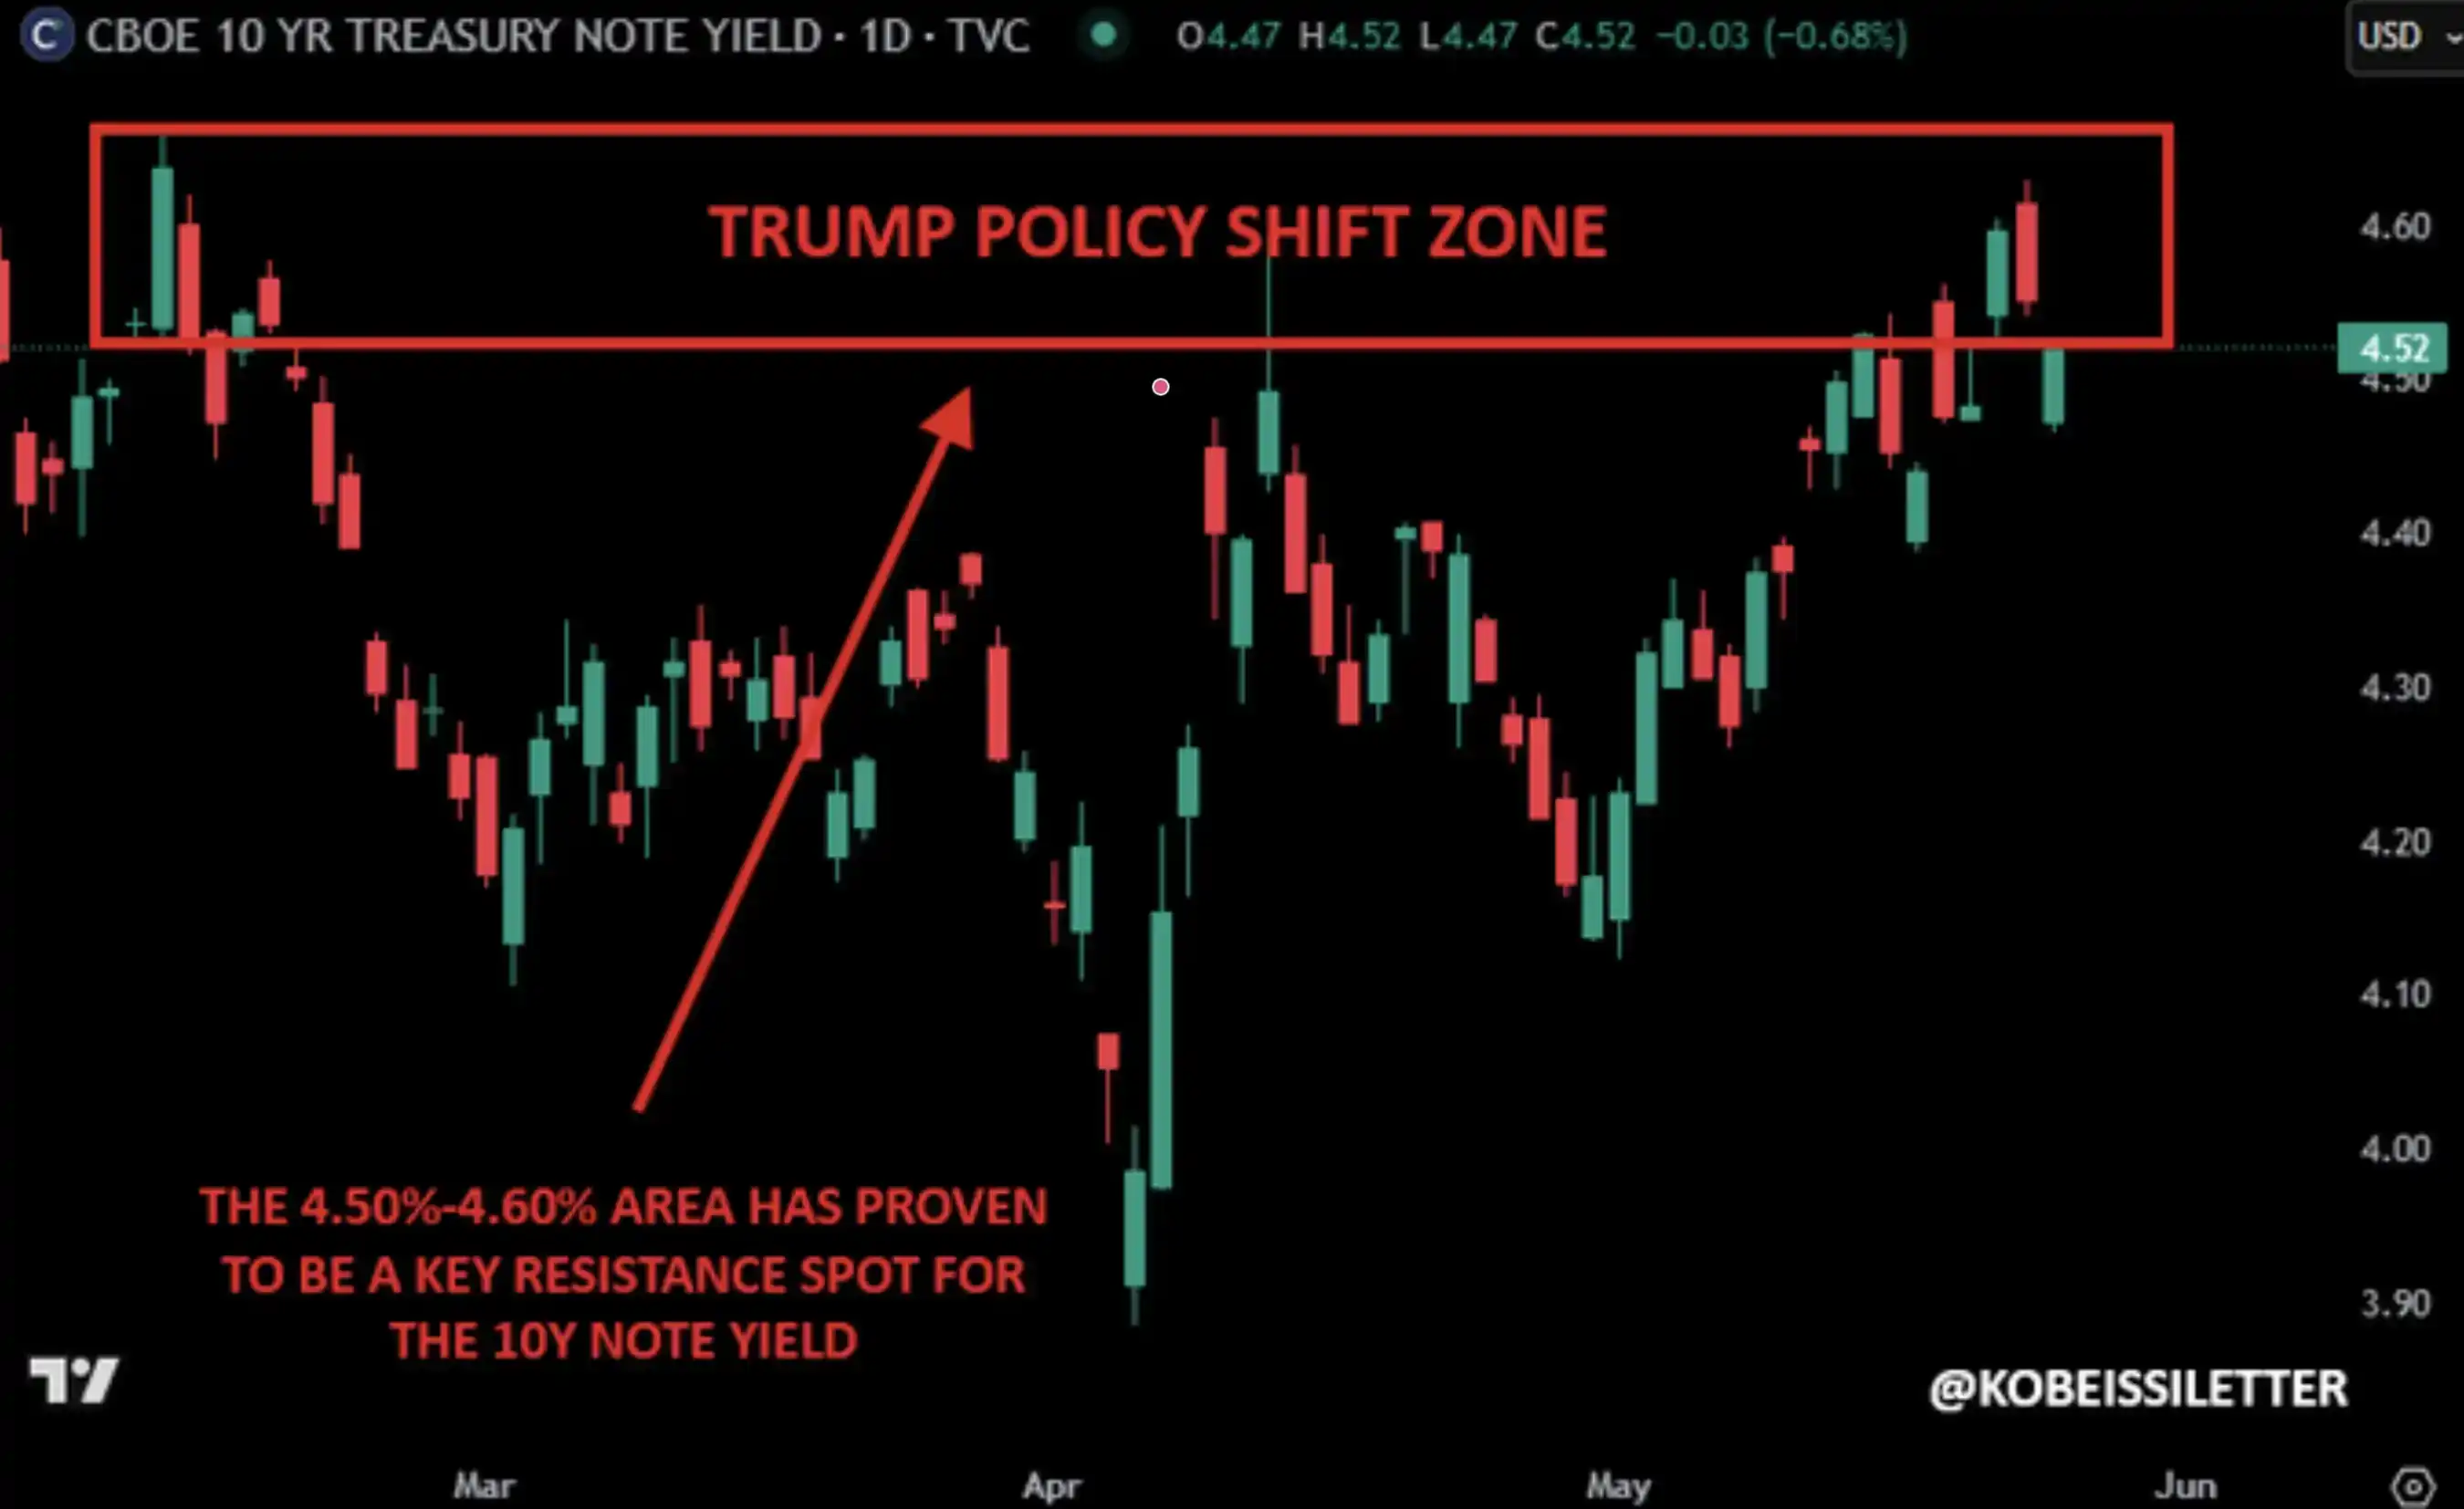
U.S. 10-Year Treasury Yield, Trump's "Policy Shift Zone"
In our view, this time will be no exception. In fact, we believe the timing of President Trump's announcement of "peace talks" on March 23 was no coincidence, as shown below.
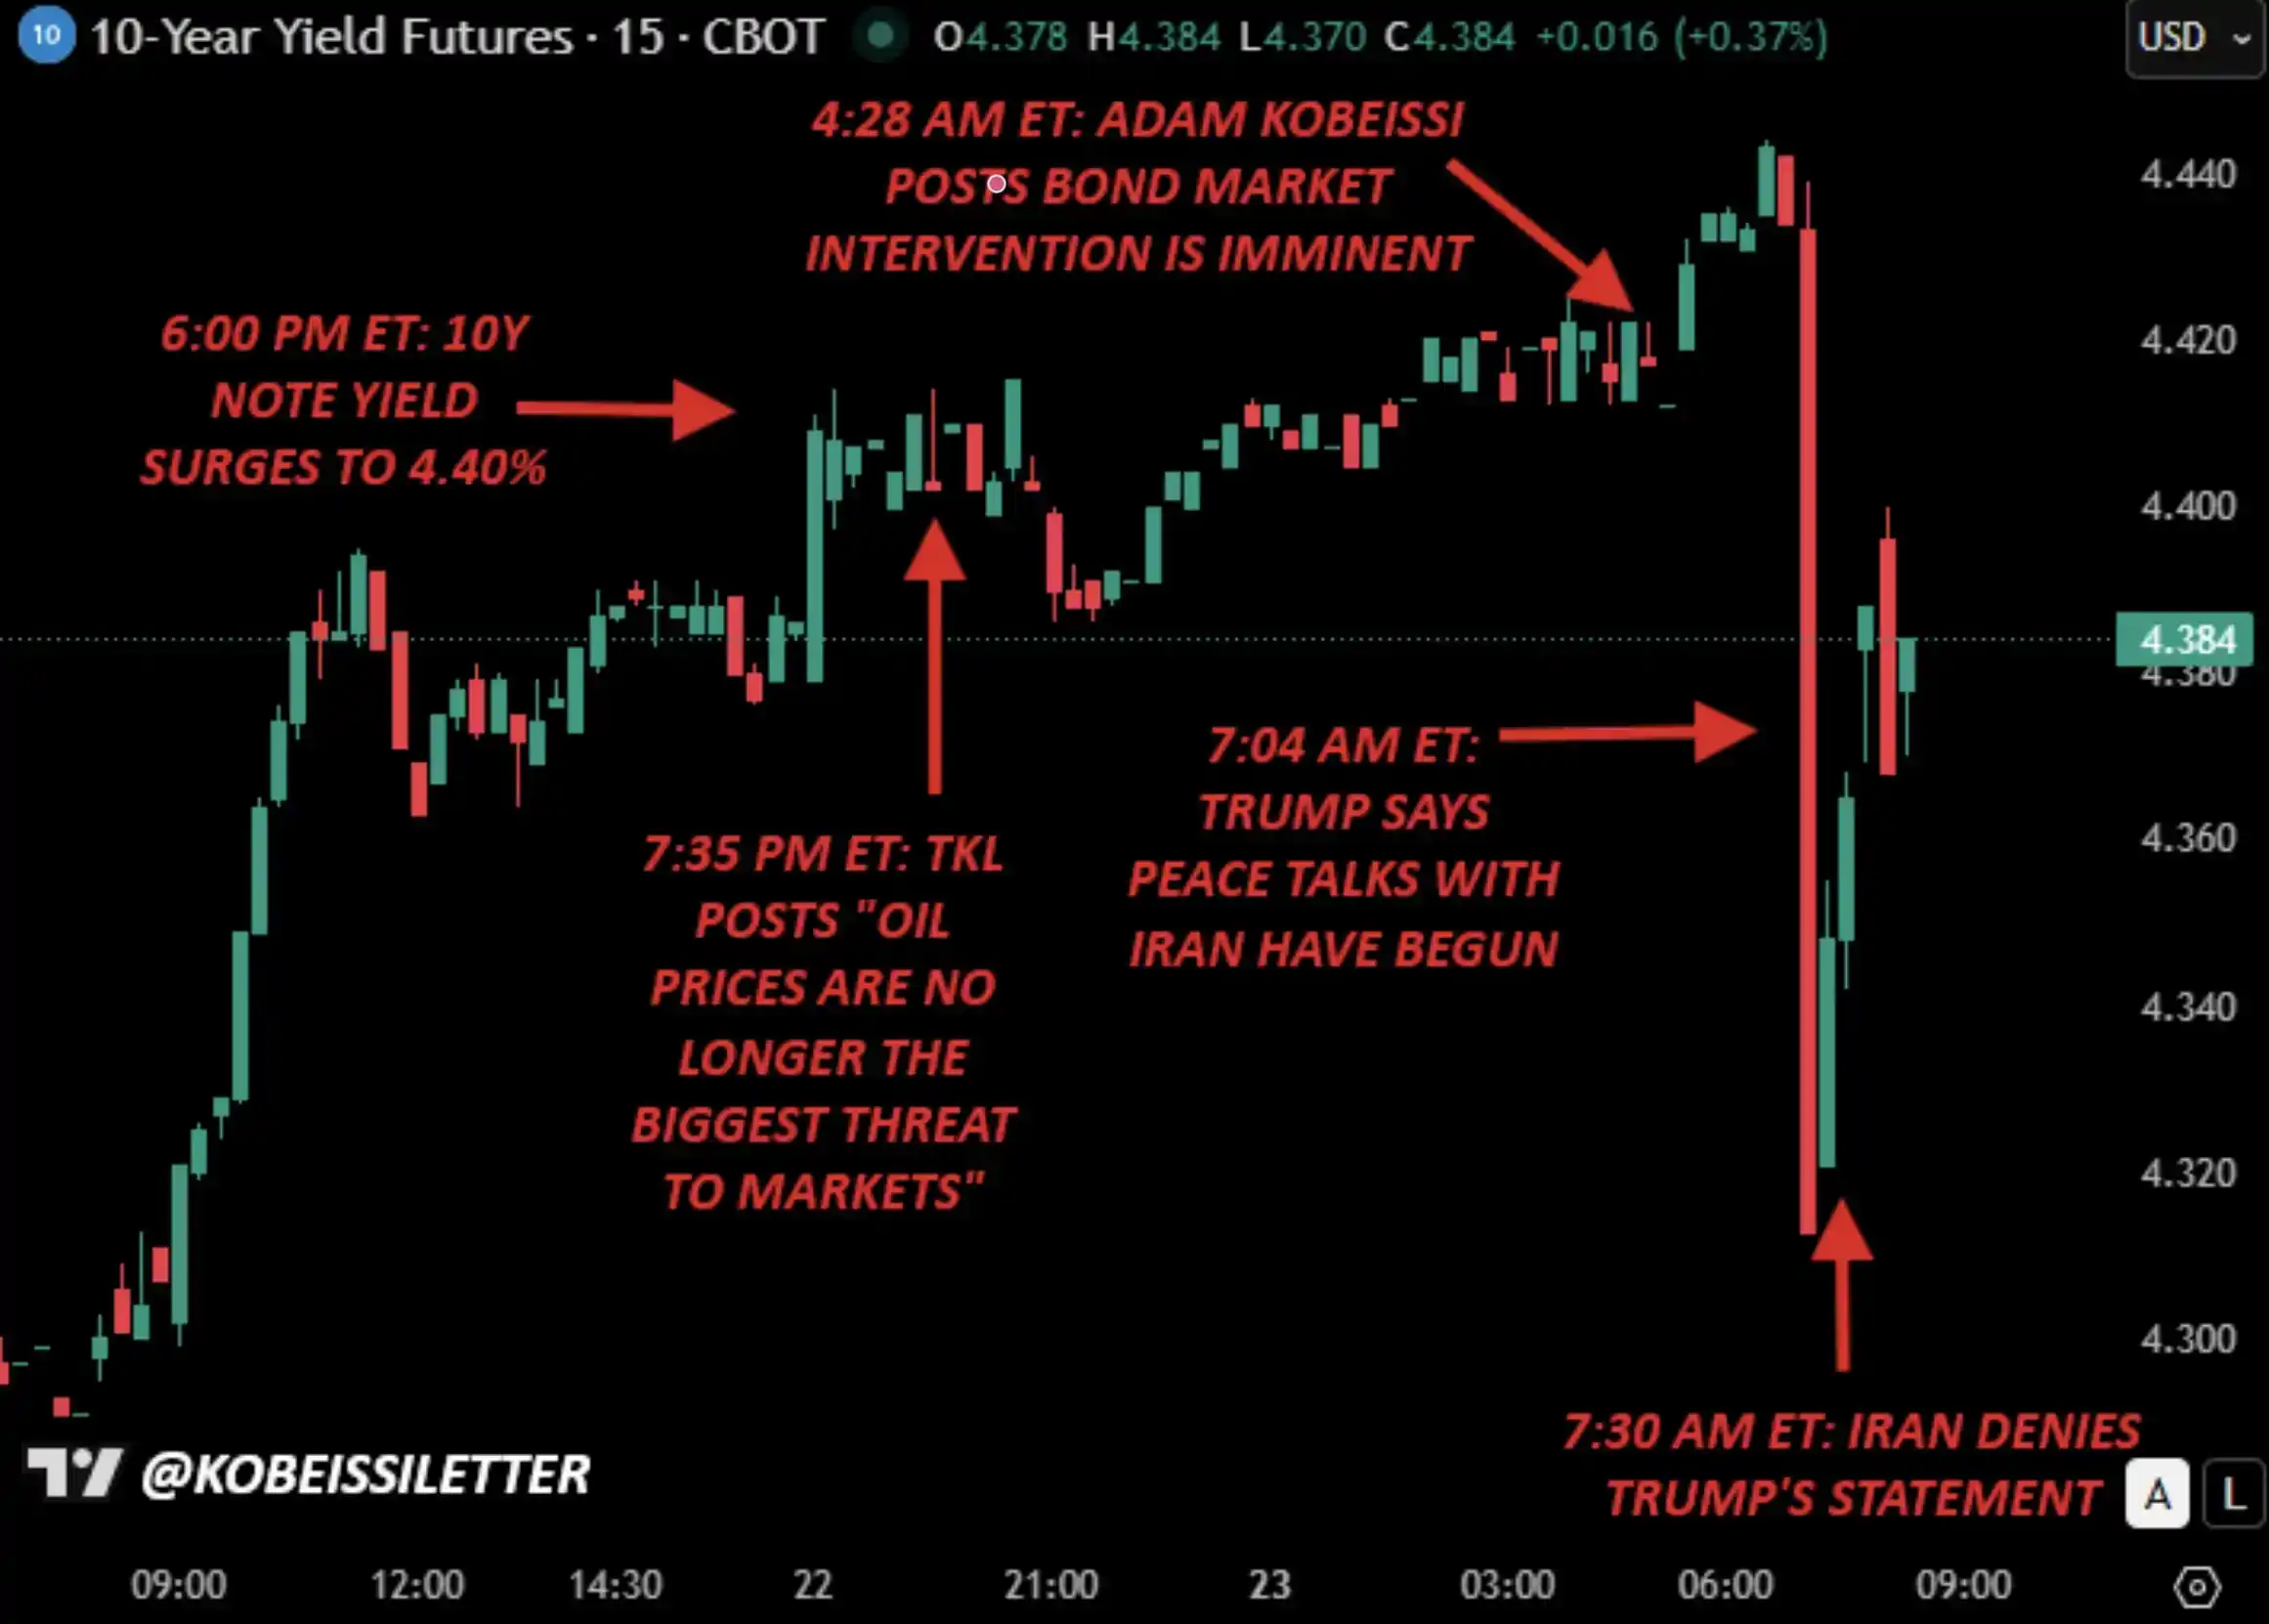
March 23, The First Signal of Intervention
At 4:30 AM ET on March 23, we pointed out that compared to the energy market, the bond market's issues had become more "disordered." Then, just 2 hours later, as the 10-year yield rose to 4.45%, President Trump likely engaged in decision-making discussions similar to those on April 9, 2025—when he announced the 90-day tariff suspension.
Another hour later, Trump announced a 5-day delay in strikes on Iranian power facilities and stated that "productive" dialogue had begun between the U.S. and Iran aimed at ending the war.
This may have been the first signal of intervention beginning.
What Should You Do Now?
The question we receive most often is: what does this mean?
From a macro perspective, we want to emphasize one point: the Trump administration is highly sensitive to fluctuations in the stock, commodity, and bond markets. This is good news for investors—Trump does not want the market to fall, and his focus on this is noticeably higher than previous administrations.
This is also why oil prices, after their initial spike, have remained somewhat contained. Crude investors generally believe that if oil prices approach $120 per barrel again (as seen early in the war), Trump will quickly intervene.
More broadly, we believe that as the 10-year yield rises, downward pressure on stocks will intensify; but when yields approach our stated 4.50% to 4.70% zone, the impending policy shift or "intervention" will limit the downside for stocks.
Furthermore, Trump, the Fed, and the entire government are aware that the U.S. labor market cannot withstand higher rates for long, which also means the current situation is unlikely to evolve into a "long war" and is more likely to see some form of easing or resolution within weeks rather than months.
Finally, behind all this volatility and noise, we want to emphasize: the AI revolution is only accelerating. Those AI companies that have led the market since 2022 and are now under pressure due to the pullback are actually investing more and building faster.
Our judgment on the stock market and the long-term trend of AI remains unchanged.
Keep Watching the Bond Market
What we are experiencing is not just volatility, but a shift in the decisive variable.
Over the past few weeks, market attention has focused on oil prices, war news, and geopolitical escalation. But beneath the surface, a more powerful force is gathering and beginning to dominate the situation.
The bond market is重新 determining the direction of stocks, commodities, and even policy itself. And history has repeatedly shown that when financial conditions tighten too quickly, the question of intervention is never "if" but "when."
As we have emphasized all year, this market is increasingly like a game of "pattern recognition," where the key is to act one step ahead of the "herd."
We believe the bond market will become the next most important narrative.
Original Link