Odaily Invited Market Analyst Cody Feng, Master of Financial Statistics from Columbia University, USA, focused on quantitative trading of US stocks during university and gradually expanded to digital assets such as Bitcoin. He has built a systematic quantitative trading model and risk control system through practical experience; possesses keen data insight into market fluctuations and is committed to continuous深耕 in the professional trading field, pursuing stable returns; will deeply analyze changes in BTC technology, macroeconomics, capital flows, etc., weekly, review and display practical strategies, and preview major events worth attention in the near future for reference.
Trading Weekly Report Core Summary:
• Strategy Execution (Short-term) Effectiveness Verification: Last week's trading strictly followed the established strategy, successfully completing two short-term operations (1x leverage), achieving a cumulative return of 0.62%.
• Core View (Short-term) Verification:Our short-term view proposed last week has been validated by the market: If Bitcoin can effectively hold above the $86,000~$86,500 area, it will maintain a range-bound oscillation between $86,500~$91,000. The price action over the past week precisely confirmed this judgment. Last week, the price reached a high of $91,764 and a low of $86,675, basically matching the key levels we provided, confirming the range-bound pattern.
In the previous analysis, we discussed the possibility of a scenario favorable for bears; from the perspective of the long main force in the current market, it might continue the current rhythm of slight fluctuations and slow upward movement. When touching the dual resistance of the downtrend line since last October and the long-term uptrend line since the end of 2022, it could break out with a high-volume阳线, breaking through the key resistance level in one go, forming a "short squeeze" to clear out bearish positions; it might then undergo a secondary探底 to wash out retail longs who followed at recent lows, thus completing the bottom construction. After that, the price is expected to rise rapidly,脱离 the main force's cost area, and start a relatively strong technical rebound. It must be clear that the above scenario is merely a推演 favorable for the long main force and is not inevitable. No matter how the market chooses, remember the principle that "the market is always right," and choosing the right应对 strategy is what truly counts.
I. Last Week's Trading Results: (12.29~01.04)
1、Short-term Trading Review (No Leverage):

• First Trade (Profit 2.45%): Based on the "sell on rallies upon encountering resistance in the core pressure zone" pattern. When the price surged to the $89,500~$91,000 area and encountered resistance, coupled with the spread trading model simultaneously发出 a top signal, a 30% short position was established, and finally profit was taken when the price fell near the support area.
• Second Trade (Profit -1.83%): This trade reused the above entry logic, but the price action deviated from expectations. The price completed technical indicator repair through sideways oscillation and then slowly rose, forming an effective breakout态势 for the key $91,000 resistance level. Finally, when observing that both trading models共振发出 a bottom signal, I decided to close all positions for a stop loss.
2、Last Week's Price Prediction and Operation Strategy Review:
Last Week's Core View: Focus on the gain or loss of the $86,000~$86,500 area. If effectively broken below, the price will oscillate and探底; if effectively held above, it will maintain a range-bound oscillation between $86,500~$91,000.
1、Key Level Review:
• Core Resistance: First resistance at the $89,500~$91,000 area; second resistance at the $93,000~$94,500 area.
• Core Support: First support at the $86,000~$86,500 area; second support at the $83,500~$84,500 area.
2、Operation Strategy Review:
• Midline Strategy: Maintain about 65% midline position (short).
• Short-term Strategy: Based on the actual market movement, we ultimately executed the core strategy using Plan A (effectively holding above the $86,000~$86,500 area).
• Entry: When the price rebounds to the $89,500~$91,000 area and shows resistance signals, a 30% short position can be established.
• Risk Control: Stop loss for short positions set above $92,500.
• Closing: When the price falls to the $86,000~$86,500 area and shows stabilization signals, close all short positions to take profit.
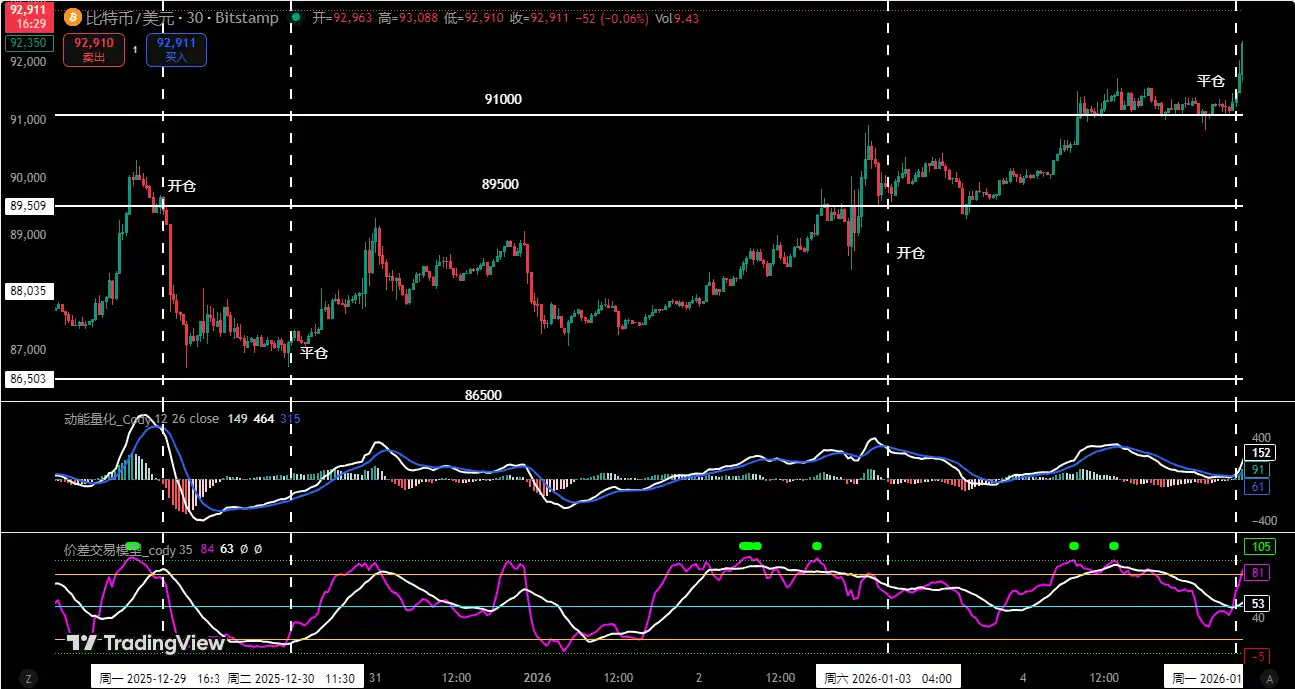
Figure 1
II. Quantitative Technical Analysis: How to Enter
Combining last week's market movement, the author will conduct an in-depth analysis of the evolution of Bitcoin's internal structure using multi-dimensional analysis models.
Bitcoin Weekly Chart: (Momentum Quantitative Model + Sentiment Quantitative Model)
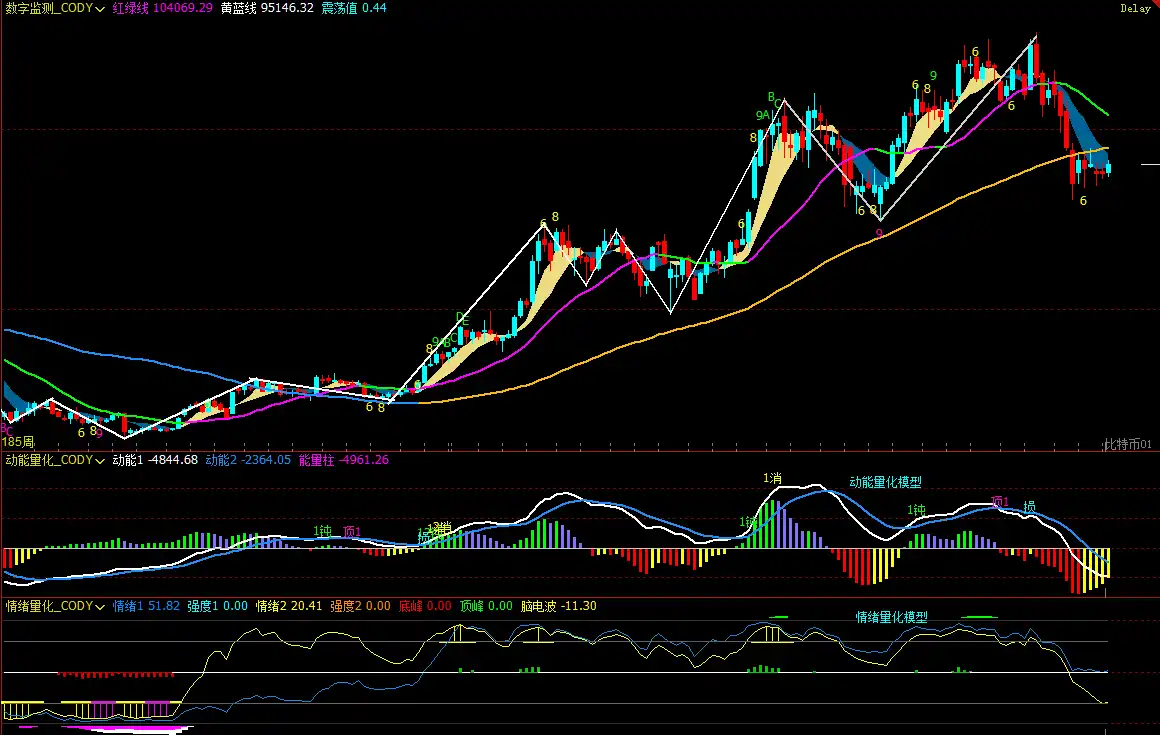
Figure 2
1、As shown in (Figure 2), analysis from the weekly chart:
• Momentum Quantitative Model: Technical indicators show that the two momentum lines continue to decline below the zero axis, while the negative energy柱 shows a萎缩态势. This reflects that although bears dominate, their downward momentum has not fully exerted itself.
Momentum Quantitative Model Indicates: Price decline index: High
• Sentiment Quantitative Model: Blue sentiment line value 51.82, strength zero; yellow sentiment line value 20.41, strength zero, peak value is 0.
Sentiment Quantitative Model Indicates: Price pressure and support index: Neutral
• Digital Monitoring Model: The price has broken below the bull-bear (yellow-blue line)分界线 for 7 weeks; short-term bottom digital signal has not appeared.
The above data indicates: Bitcoin's weekly chart has entered a bearish trend, beware of oscillation and adjustment risks.
Bitcoin Daily Chart:
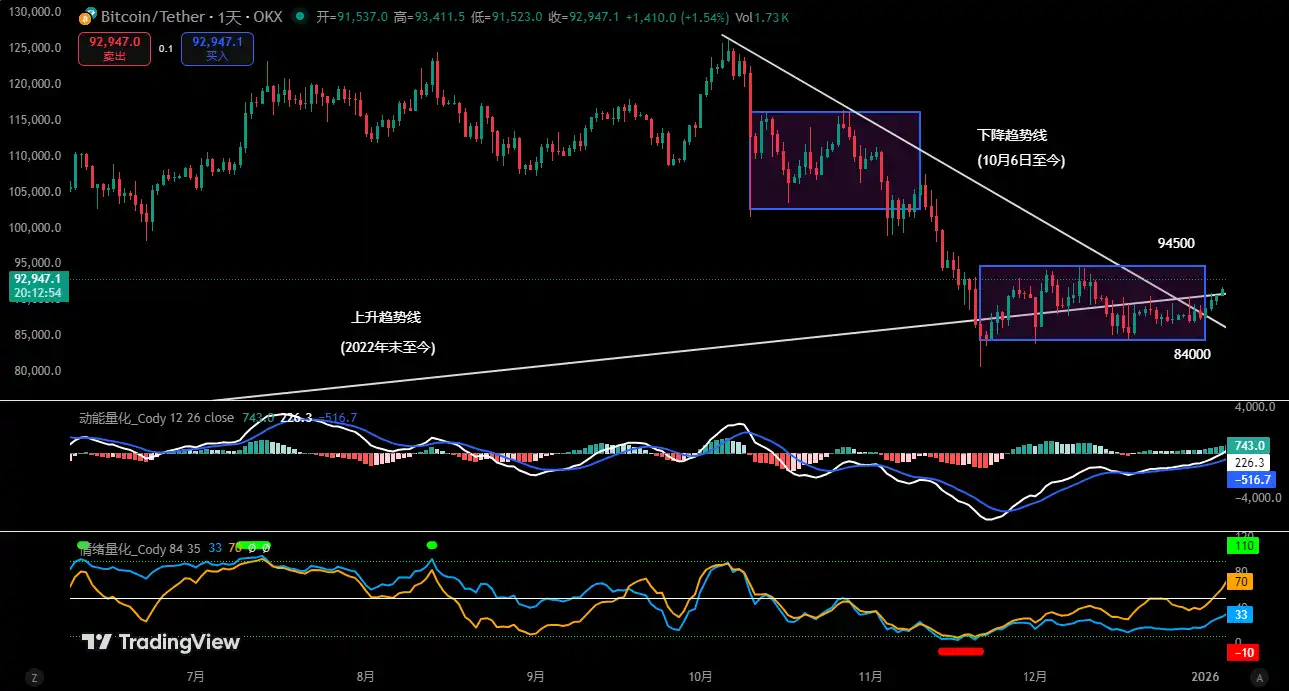
Figure 3
2、As shown in (Figure 3), analysis from the daily chart:
• Momentum Quantitative Model: In the latter half of last week, the price rose for 4 consecutive days, the two momentum lines'张口 gradually放大, the white momentum line is about to approach the zero axis, and the positive energy柱 shows signs of gradual放大.
Momentum Quantitative Model Indicates: The area near the zero axis is a必争之地 for bulls and bears, pay attention to the gain or loss of the zero axis.
• Sentiment Quantitative Model: After last Sunday's close, the blue sentiment line value was 29, strength zero; the yellow sentiment line value was 61, strength zero.
Sentiment Quantitative Model Indicates: Pressure and support index: Neutral
The above data suggests: The daily level is still in a bear market, but the market is beginning to choose a direction.
III. This Week's Market Prediction: (01.05~01.11)
1、Before the market makes a directional choice this week, the main fluctuation range is expected to be $84,000~$94,500. Operationally, focus on the bullish and bearish performance of the price near the range boundaries.
• If it effectively breaks below $84,000 key support, the price may start a探底行情, and the $80,000 level will be tested.
• If it effectively holds above $94,500 key resistance, it is expected to start a relatively strong technical rebound行情.
2、Core Resistance:
• First resistance area: $93,000~$94,500 area
• Second resistance area: Near $97,500~$99,500
• Important resistance: Near $104,000.
3、Core Support:
• First support: $89,500~$91,000 area
• Second support: $86,000~$86,500 area
• Third support: $83,500~$84,500 area
• Important support: Near $80,000.
IV. This Week's Operation Strategy (Excluding Sudden News Impact): (01.05~01.11)
1、 Midline Strategy:
• Before the price effectively breaks through $94,500, continue to hold about 65% midline position (short).
• If the price successfully breaks through and holds above $94,500, close all midline positions (short), hold coins and observe.
2、 Short-term Strategy: Use 30% of the position, set stop loss points, and look for "spread" opportunities based on support and resistance levels. (Use 30 minutes as the operation cycle).
3、 To应对 market evolution, we have formulated three short-term operation plans A/B/C:
• Plan A: If the price maintains oscillation within the $84,000~$94,500 range:
• Entry: When the price rebounds to the $93,000~$94,500 area and shows resistance signals, a 30% short position can be established.
• Risk Control: Stop loss for short positions set above $95,500.
• Partial Close: When the price falls to the $86,000~$86,500 area and shows stabilization signals, close part of the short positions.
• Full Close: When the price探至 near $84,000 and shows stabilization signals, close all positions to take profit.
• Plan B: If it effectively breaks below $84,000 support:
• Entry: If the price effectively breaks below, a 30% short position can be established.
• Risk Control: Stop loss set above $85,000.
• Close: When the price探至 near $80,000 and shows stabilization signals, gradually close positions to take profit.
• Plan C: If it successfully breaks through and holds above $94,500 resistance:
• Entry: If the price successfully breaks through, a 30% long position can be established.
• Risk Control: Stop loss set below $93,000.
• Close: When the price rebounds to near $97,500 and shows resistance signals, gradually close positions to take profit.
V. Special Tips:
1. When entering a position: Immediately set the initial stop loss level.
2. When profit reaches 1%: Move the stop loss to the entry cost price (breakeven point) to ensure capital safety.
3. When profit reaches 2%: Move the stop loss to the position of 1% profit.
4. Continuous tracking: Thereafter, for every additional 1% profit, move the stop loss同步 by 1%, dynamically protecting and locking in existing profits.
(Note: The above 1% profit trigger threshold can be flexibly adjusted by investors according to their own risk preference and标的 volatility.)
VI. This Week's Key Events Preview: (01.05~01.11)
I.密集 FOMC Official Speeches: A Forward-Looking Window for Policy Path Expectations
This week, several voting Fed officials will密集 speak on economic prospects and policy stance, constituting an important source of information for the market regarding the future monetary policy path.
Monday 01:30, 2026 FOMC voter, Minneapolis Fed President Kashkari will speak at the American Economic Association;
Tuesday 21:00, 2027 FOMC voter, Richmond Fed President Barkin speaks;
Friday 23:00, Kashkari will deliver welcome remarks and participate in an informal conversation at an online conference hosted by the bank;
Saturday 02:35, Barkin will speak again on economic prospects.
The market's core focus is on: whether officials will continue the "cautious easing" tone or begin to provide clearer signals for the next phase of policy turning. It should be noted that officials' speeches usually affect the expectation structure rather than short-term direction, and are more suitable as a reference for medium-term fund pricing anchors.
II. ADP Employment Data: An Important Bellwether Before Non-Farm
Wednesday 21:15, the US will announce December ADP employment change, previous value -32K, market forecast 45K.
Before the Non-Farm report, ADP plays more of a role in trend verification rather than pricing determination. The market's focus is not on monthly fluctuations, but on whether employment is gradually shifting from "high resilience" to "moderate cooling".
If ADP明显回升, it will短期 strengthen the judgment that "employment still has support," potentially raising US bond yields and putting some pressure on risk asset sentiment; if the data continues to be weak or below expectations, it will further verify the labor market cooling logic, providing前置铺垫 for easing expectations, which is偏友好 for Bitcoin's medium-term valuation.
III. Initial Jobless Claims: High-Frequency Indicator for Observing Employment Inflection Point
Thursday 21:30, the US will announce initial jobless claims for the week ending Jan 3, previous value 199K, forecast 216K.
Compared to ADP and Non-Farm, initial jobless claims are more like a liquidity and economic thermometer.持续高于 trend levels often意味着 the job market is beginning to show structural loosening.
If initial claims continue to rise and remain above 210K, it will strengthen expectations of economic cooling and policy easing, favoring the valuation repair of non-yielding assets like Bitcoin; if the data falls back again, it may strengthen the "economy still resilient" narrative, which is not conducive to short-term risk appetite expansion.
IV. Non-Farm Payrolls Report: The Core Macro Pricing Node of the Week
Friday 21:30, the US will announce the December unemployment rate and seasonally adjusted non-farm payrolls.
Unemployment rate previous value 4.60%, forecast 4.50%;
Non-farm payrolls previous value -105K, forecast 55K.
If non-farm payrolls温和回升, the unemployment rate remains high but does not worsen further, it will be interpreted by the market as "cooling but not stalling," and risk assets may overall maintain oscillation; if employment data significantly weakens again and the unemployment rate rises, it may短期 impact risk appetite, but medium-term反而 strengthen easing expectations, providing potential support for BTC.
Financial markets are changing rapidly, all market analysis and trading strategies need to be dynamically adjusted. All views, analysis models and operation strategies involved in this article are derived from personal technical analysis,仅供个人交易日志之用, do not constitute any investment advice or operation basis. The market has risks, investment needs to be cautious, DYOR.