Has the Crypto Market Bottomed? Here's What Institutions Think

marsbitPubblicato 2026-06-17Pubblicato ultima volta 2026-06-17

Introduzione

The crypto market is in a period of significant debate, with leading institutions offering differing views on whether a bottom has been reached. Three prominent firms have published detailed analyses: * **Galaxy Digital** argues Bitcoin has **not yet bottomed**. Their analysis of 13 historical indicators across six dimensions (valuation, profit-taking, miner pressure, etc.) shows only four are fully met. They project a potential bottom range between $30k and $54k. * **NYDIG** states a bottom is **possible but not likely**. While metrics are close to historic bear market extremes, they note the absence of a classic panic-selling event. They also suggest increased institutional adoption may have structurally altered the market cycle, potentially leading to a shallower downturn. * **Standard Chartered Bank** asserts the **bottom has already occurred** at around $59k. They cite two key factors: potential US-Iran diplomatic progress and the anticipated SpaceX IPO, which they believe absorbed capital and caused ETF selling pressure that is now subsiding. They forecast a year-end price target of $100k. Despite the surface-level disagreement, the reports share critical common ground more valuable for long-term investors: 1. All three believe the market bottom will form **within this year**. 2. All agree the current price is **closer to the bottom than to previous highs**. 3. All maintain a **bullish long-term outlook** for Bitcoin and a new cycle. The core takeaway is tha...

Author: Matt Hougan, Chief Investment Officer, Bitwise

Compiled by: Chopper, Foresight News

Over the past two weeks, three crypto research institutions I follow closely—other than Bitwise—have all published in-depth reports addressing the same question: Has the crypto market bottomed?

  • Galaxy Digital: Bitcoin Has Not Bottomed, Data Points to a Potential Bottom Range
  • NYDIG: What Factors Are Suppressing Bitcoin's Price Action
  • Standard Chartered: The Market Bottom Has Already Occurred

These three reports are comprehensive, containing vast amounts of data and complete logical reasoning, and are worth reading in full. However, if you are looking for a simple, unified answer, you might be disappointed: the judgments given by these three authoritative institutions are completely different.

Has the Market Bottomed?

  • Galaxy Digital: No
  • NYDIG: Possibly, but unlikely
  • Standard Chartered: Already bottomed

Let's now break down the core logic of each institution one by one.

Three Institutions, Three Views

Galaxy Digital

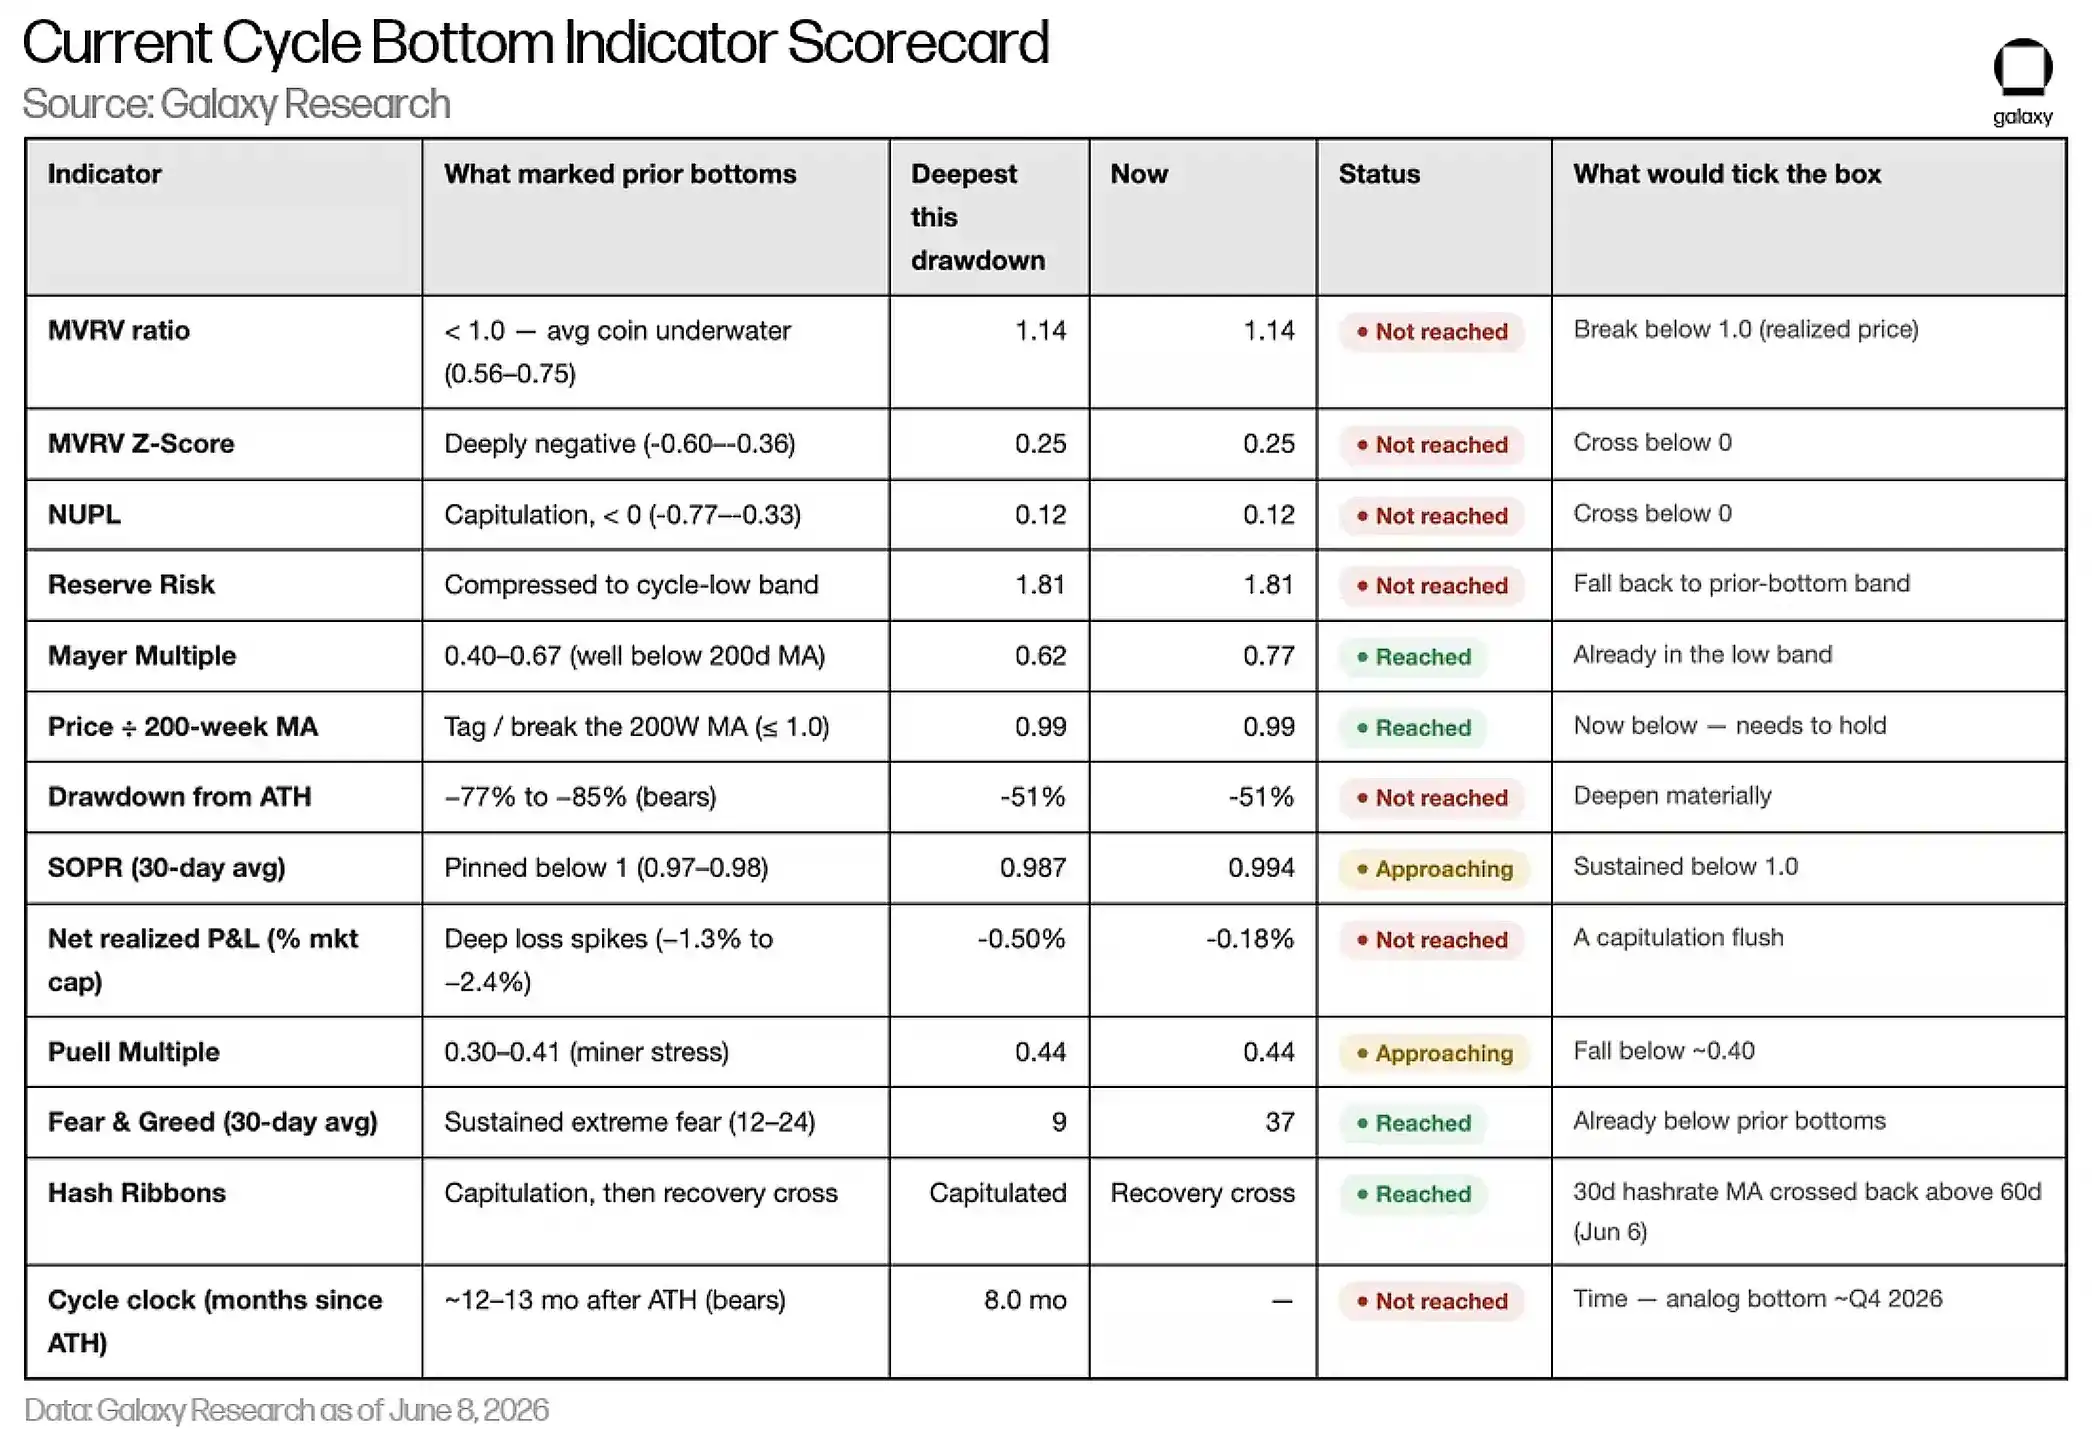
Galaxy Digital reviewed Bitcoin's complete 17-year price history and summarized 13 indicators that tend to appear simultaneously when the market truly bottoms out. These indicators cover six dimensions: valuation, profit-taking sell-offs, miner pressure, trend, bull/bear cycles, and market sentiment. Long-term Bitcoin investors will be familiar with these indicators, including the 200-week moving average, the Fear & Greed Index, and the Mayer Multiple.

Galaxy found that currently only 4 indicators are fully met, 2 are partially met, and the remaining 7 have not triggered bottom signals. The report concludes that Bitcoin's bottom range for this cycle is between $30,000 and $54,000, with a neutral baseline bottom between $40,000 and $46,000.
NYDIG

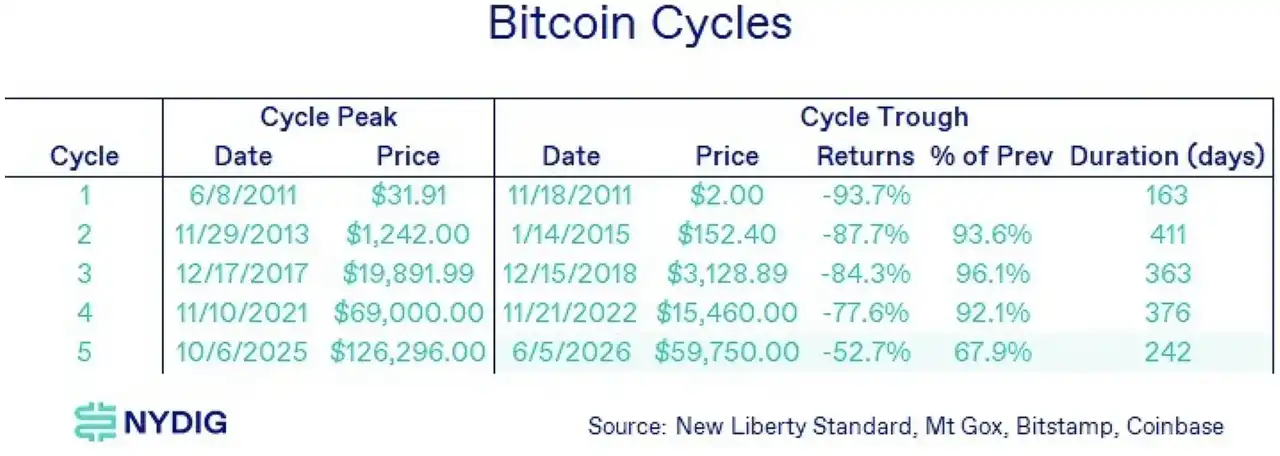
NYDIG also employs a multi-indicator comprehensive analysis framework, comparing the current market with historical cycles and evaluating the market state from dimensions such as the duration of the maximum drawdown and holder profit/loss (known to Bitcoin users as 'MVRV', the ratio of market capitalization to realized value).

NYDIG believes that current indicators are very close to the extreme ranges seen at historical major bottoms, but the hallmark comprehensive panic sell-off seen in previous major bear markets has not yet occurred. At the same time, the report introduces a variable: institutional capital inflows have fundamentally changed Bitcoin's cycle logic from the ground up. This cycle's correction might be shallower than historical bear markets. From this perspective, the bottom may have already occurred.
Standard Chartered

Standard Chartered is not uniformly bullish on Bitcoin. Back in February when Bitcoin was at $67,000, the bank lowered its full-year price forecast, warning that prices could fall to $50,000, citing weaker macroeconomics and continuous selling pressure from Bitcoin ETFs.

However, last Friday Standard Chartered updated its view, identifying $59,000 as the bottom for this price action. The two main logics supporting this view are: the potential for a U.S. diplomatic agreement with Iran; and the highly anticipated SpaceX IPO. Standard Chartered believes that a significant number of ETF holders sold Bitcoin earlier to raise funds for participating in SpaceX's listing, and this selling pressure will gradually subside. Standard Chartered's latest forecast is that Bitcoin will challenge $100,000 within the year.

The Consensus Among the Three Reports Far Outweighs the Divergence

You might wonder what effective information can be extracted from three reports with completely opposing views. In fact, the underlying consensus among the three reports far outweighs the surface divergence. For long-term investors, the conclusions on which they agree are far more valuable than their disagreements:

  • All three judge that the market bottom for this cycle will occur within this year;
  • All three believe the current price is closer to the bottom than to the previous highs;
  • All three are consistently optimistic that Bitcoin will experience another bull market in the future.

At the time of writing, Bitcoin's price is around $67,000. One report claims the $59,000 bottom has already occurred, one sees a potential drop to $50,000, and another gives a neutral baseline bottom of $43,000. But the core conclusion is highly unified: the bottom will definitely be reached this year.

This is the key point long-term investors should focus on most. Whether the bottom lands at $40,000, $50,000, or $60,000, the difference is actually limited; what truly matters is whether Bitcoin can subsequently surge to $100,000, $200,000, or even a million dollars. As long as it reaches those levels, entering a long-term position at current prices offers considerable profit potential.

A highly ironic phenomenon in the current market is that everyone is obsessing over whether the market has bottomed, while overlooking a more important question—whether the top has already appeared. In my view, as long as the peak has not yet arrived, Bitcoin holds value for long-term allocation.

The core logic supporting Bitcoin's long-term value not only remains intact but is continuously strengthening: government debt continues to accumulate worldwide with no effective solution in sight; inflation constantly erodes the real purchasing power of wealth; public trust in centralized institutions like governments and banks continues to decline; the global digitalization process keeps accelerating; Bitcoin's trading and investment channels are continuously improving; the early crypto-native generation is aging, with their assets and industry influence growing simultaneously.

Of course, potential risks remain in the market, including threats from quantum computing and tightening global regulation. But overall, the current situation is better than during any previous crypto winter.


Domande pertinenti

QWhat are the three different views on whether the crypto market has bottomed, according to the research reports mentioned in the article?

AGalaxy Digital believes Bitcoin has not yet bottomed. NYDIG sees a possibility but thinks it's unlikely. Standard Chartered Bank states the market bottom has already occurred.

QWhat is the core logical framework Galaxy Digital uses to assess if the market has bottomed?

AGalaxy Digital uses a framework of 13 indicators across six dimensions: valuation, profit-taking sales, miner stress, price trends, bull/bear cycles, and market sentiment, such as the 200-week moving average, Fear & Greed Index, and Mayer Multiple.

QWhat specific price range does Galaxy Digital identify as the potential bottom for Bitcoin in this cycle?

AGalaxy Digital identifies the potential bottom range for Bitcoin as $30,000 to $54,000, with a neutral base case bottom of $40,000 to $46,000.

QWhat key reason does Standard Chartered Bank give for reversing its earlier bearish view and now claiming the bottom has been reached?

AStandard Chartered Bank's reversal is based on two key logics: the potential for a US diplomatic agreement with Iran, and the anticipated SpaceX IPO, which they believe caused selling pressure from ETF holders that is expected to subside.

QDespite their differing views on the exact bottom, what major consensus do all three research reports share?

AAll three reports agree that the market bottom will occur within the current year, that current prices are closer to the bottom than the previous highs, and that Bitcoin will experience a new bull market in the future.

Letture associate

STAR 50 Soars 10.73%, Why Did A-Shares Stage a "V-Shaped Reversal"?

After a prolonged decline, the Chinese A-share market staged a strong rally on July 21. The STAR 50 index surged 10.73%, its largest single-day gain in nearly a year, leading a broad-based "V-shaped" reversal. The Shanghai Composite Index rose 1.79%, the Shenzhen Component Index gained 4.81%, and the ChiNext Index jumped 7.05%. Total market turnover reached 2.97 trillion yuan, an increase of 256.1 billion yuan from the previous session, with over 3,100 stocks advancing. The semiconductor sector spearheaded the rebound, with related ETFs posting significant gains. Analysts attribute the surge to three converging factors. First, coordinated capital inflows from "national team" institutions, insurance funds, listed company buybacks, and fund house self-purchases have bolstered market liquidity and confidence. Second, supportive policy signals, including commitments from regulators to ensure stable market operations, provided a favorable backdrop. Third, a stabilization and recovery in overseas markets, notably South Korea, created a positive external environment. Institutions suggest the most severe panic selling phase for the tech sector has likely passed, following a significant digestion of crowded positions and leveraged funds. While short-term volatility may persist, the medium to long-term outlook remains underpinned by enduring trends like AI computing demand expansion and semiconductor localization. The market's focus now shifts to the sustainability of supportive fund flows, earnings reports, and upcoming catalysts from the global AI industry chain.

marsbitAdesso

STAR 50 Soars 10.73%, Why Did A-Shares Stage a "V-Shaped Reversal"?

marsbitAdesso

U.S. Tech Momentum Stocks Post Largest Single-Day Gain Ever, But Is the Plunge Over?

US tech momentum stocks staged a sharp rebound on Tuesday (July 21st). Morgan Stanley's TMT Momentum Factor surged over 12%, marking its largest single-day gain on record, exceeding even peaks from the 2000 dot-com bubble. Key momentum indices from Goldman Sachs also posted their strongest daily performances in years. The rally was led by semiconductors, with the Philadelphia Semiconductor Index jumping 4.6%. This rebound followed three consecutive down days and a cumulative 33% plunge in momentum stocks, one of the steepest drawdowns since the dot-com era. Analysts attribute the surge largely to a short squeeze. Heavy selling had pushed high-beta momentum stocks into deeply oversold territory, forcing many short sellers, particularly in Asia, to cover their positions, creating a self-reinforcing buying spiral. However, the rebound's internals appear weak. Trading volume was notably low, and advancing stocks still lagged decliners on the S&P 500, indicating a narrow, concentrated rally rather than broad market participation. Diverging views emerge on the outlook. BTIG warns the bounce has hit key resistance and recommends selling into strength, citing extreme volatility and historical parallels to past market tops. Conversely, Goldman Sachs and UBS believe the momentum unwind is nearing its end, suggesting it may be time to gradually add exposure, as positioning has been significantly reduced. They caution, however, that high volatility warrants a measured approach, potentially using defined-risk strategies. The upcoming earnings season, particularly reports from major tech firms like Alphabet, is seen as a critical test for the rally's sustainability. Simultaneously, bond markets flashed a warning, with yields rising partly due to spiking oil prices. Analysts note that if long-term Treasury yields break decisively higher, it could pose a significant headwind for equities, especially growth stocks.

marsbit8 min fa

U.S. Tech Momentum Stocks Post Largest Single-Day Gain Ever, But Is the Plunge Over?

marsbit8 min fa

U.S. Tech Momentum Stocks Record Largest Single-Day Gain Ever, but Has the Rout Ended?

U.S. tech momentum stocks staged a dramatic rebound on Tuesday, July 21st. Key momentum indices like the Morgan Stanley TMT Momentum Factor and Goldman Sachs' High Beta Momentum Long Index posted historic or near-historic single-day gains, fueled largely by semiconductor stocks. This sharp rally followed a severe three-day sell-off that saw momentum stocks plunge 33%, marking one of the steepest pullbacks since the dot-com bubble. Analysts attribute the bounce primarily to a short squeeze, as forced covering from over-leveraged traders, particularly in Asia, created a buying spiral. However, the rally's health is questioned due to weak market breadth—overall trading volume was low, and decliners outnumbered advancers in the S&P 500 despite the index's gain—suggesting a narrow, concentrated surge rather than broad recovery. Opinions on the sustainability diverge. BTIG strategists warn the rebound has hit key resistance levels, citing extreme volatility and historic stock dispersion as signs of an ongoing broader correction, and recommend selling into strength. Conversely, Goldman Sachs and UBS view the aggressive momentum unwinding as nearing its end, noting reduced positioning and a lack of new fundamental catalysts. They suggest the sell-off presents a selective opportunity to add exposure, albeit cautiously and gradually using defined-risk strategies. The immediate trajectory hinges on the ongoing earnings season, with market focus on Alphabet's capital expenditure guidance for AI investment clarity. Meanwhile, bond markets present a risk, with rising Treasury yields—potentially heading toward 5.5%—and widening credit spreads for mega-cap tech companies posing a threat to equity valuations. The combination of technical factors, earnings results, and macro conditions leaves the durability of the rebound in doubt.

链捕手10 min fa

U.S. Tech Momentum Stocks Record Largest Single-Day Gain Ever, but Has the Rout Ended?

链捕手10 min fa

Long-Divided Must Unite, Long-United Must Divide: When L1 Becomes Its Own Rollup, What Is Ethereum's Endgame?

"The Inevitable Cycle: When L1 Becomes Its Own Rollup – What is Ethereum's Endgame?" For years, the Ethereum community grappled with concerns that L2s were fragmenting the ecosystem and eroding L1's value. While L2s provided cheaper execution, they also splintered liquidity and the unified user experience of a single chain. This has prompted a fundamental reassessment of the relationship between L1 and L2. Ethereum's roadmap is evolving. The "Scale" initiative merges L1 and L2 expansion into a holistic framework. L1 itself is advancing with higher gas limits, statelessness, and zkEVM verification, no longer content to be just a low-throughput settlement layer. Consequently, the primary value proposition of L2s is shifting from merely providing cheap blockspace to offering L1 cannot easily provide: application-specific optimizations, privacy features, and flexible governance models. L2s are becoming a spectrum of execution environments with varying degrees of security inheritance from Ethereum. A critical challenge in this multi-chain future is interoperability. The vision is to make Ethereum "feel like one chain again." This relies on advancements in native account abstraction (like EIP-7702) and intent-based architectures (Open Intents Framework), where users declare desired outcomes, and solvers handle the complex cross-chain execution. Furthermore, shortening Ethereum's finality time from minutes to seconds is crucial, as it underpins trust between chains for bridges, stablecoins, and cross-chain applications. Perhaps the most provocative idea is that Ethereum L1 itself could become a form of "its own Rollup." As zkEVM and proof systems mature, high-performance nodes could execute transactions and generate validity proofs. Regular validators would then verify these proofs instead of re-executing all transactions. This blurs the traditional L1/L2 hierarchy, making "Rollup" more of a general execution-verification architecture. Native Rollup aims to integrate L2 validation more directly into the Ethereum protocol, allowing L2s to inherit L1's security more fully and move away from reliance on security councils. In the end, L2s are not destined to replace L1 or be made obsolete by it. The likely future is a unified system where diverse execution environments—each optimized for specific use cases like DeFi, gaming, or privacy—coexist. They will share a common foundation of security, liquidity, and verifiable state, seamlessly connected to restore a cohesive user experience. The next phase for Ethereum is not just about scaling through separation, but about intelligently reintegrating what was separated back into a coherent whole.

链捕手26 min fa

Long-Divided Must Unite, Long-United Must Divide: When L1 Becomes Its Own Rollup, What Is Ethereum's Endgame?

链捕手26 min fa

Trading

Spot
活动图片




