The crypto market has been experiencing pain since last October, and memecoins have been hit the hardest. For instance, Dogecoin [DOGE] extended its decline with a 4% drawdown in the past 24 hours.
Following the ongoing sell-off, DOGE is 90% below its all-time high (ATH), which was set five years ago. Still, structural outlooks and indicators point to more pain.
Dogecoin’s structure points at more decline, but...
Dogecoin broke down below a sideways market that has been in place since February on the daily chart. The breakdown was confirmed with a retest at $0.08926 with the recent move surpassing February’s low.
From a structural point of view, Dogecoin may continue declining as it had also rejected below the 200-day MA. This indicated bears were the dominant force controlling the price movement.
However, the net volume was awakening, surging 98.85%, which suggests mild buying.

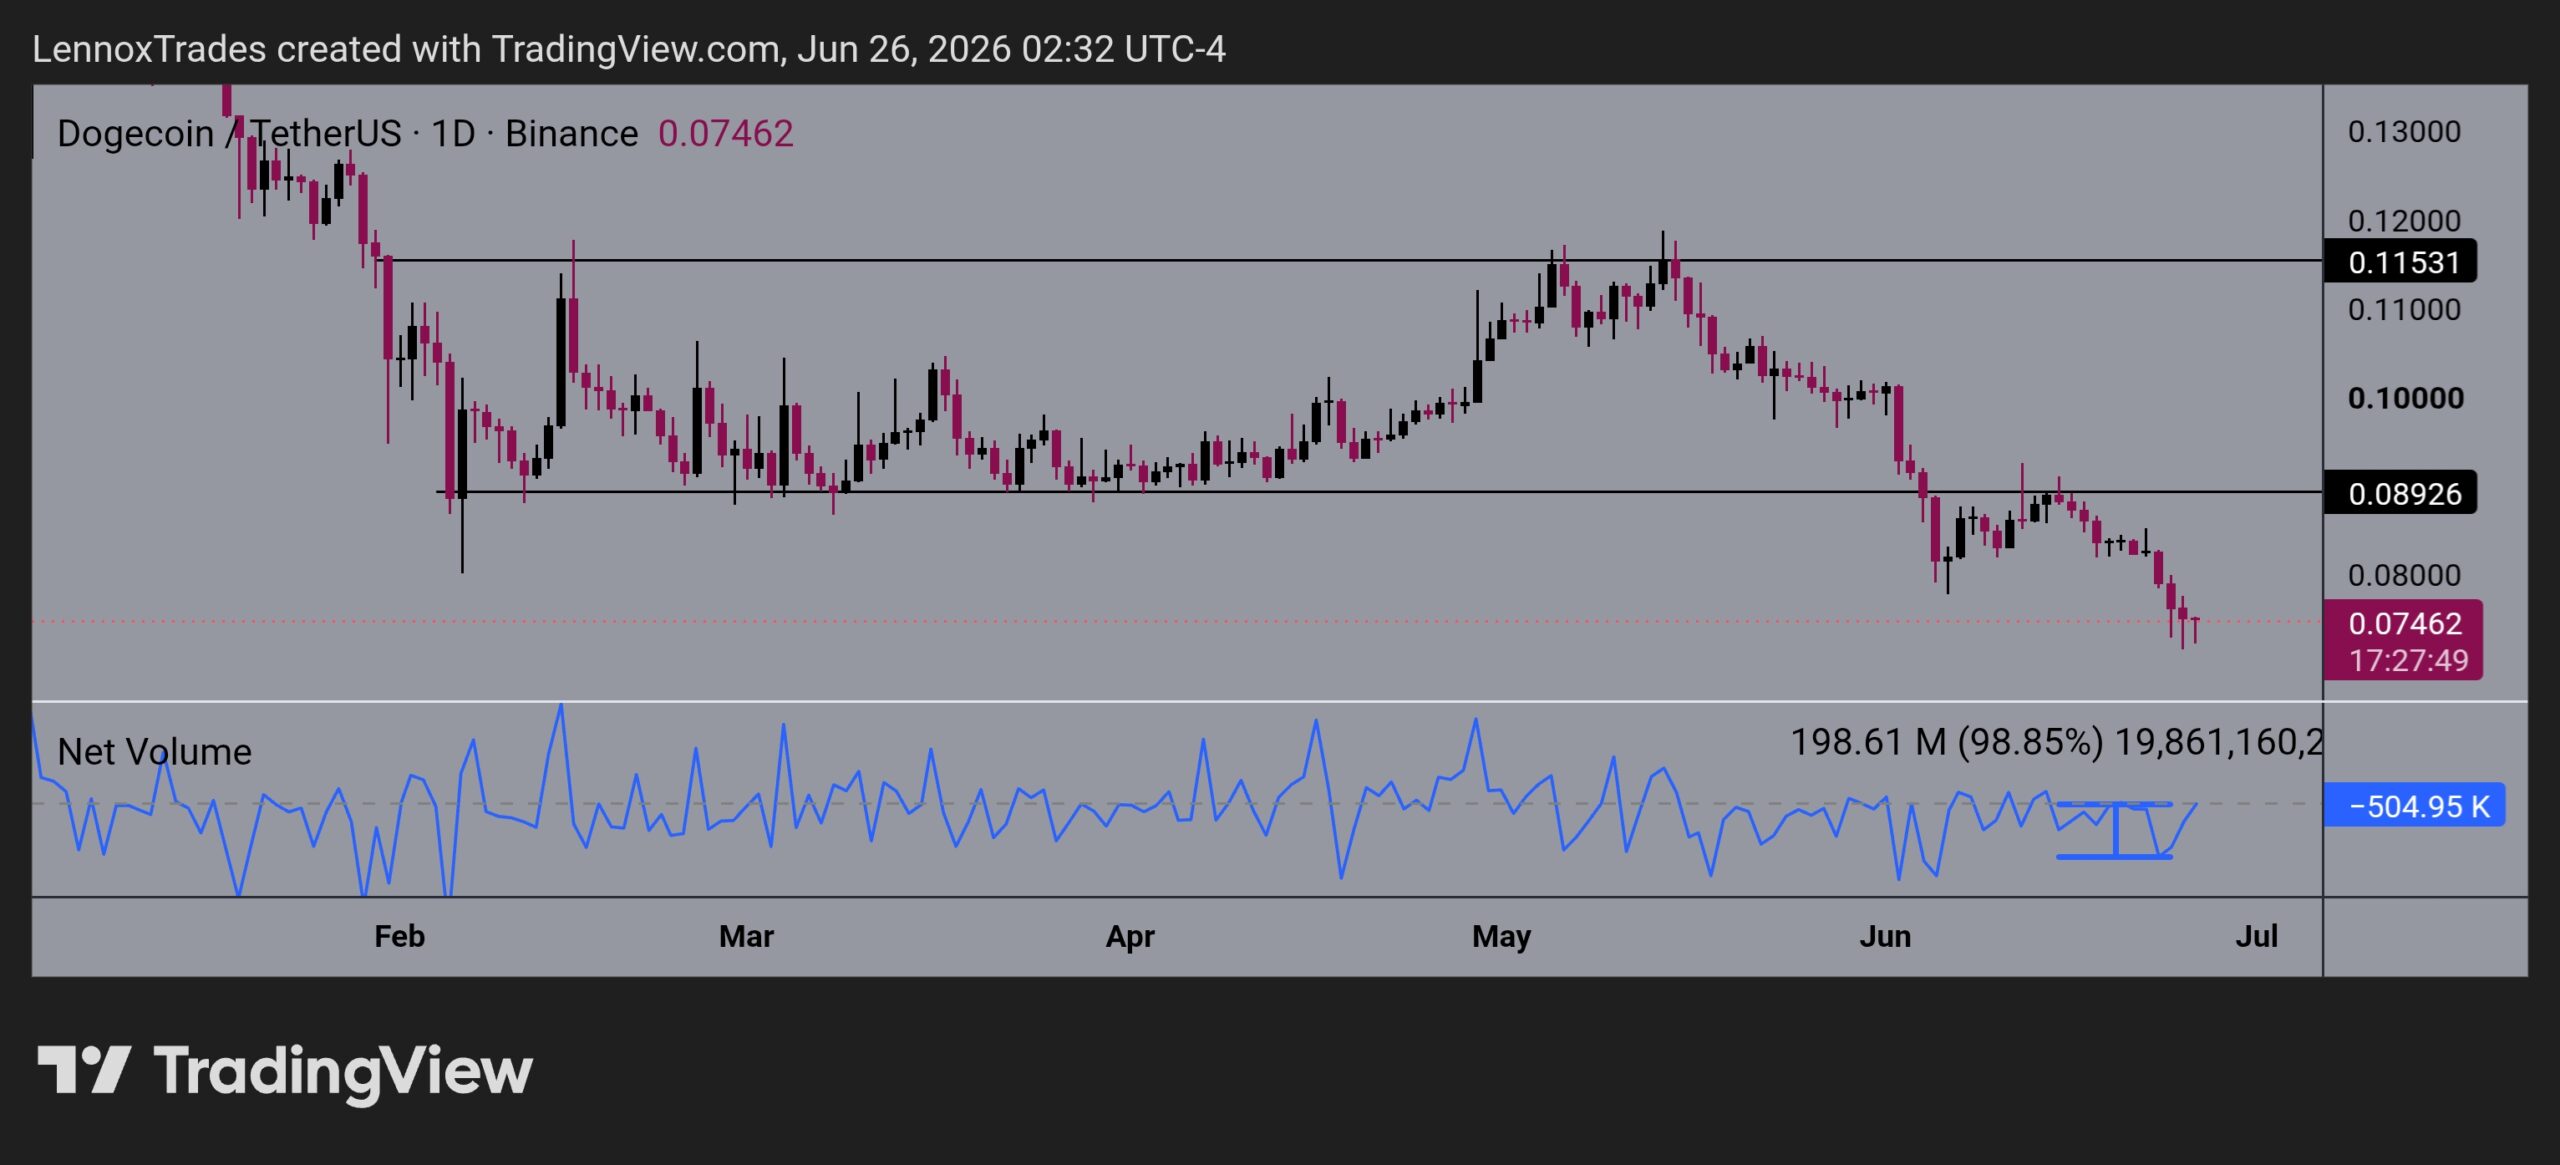
Additionally, the TD Sequential flashed a buy signal as per analysis by Ali Martinez on X. This is a signal that the ongoing downtrend may be about to be paused on the daily chart.
However, there were some factors that needed to be met. That is, the price is holding above $0.073, which puts $0.081 in play. If $0.073 is lost, the setup is no longer valid.
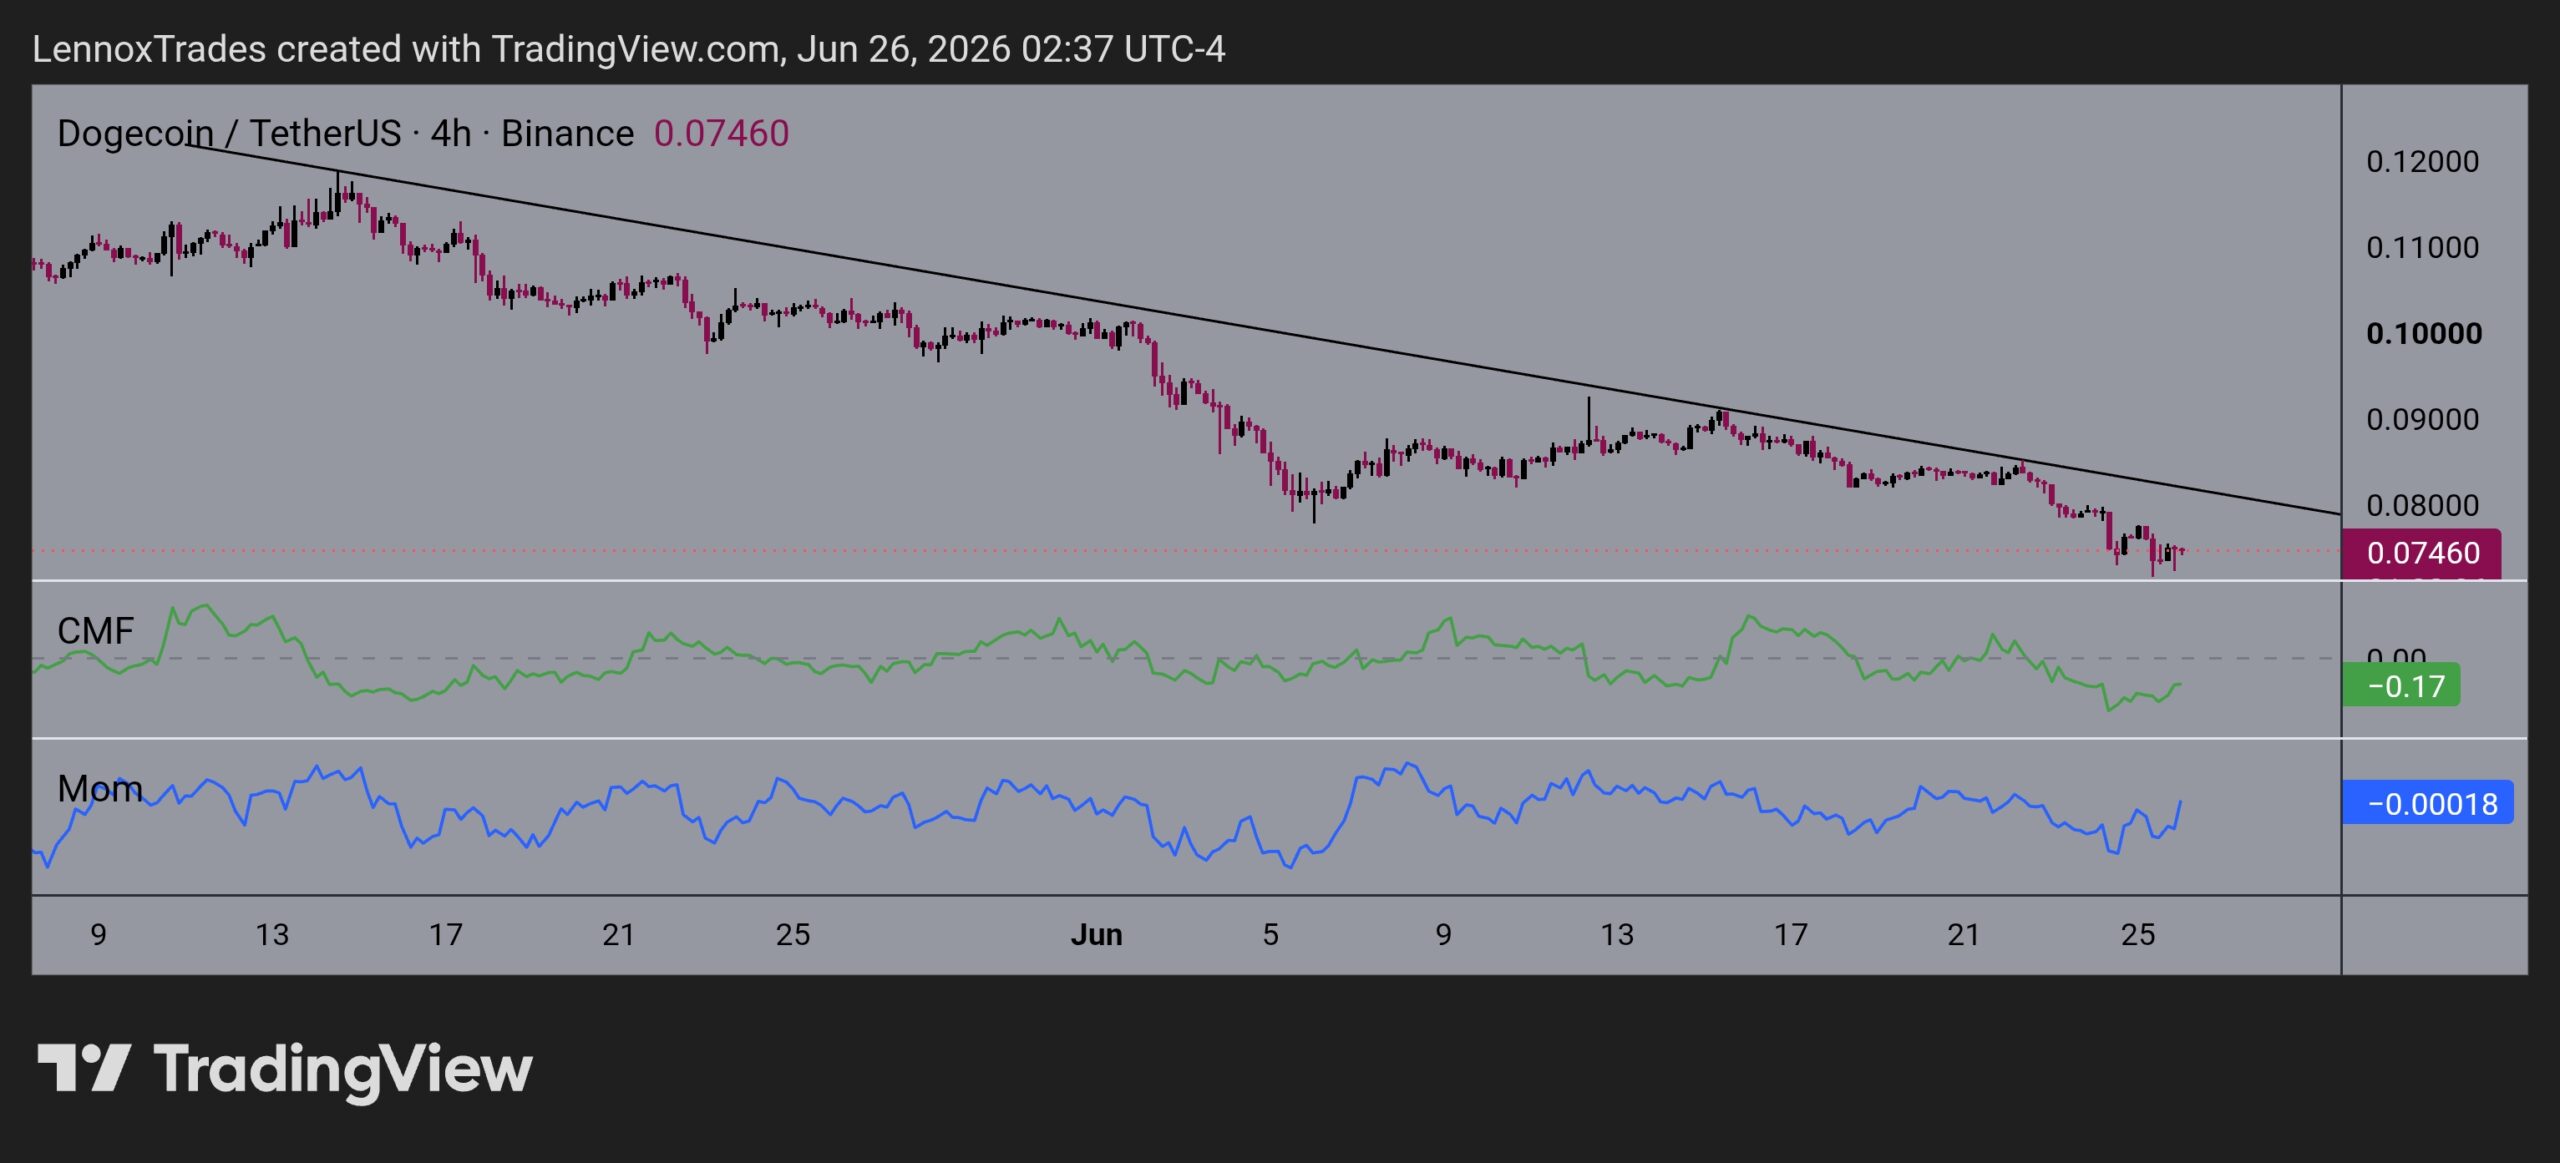
As such, a smaller timeframe strengthened the bear structure. Dogecoin has been consistently respecting a slanting trendline resistance with capital flowing out.
In fact, the Chaikin Money Flow (CMF) was at negative 0.17, with the momentum indicator reading turning to the upside. This indicated bears were stronger than bulls.

Therefore, Dogecoin stays in a bearish market structure, but signals of a potential bullish reversal have emerged. However, DOGE’s path is yet to be defined clearly in the short term as other metrics are showing weakness.
Only two days of inflows for Dogecoin ETFs in a month!
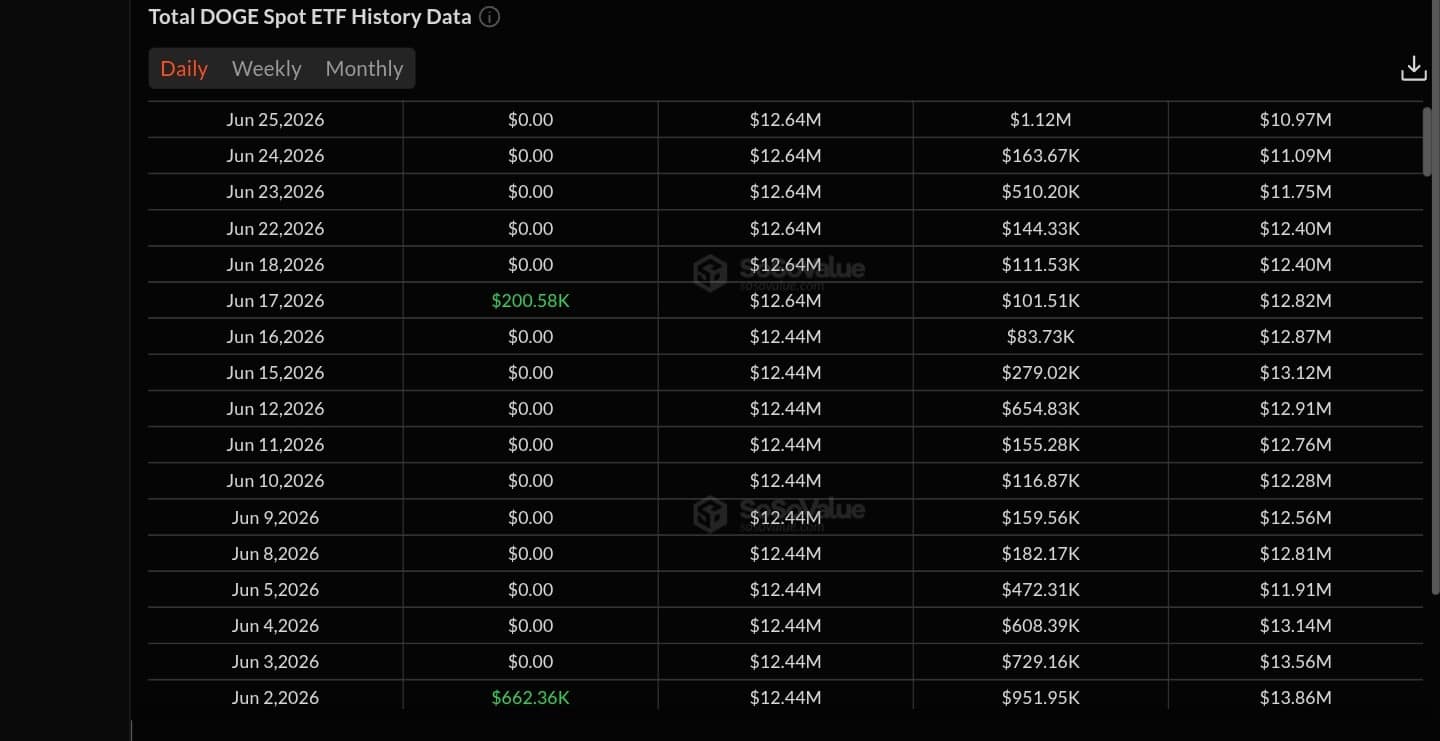
A further look into Dogecoin Spot ETF inflow showed weakness.
Over the past month since the 19th of May, only two days have had positive net inflows for the three ETFs. That is, the 2nd and the 17th of June, where $662K and $200K worth of DOGE were bought.
A total of $863K in inflows in a month while other days stayed quiet affirmed the cruelty seen in the markets since the October 10 crash. It showed demand for DOGE ETFs had collapsed.

This weak ETF capital inflow partially explained why the price of Dogecoin was declining. However, it did not confirm the price would continue falling, but it was a strong signal for that.
Final Summary
- Dogecoin’s market structure shows more decline may be anticipated, but the TD Sequential has flashed a buy signal for a potential bullish reversal.
- Dogecoin ETFs continue to experience zero activity for the most part of the past 30 days, confirming the declining price movement.