¡Nacimiento del caballo negro del viernes en el mundo cripto! ¿BCH se dispara un 7% ocultando un potencial de subida del 65%? Divergencia en tendencias de SUI y LTC aquí

金色财经Pubblicato 2025-12-19Pubblicato ultima volta 2025-12-19

Introduzione

El viernes, el mercado de criptomonedas mostró movimientos significativos con fuertes divergencias entre activos. Bitcoin Cash (BCH) destacó con un aumento del 7%, liderando las ganancias entre los principales criptoactivos. Este impulso se atribuye a la acumulación por parte de ballenas y a la formación de un patrón técnico alcista de doble suelo, que sugiere un potencial de subida del 65% si supera el nivel clave de $622.4. No obstante, es crucial mantener el soporte en $541 para sostener la tendencia. Por otro lado, SUI experimentó una recuperación del 4.5% tras la solicitud de Bitwise para un ETF spot, acelerando el proceso de aprobación regulatoria. La decisión clave de 21Shares se espera para el 21 de diciembre. En contraste, Litecoin (LTC) cayó significativamente, perdiendo el soporte crítico de $80-$84. Aunque podría haber una rebote técnico hacia $82-$83, se considera una oportunidad para posiciones bajistas, con objetivos en $66 y $59. En resumen: BCH presenta oportunidades alcistas si mantiene soportes clave, SUI depende de las noticias de ETF, y LTC sigue en tendencia bajista. Se recomienda monitorizar estos niveles críticos antes de tomar decisiones.

¡Por fin el viernes el mundo cripto no estuvo tan monótono! Algunos subieron abruptamente contra la tendencia como caballos negros, otros se recuperaron con noticias favorables, y algunos siguen cayendo sin parar, esperando un rebote. Únete al grupo +Q:3260353596

¡BCH, el caballo negro! ¿Subida del 7% + doble suelo de años, con un espacio de subida del 65%?

El más destacado del viernes fue sin duda Bitcoin Cash (BCH), ¡subiendo abruptamente más de un 7%, liderando la lista de los 100 principales activos cripto por capitalización de mercado! Esta subida no fue al azar, la razón central es que las ballenas (inversores grandes) comenzaron a aumentar sus posiciones nuevamente, y la fuerza de compra se recuperó.
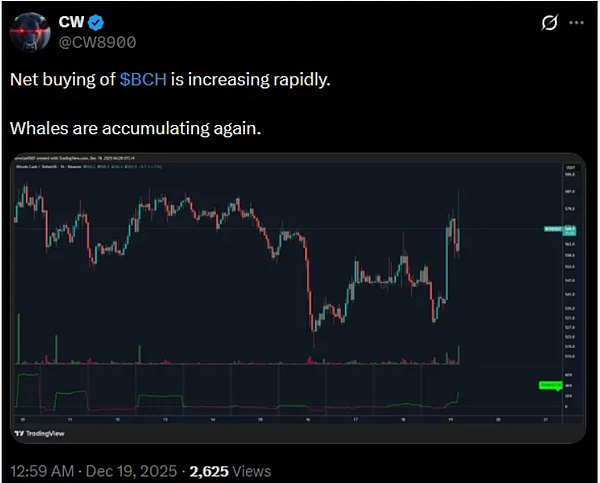
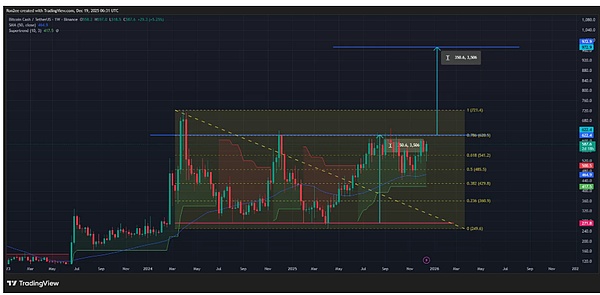
Lo más crucial es que BCH también formó una figura de doble suelo a nivel de varios años: ¡esta es una fuerte señal alcista en el análisis técnico! Según datos de crypto.news, en las últimas 24 horas BCH subió un 7.1%, alcanzando un máximo intradía de 585 dólares, un 28% más que el mínimo de noviembre y un 118% más que el punto más bajo de este año.

Los analistas están observando un nivel clave: la línea de cuello (neckline) en 622.4 dólares. El precio actual de BCH está solo a un 6% de romper este nivel; si logra romperlo y confirmar la figura de doble suelo, es muy probable que suba hasta 972 dólares, ¡lo que equivale a una subida adicional del 65% desde el precio actual!
Además de las ballenas, los operadores de derivados también ayudaron mucho. Los datos de CoinGlass muestran que en las últimas 24 horas, los contratos abiertos de futuros de BCH aumentaron directamente un 20%, alcanzando 766.6 millones de dólares, y la tasa de financiación ponderada cayó a territorio negativo. Si la subida continúa, podría desencadenar un squeeze (compresión) de ventas en corto, momento en el que los shorters serían liquidados y BCH podría subir otra vez.
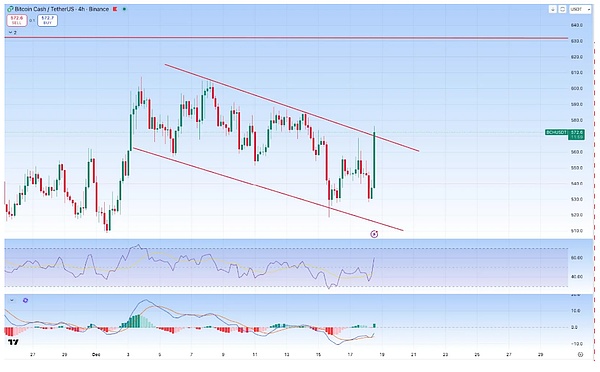
Además, BCH ya ha roto el canal descendente de varias semanas, se ha situado por encima de la media móvil de 50 días, y la supertendencia también se ha vuelto verde, todas son señales claras de que la presión compradora supera a la vendedora. Sin embargo, hay que prestar atención: 541 dólares es un nivel de soporte clave; si no se mantiene, la tendencia podría revertirse de nuevo, no se confíen~

¡SUI se recupera! Bitwise solicita ETF, proceso de aprobación se acelera

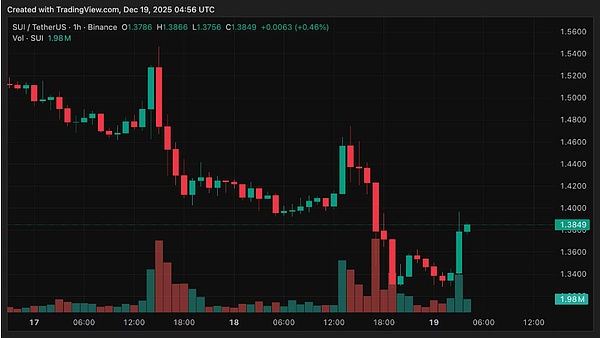
SUI, que había estado cayendo constantemente, finalmente recibió buenas noticias y rebotó. La razón es que la empresa de gestión de activos cripto Bitwise solicitó lanzar un ETF spot del token SUI, y el jueves presentó el formulario S-1 ante la SEC. Únete al grupo +Q:3260353596

Este es el primer paso para la aprobación del ETF; según las nuevas reglas, se espera que todo el proceso de revisión tome solo 75 días, mucho más rápido que el proceso anterior que podía durar hasta 240 días. Y ahora no solo Bitwise, sino también Canary Capital, 21Shares y Grayscale han solicitado ETFs spot de SUI. Entre ellos, el resultado de la solicitud de 21Shares se anunciará antes del 21 de diciembre; si se aprueba, sería el primer ETF spot de SUI en Estados Unidos.

Bajo la influencia de esta noticia favorable, SUI, que había caído durante dos semanas seguidas, rebotó desde el mínimo mensual de 1.33 dólares, y al cierre de esta edición había subido un 4.5%. Además, Bitwise incluyó recientemente a SUI en su ETF índice de 10 criptomonedas. Si podrá seguir subiendo dependerá del progreso de la aprobación del ETF~
¡LTC está agotado! Pierde soporte de 80 dólares, ¿rebote hasta 82? Se sugiere visión bajista

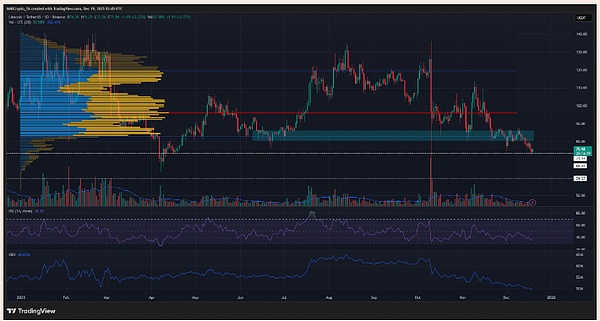
En comparación con BCH y SUI, Litecoin (LTC) lo tuvo un poco peor. Siguiendo la volatilidad de Bitcoin, cayó directamente un 7.5% en 5 horas, marcando un nuevo mínimo de 72.64 dólares, y ahora ronda los 75.89 dólares.

Lo más crucial es que los alcistas (bulls) de LTC perdieron la zona de soporte a largo plazo de 80-84 dólares que habían defendido durante dos semanas, y su poder de lucha es especialmente débil. Incluso siendo incluido en el ETF índice de 10 criptomonedas de Bitwise, el precio no reaccionó mucho. Desde el análisis técnico, la presión de venta no se ha detenido desde la segunda semana de octubre, y el indicador OBV (On-Balance Volume) también muestra que, aunque antes compradores y vendedores podían forcejear, luego fueron directamente aplastados por los vendedores.
Sin embargo, hay una pequeña oportunidad: el mapa de calor de liquidaciones (liquidation heatmap) muestra que la liquidez alrededor de 73 dólares ya se ha agotado, lo que podría generar un rebote breve, con un objetivo alrededor de 82-83 dólares. Pero hay que tener cuidado, esto muy probablemente sea solo un rebote, no un cambio de tendencia (reversión).
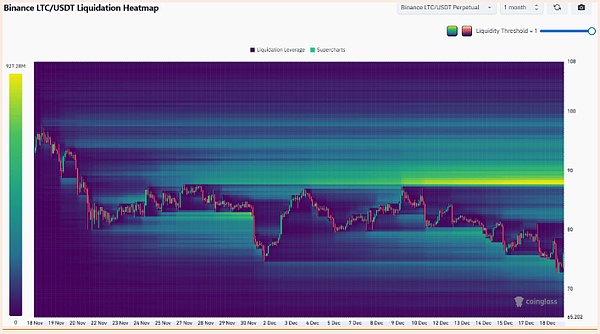
Si posteriormente rebota y prueba el rango de 80-84 dólares, es muy probable que esta zona se convierta en una fuerte resistencia, difícil de superar. Por lo tanto, se sugiere mantener una visión bajista (bearish). Si el rebote llega a ese nivel, se podría considerar vender en corto (short), con un primer objetivo en 66 dólares, y más abajo el nivel de soporte de 59 dólares. Únete al grupo +Q:3260353596

Resumen: En un mercado divergente, enfócate en estas dos señales

1. BCH: Enfócate en la línea de cuello de 622.4 dólares; si la rompe, hay mucho espacio alcista. Considera posiciones largas (comprar) solo si mantiene el soporte de 541 dólares.

2. SUI: Sigue el ritmo de la aprobación del ETF; el resultado de la solicitud de 21Shares antes del 21 de diciembre es clave.

3. LTC: Un rebote muy probablemente es una oportunidad para vender en corto; no te dejes engañar por recuperaciones a corto plazo. Enfócate en la zona de resistencia de 80-84 dólares.

Ahora el mercado está claramente divergente; algunos esconden oportunidades y otros son trampas. Se recomienda no seguir ciegamente la tendencia, y actuar solo después de observar los niveles clave.


Crypto di tendenza

Domande pertinenti

Q¿Qué criptomoneda lideró las ganancias entre los 100 principales activos cripto el viernes y cuál fue su porcentaje de aumento?

ABitcoin Cash (BCH) lideró las ganancias con un aumento del 7%.

Q¿Cuál es el objetivo de precio potencial para BCH si logra romper el nivel de cuello de $622.4, y qué patrón técnico clave está formando?

ASi BCH rompe el nivel de cuello de $622.4, confirmando un patrón de doble suelo, podría alcanzar un objetivo de $972, lo que representa un aumento del 65% desde su precio actual.

Q¿Qué evento importante impulsó la recuperación de SUI y qué empresa presentó una solicitud de ETF para este token?

ALa recuperación de SUI fue impulsada por la solicitud de Bitwise para un ETF spot de SUI, presentada a la SEC.

Q¿Por qué se sugiere mantener una perspectiva bajista para Litecoin (LTC) a pesar de una posible rebote temporal?

ASe sugiere una perspectiva bajista para LTC porque perdió su zona de soporte clave de $80-$84, muestra una presión de venta constante desde octubre y se espera que cualquier rebote encuentre una fuerte resistencia en esa zona, siendo probablemente solo temporal.

Q¿Cuál es la fecha clave para estar atento a la decisión de la solicitud de ETF de SUI de 21Shares?

ALa decisión clave sobre la solicitud de ETF de SUI de 21Shares se espera antes del 21 de diciembre.

Letture associate

Bitcoin’s path to $80K may hinge on THIS hidden trend

Bitcoin's potential path toward $80,000 is influenced by conflicting market signals. Data shows the Coinbase Bitcoin Premium Index has recorded its longest-ever streak of consecutive negative premiums, indicating muted institutional demand or net selling from U.S. institutions. While such a trend often signals short-term weakness, it doesn't necessarily forecast a long-term bear market. Additionally, a bearish crossover occurred in Bitcoin's Net Unrealized Profit/Loss (NUPL), with its short-term average falling below the longer-term average, suggesting declining investor profitability and waning market momentum. Historically, major bear market bottoms saw the 100-day NUPL drop below zero, but this cycle it remains positive, implying either an unprecedented bottom or a further decline is needed. Currently trading around $63,148, Bitcoin has seen weekly gains but remains below its May peak. Technical indicators present a mixed picture: the MACD shows bullish momentum, while the RSI signals bearish pressure. A positive development is the return of inflows to Bitcoin ETFs after eight weeks of outflows. Analysts hold divergent views; some highlight a key liquidity zone between $48,000-$50,000 where a market bottom could form, while others maintain a more optimistic long-term outlook. Ultimately, while some bullish signs exist, a strong push from institutional investors appears crucial for Bitcoin to challenge the $80,000 level.

ambcrypto4 min fa

Bitcoin’s path to $80K may hinge on THIS hidden trend

ambcrypto4 min fa

Unexpected Weak Non-Farm Payrolls Data Pushes BTC to Rebound 11%, FOMC Minutes to Test the Narrative of This Rally

Bitcoin has rebounded 11% from its 21-month low, but the sustainability of this rally hinges entirely on the Federal Reserve's release of the June FOMC meeting minutes. The bounce was triggered by a weaker-than-expected US jobs report, which showed only 57,000 jobs added in June—about half of economists' forecasts. This data prompted traders to scale back bets on further Fed rate hikes, fueling a rally in Bitcoin alongside gold and stocks. The upcoming minutes are critical. They will reveal whether Fed officials, in their mid-June meeting, were already expressing concerns about a weakening labor market, tight credit conditions, or the risks of overtightening—factors that would support the market's recent dovish shift. Conversely, if the discussion focused on persistent inflation and the conditions for more rate hikes, the rally's foundational narrative would crumble. Market indicators show the rebound's fragility. While US spot Bitcoin ETFs saw a significant single-day inflow, it followed a prolonged period of outflows. On-chain data indicates a substantial increase in Bitcoin being moved to exchanges, creating potential sell pressure. Options market positioning suggests key price levels around $60,000 and $62,000 that could either stabilize or accelerate price movement. In essence, Bitcoin's 11% gain is built on speculation about the Fed's private deliberations three weeks ago. The FOMC minutes will replace that speculation with concrete details, and the discrepancy between market expectations and the actual record will determine whether Bitcoin holds above $64,000 or falls back toward $58,000.

marsbit15 min fa

Unexpected Weak Non-Farm Payrolls Data Pushes BTC to Rebound 11%, FOMC Minutes to Test the Narrative of This Rally

marsbit15 min fa

Just Now, The World's First Ultra-High-Frame World Model Was Born, Nvidia Content 0, Racing to 50 FPS

Just Now, Global First Ultra-High-Frame World Model Born, 0% NVIDIA, Speeds to 50 FPS A Chinese team has developed MoWorld, the world's first Flash World Model, achieving real-time interactive inference exceeding 50 FPS. Crucially, it is entirely built on domestic NPUs (National Processing Units), bypassing NVIDIA GPUs. Developed by Moxin Technology in collaboration with Zhejiang University's Pan Yunhe academician team, MoWorld represents a complete, closed-loop system from training and distillation to deployment on domestic computing power. The model tackles the critical industry bottleneck of real-time performance, essential for applications like robotics, gaming, and digital worlds. MoWorld achieves this through a full-stack redesign for NPUs, including a proprietary 3D-annotated data pipeline, system-level optimizations for long-sequence training (up to 2000 frames), and inference optimizations like dynamic mixed-precision quantization. On a Huawei Ascend 910C platform, a 14B MoE parameter model achieves over 50 FPS, reducing typical inference costs by 70% compared to equivalent GPU solutions. This breakthrough lowers the deployment barrier, potentially accelerating the industrialization of world models. Key application areas include gaming/entertainment (offering 6-DoF camera control for immersive exploration), embodied AI/autonomous driving (providing a high-fidelity digital training ground), film pre-visualization, and 3D reconstruction/digital twins due to its strong geometric consistency. MoWorld demonstrates that a full-stack domestic compute ecosystem can support cutting-edge, real-time world models, positioning China at a competitive starting line in defining next-generation spatial intelligence standards. The project underscores a shift in competition from model scale to real-world usability and cost-effective deployment.

marsbit52 min fa

Just Now, The World's First Ultra-High-Frame World Model Was Born, Nvidia Content 0, Racing to 50 FPS

marsbit52 min fa

Pacific 'Fever': How Extreme Weather Becomes Wall Street's Cash Machine?

"Pacific Fever": How Extreme Weather Becomes Wall Street's ATM? The summer of 2026 sees unusually fierce weather across China and globally. The common driver behind this global pattern is a powerful El Niño event, potentially the strongest since 1950, as declared by NOAA. This phenomenon, characterized by warming central/eastern Pacific waters, disrupts global atmospheric circulation, raising risks of floods, droughts, and heatwaves, further intensified by climate change. For financial markets, especially commodities, El Niño is not just weather but a major trading theme. History shows its price impact is profound. In the 1970s, El Niño-driven anchovy collapse in Peru fueled a soybean boom, giving Richard Dennis his first million. Anthony Ward's cocoa empire was built on superior weather intelligence. Most recently in 2024, West African droughts caused cocoa prices to soar over 400%, delivering huge gains for trend-following hedge funds. In 2026, markets are again pricing in future El Niño-induced supply shocks. Despite high current inventories, prices for palm oil, rubber, and sugar have rallied on anticipation of upcoming Southeast Asian droughts and weak Indian monsoons. Analysts identify key indicators to watch: the Niño3.4 index, Indian monsoon rainfall, Malaysian palm oil stocks, and the fundraising scale of specialized weather funds like Moreton Capital. Beyond trading opportunities, a concerning narrative is gaining traction online, linking El Niño with fertilizer shortages and energy supply disruptions to warn of potential global food crises within months. While alarmist, it highlights a deeper truth: the cascading effects of climate-driven weather extremes ultimately translate into higher costs of living for everyone, far beyond the trading floor.

marsbit56 min fa

Pacific 'Fever': How Extreme Weather Becomes Wall Street's Cash Machine?

marsbit56 min fa

Pacific 'Fever': How Extreme Weather Becomes Wall Street's ATM?

"Pacific 'Fever': How Extreme Weather Becomes Wall Street's Piggy Bank" The article examines how the 2026-2027 El Niño, potentially the strongest since 1950, is not only disrupting global weather but also creating major financial opportunities. It links recent extreme events in China and worldwide to this climate phenomenon, which alters atmospheric patterns, increasing risks of floods, droughts, and heatwaves. The core narrative explores how financial markets capitalize on these disruptions. A hedge fund is raising $500 million specifically to bet on El Niño-affected crops like South African corn and Malaysian palm oil. Historically, such strategies have yielded massive profits. Examples include Richard Dennis ("Turtle Trader") making his first fortune in the 1970s soy boom triggered by El Niño's impact on Peruvian anchovies (a key fishmeal source), and Anthony Ward's cocoa empire built on superior weather intelligence. The 2024 cocoa price surge, driven by West African drought, enriched quantitative trend-following funds. Currently, markets are preemptively bidding up palm oil, rubber, and sugar futures based on anticipated future supply shocks, despite high current inventories. The article details El Niño's asymmetric global impacts: causing drought in Southeast Asia (hurting palm oil/rubber) and India (affecting sugar/cotton), but bringing beneficial rains to South American soy and sugarcane. Key metrics to watch include the Niño3.4 index, Indian monsoon data, and Malaysian palm oil stocks. The true price effects often materialize *after* the El Niño peaks, suggesting 2027 may see the real volatility. The conclusion warns that beyond trading gains, the convergence of El Niño, energy shortages, and fertilizer scarcity poses a systemic risk, potentially raising the cost of living for everyone, turning a climate event into a global economic story.

链捕手1 h fa

Pacific 'Fever': How Extreme Weather Becomes Wall Street's ATM?

链捕手1 h fa

Trading

Spot

Articoli Popolari

Come comprare BCH

Benvenuto in HTX.com! Abbiamo reso l'acquisto di Bitcoin Cash (BCH) semplice e conveniente. Segui la nostra guida passo passo per intraprendere il tuo viaggio nel mondo delle criptovalute.Step 1: Crea il tuo Account HTXUsa la tua email o numero di telefono per registrarti il tuo account gratuito su HTX. Vivi un'esperienza facile e sblocca tutte le funzionalità,Crea il mio accountStep 2: Vai in Acquista crypto e seleziona il tuo metodo di pagamentoCarta di credito/debito: utilizza la tua Visa o Mastercard per acquistare immediatamente Bitcoin CashBCH.Bilancio: Usa i fondi dal bilancio del tuo account HTX per fare trading senza problemi.Terze parti: abbiamo aggiunto metodi di pagamento molto utilizzati come Google Pay e Apple Pay per maggiore comodità.P2P: Fai trading direttamente con altri utenti HTX.Over-the-Counter (OTC): Offriamo servizi su misura e tassi di cambio competitivi per i trader.Step 3: Conserva Bitcoin Cash (BCH)Dopo aver acquistato Bitcoin Cash (BCH), conserva nel tuo account HTX. In alternativa, puoi inviare tramite trasferimento blockchain o scambiare per altre criptovalute.Step 4: Scambia Bitcoin Cash (BCH)Scambia facilmente Bitcoin Cash (BCH) nel mercato spot di HTX. Accedi al tuo account, seleziona la tua coppia di trading, esegui le tue operazioni e monitora in tempo reale. Offriamo un'esperienza user-friendly sia per chi ha appena iniziato che per i trader più esperti.

609 Totale visualizzazioniPubblicato il 2024.12.11Aggiornato il 2026.06.02

Come comprare BCH

Discussioni

Benvenuto nella Community HTX. Qui puoi rimanere informato sugli ultimi sviluppi della piattaforma e accedere ad approfondimenti esperti sul mercato. Le opinioni degli utenti sul prezzo di BCH BCH sono presentate come di seguito.

活动图片