Expanding Glassnode: Macro and Traditional Finance Data

insights.glassnodeDipublikasikan tanggal 2026-04-16Terakhir diperbarui pada 2026-04-16

Abstrak

Glassnode is expanding its product offering to include macroeconomic and traditional finance (TradFi) data, recognizing that digital assets like Bitcoin are now a mainstream asset class increasingly influenced by global financial forces. As institutional participation grows—evidenced by Bitcoin ETFs surpassing $100 billion in AUM by early 2026—Bitcoin's price is more affected by monetary policy, geopolitical risks, and macroeconomic trends. Key metrics now integrated include central bank balance sheets, money supply (M2), interest rates, and government bond yields, which help contextualize Bitcoin within global liquidity cycles. The platform also tracks equity indices, fear gauges, forex rates, and commodities to assess risk appetite and market stress. This shift reflects a structural change: Bitcoin's correlation with traditional risk assets like the S&P 500 has strengthened, driven by institutional capital, post-COVID liquidity cycles, and ETF adoption. Glassnode aims to provide a unified platform for analyzing both on-chain and TradFi data, enabling users to better interpret market moves and regime shifts in a maturing digital asset ecosystem.

Our guiding principle in developing Glassnode's product offering has always been about enabling a comprehensive view of digital asset markets. This has meant delivering industry-leading on-chain and derivatives analytics, while also helping investors interpret the broader forces shaping market behavior.

As digital assets mature, these forces increasingly extend beyond on-chain data. Today, we are further expanding our product to reflect this ongoing shift. Glassnode now integrates macroeconomic and traditional finance (TradFi) data, bringing everything you need to understand Bitcoin and digital assets into a single platform.

Why Macro Now Matters More Than Ever

Digital assets are no longer a niche experiment. They are a mainstream asset class, with growing participation from institutions, ETFs, and traditional finance players. The recent approval and rapid growth of Bitcoin ETFs – now exceeding $100 billion in assets under management as of early 2026 – is a clear signal of this shift.

But with this integration comes a new dynamic: Bitcoin’s price is increasingly influenced by traditional financial forces. Geopolitical risks, monetary policy, and broader macroeconomic trends now play a critical role in shaping Bitcoin’s trajectory. For investors, traders, and institutions, this makes access to a broader set of actionable data more important than ever.

That is why Glassnode is expanding its data coverage to include TradFi and macro metrics. The goal is not to move beyond on-chain analysis, but to extend it — enabling users to connect the dots between digital asset markets, traditional financial data and the global economy.

From Digital Gold to Liquidity-Sensitive Asset

Bitcoin was created in the immediate aftermath of the Global Financial Crisis in 2009, as a direct response to what its creator saw as a fundamental flaw of modern finance: the ability of central banks and governments to create money at will. Bitcoin's fixed supply of 21 million coins is not just a technical detail; it is a political statement.

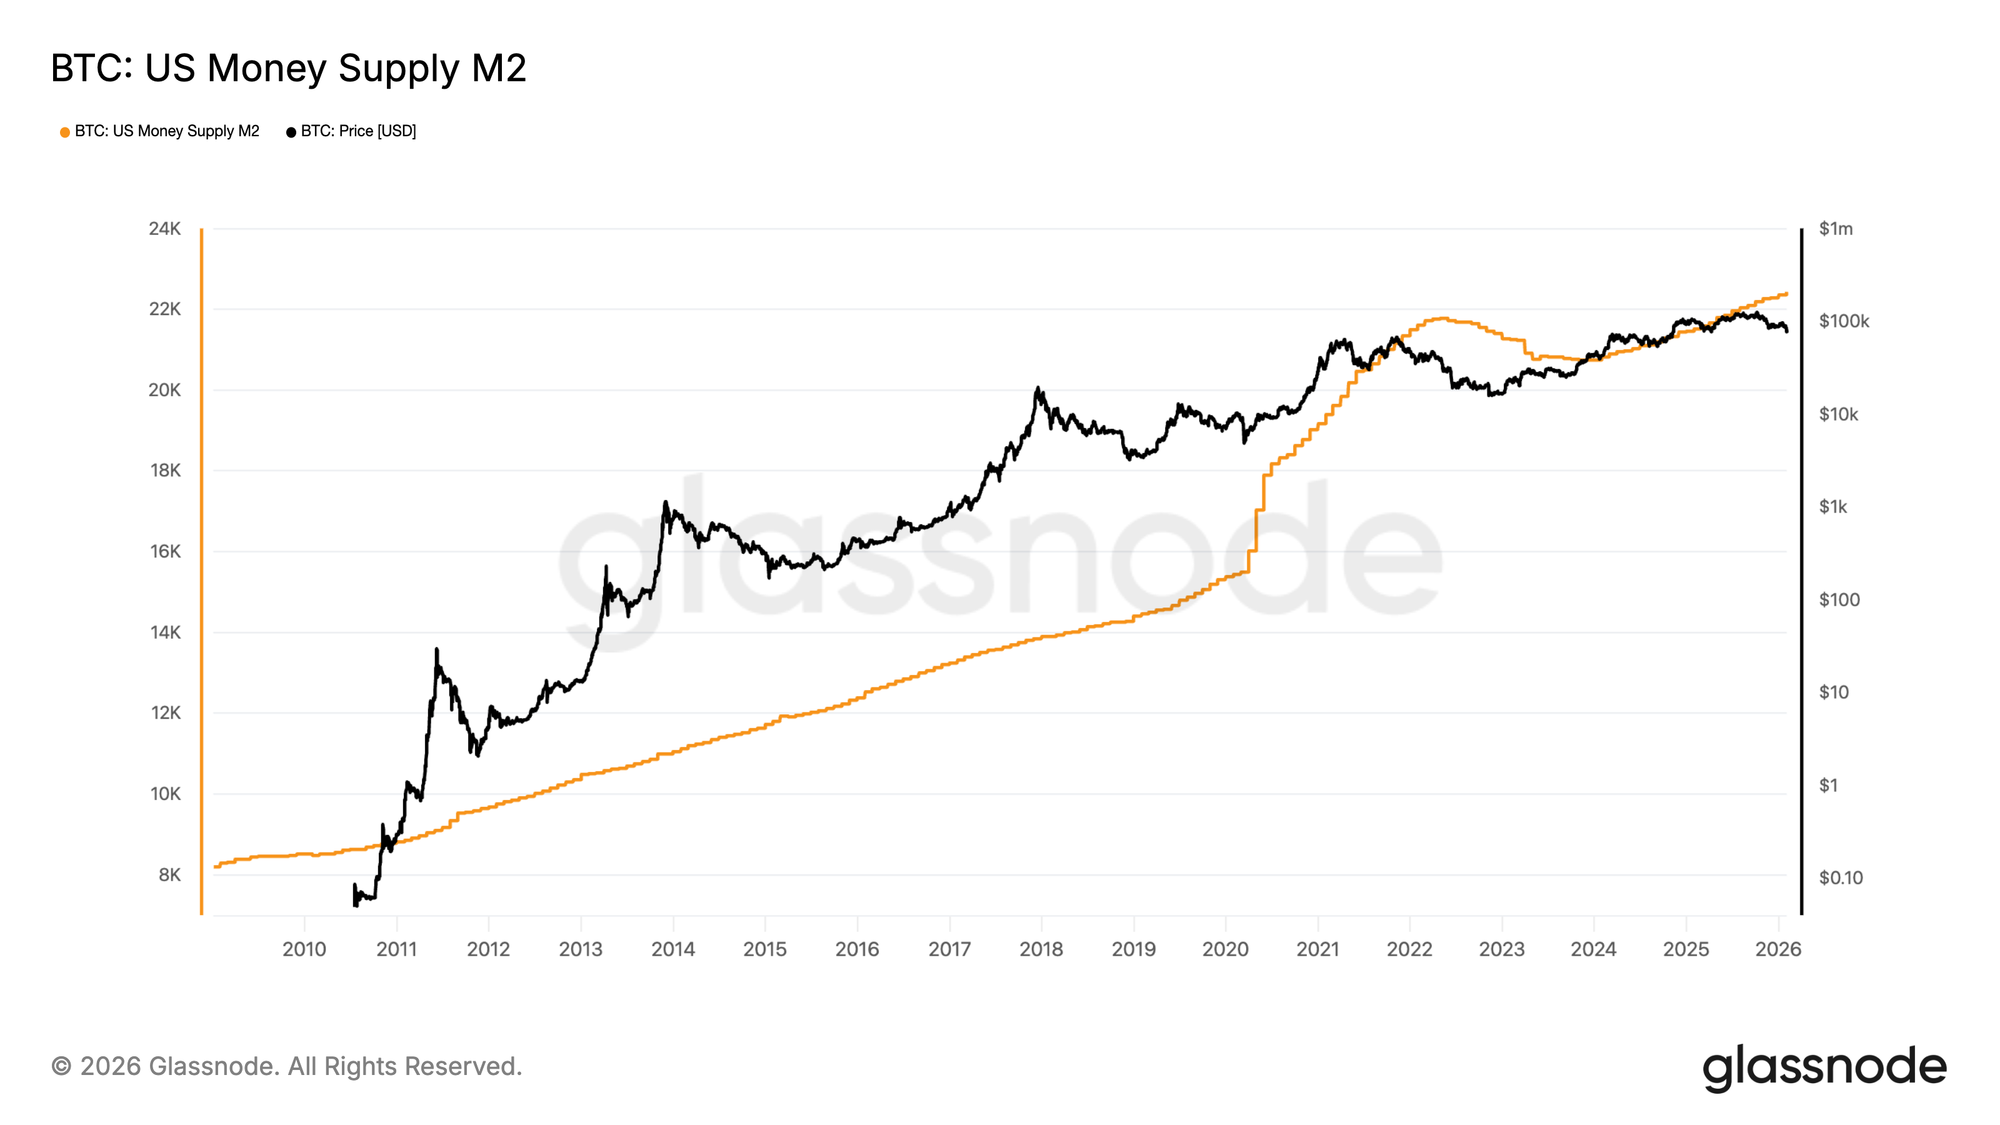
This aspect becomes most relevant when central banks are most active. When central banks expand their balance sheets, money supply grows, financial conditions become more supportive, and investors generally have more capital available to allocate across risk assets. In that environment, Bitcoin has often benefited alongside other liquidity-sensitive assets.

By contrast, periods of monetary tightening tend to create a more difficult backdrop. Higher rates, shrinking central bank balance sheets, and weaker liquidity conditions typically reduce risk appetite and can weigh on digital asset markets.

This is why it is useful to monitor metrics such as:

  • US Money Supply (M2)
  • US Central Bank Balance Sheet
  • Euro Area Money Supply (M2)
  • Euro Area Central Bank Balance Sheet

They help place Bitcoin price action in the broader context of global liquidity cycles and provide a clearer macro framework for interpreting market moves.
View live chart

From Dovish to Hawkish: How Interest Rate Shifts Impact Bitcoin

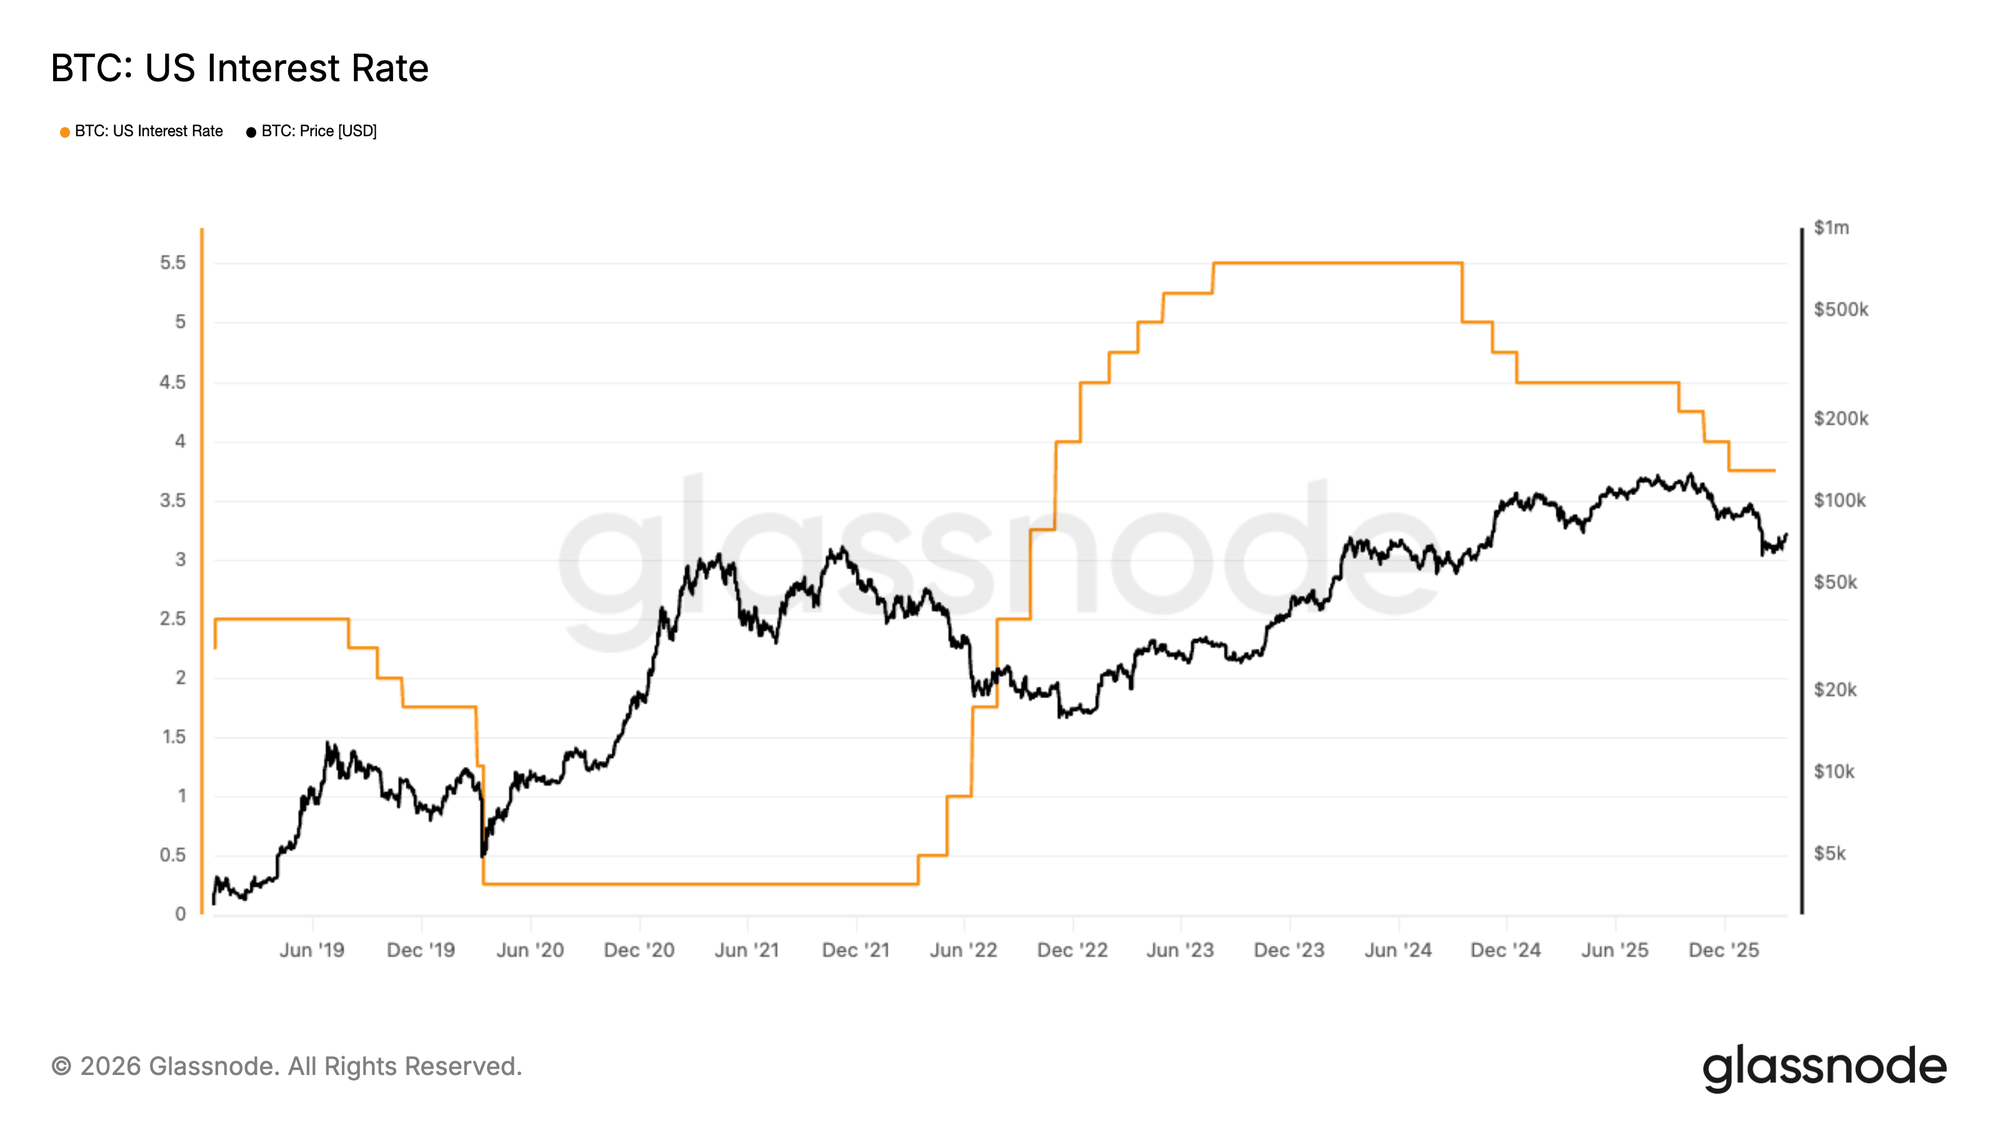
Interest rates are another key transmission channel. Bitcoin does not generate cash flow, so the opportunity cost of holding it changes meaningfully with monetary policy. In tighter regimes, higher rates tend to support the dollar, raise real yields, and reduce appetite for speculative assets. In looser regimes, easier financial conditions can support broader risk-taking. This is why metrics such as US Interest Rate, Euro Area Interest Rate, US 10Y Yield, and Germany 10Y Yield are relevant to digital asset investors, not just bond traders.

As illustrated above, periods of low interest rates tend to support Bitcoin and other risk assets, as cheaper capital and looser financial conditions encourage risk-taking. Conversely, rising interest rates increase the cost of capital and typically reduce investor appetite for risk, creating a more challenging environment for Bitcoin price performance.
View live chart

Traditional Finance Data in Digital Assets

As digital asset markets mature, they are becoming increasingly connected to the same macro forces that move equities, bonds, FX, and commodities. Bitcoin now trades in an environment shaped by interest rates, liquidity conditions, dollar strength, inflation expectations, and risk sentiment.

As a result, understanding digital asset markets requires more than on-chain data alone. By adding TradFi metrics, Glassnode gives users the context needed to interpret market moves, identify regime shifts, and assess whether a move is digital asset-specific or part of a broader cross-asset trend.
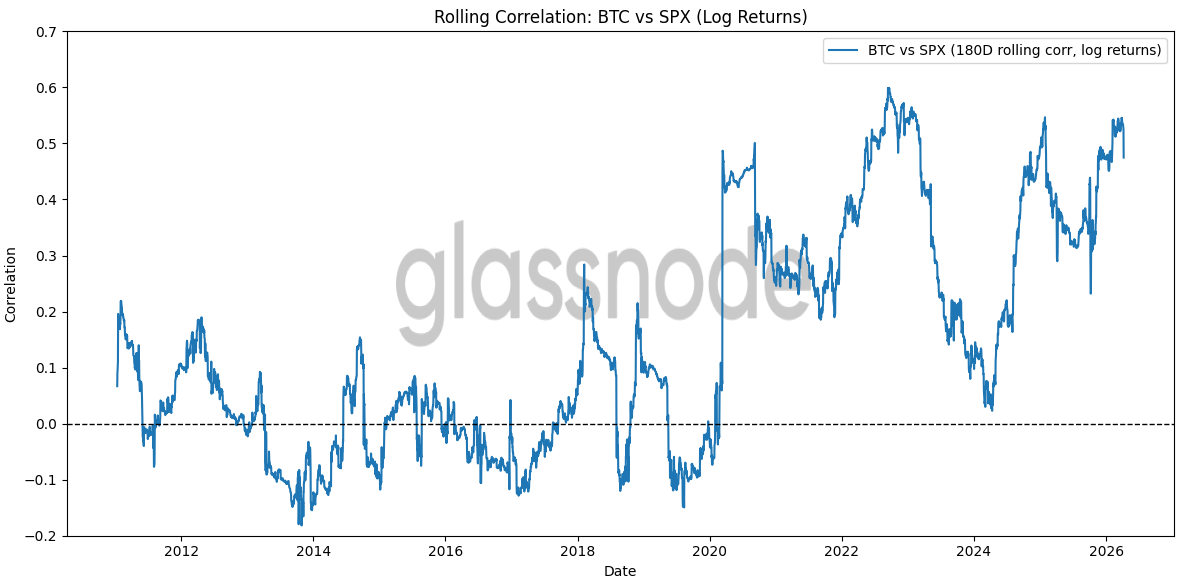
The chart above plots the 180-day rolling correlation between Bitcoin and the S&P 500 using log returns. The main signal is that BTC appears to have become more sensitive to macro and broader risk-asset dynamics over time. In earlier years, the correlation hovered around zero or was occasionally negative, while in recent years it has often been meaningfully positive.

This does not appear to be a temporary dislocation, but a structural shift, driven by three forces:

  • the entry of institutional capital that allocates across asset classes;
  • the post-COVID liquidity cycle, which inflated and then deflated risk assets simultaneously;
  • and the launch of spot Bitcoin ETFs, which embed BTC more directly into traditional portfolio flows.

This supports the view that Bitcoin is no longer solely a standalone, crypto-native asset; it now trades alongside broader liquidity and risk conditions more frequently than in the past.
View live chart

Using TradFi Metrics to Contextualize Digital Asset Markets

Glassnode's TradFi market metrics suite helps users understand the external forces that increasingly influence digital asset markets.

Rate and yield curve indicators provide insight into monetary policy, growth expectations, and recession risk. Relevant metrics: The US 10Y-2Y Spread, Germany 10Y-2Y Spread, US 2Y Yield, US 10Y Yield, Germany 2Y Yield, and Germany 10Y Yield.

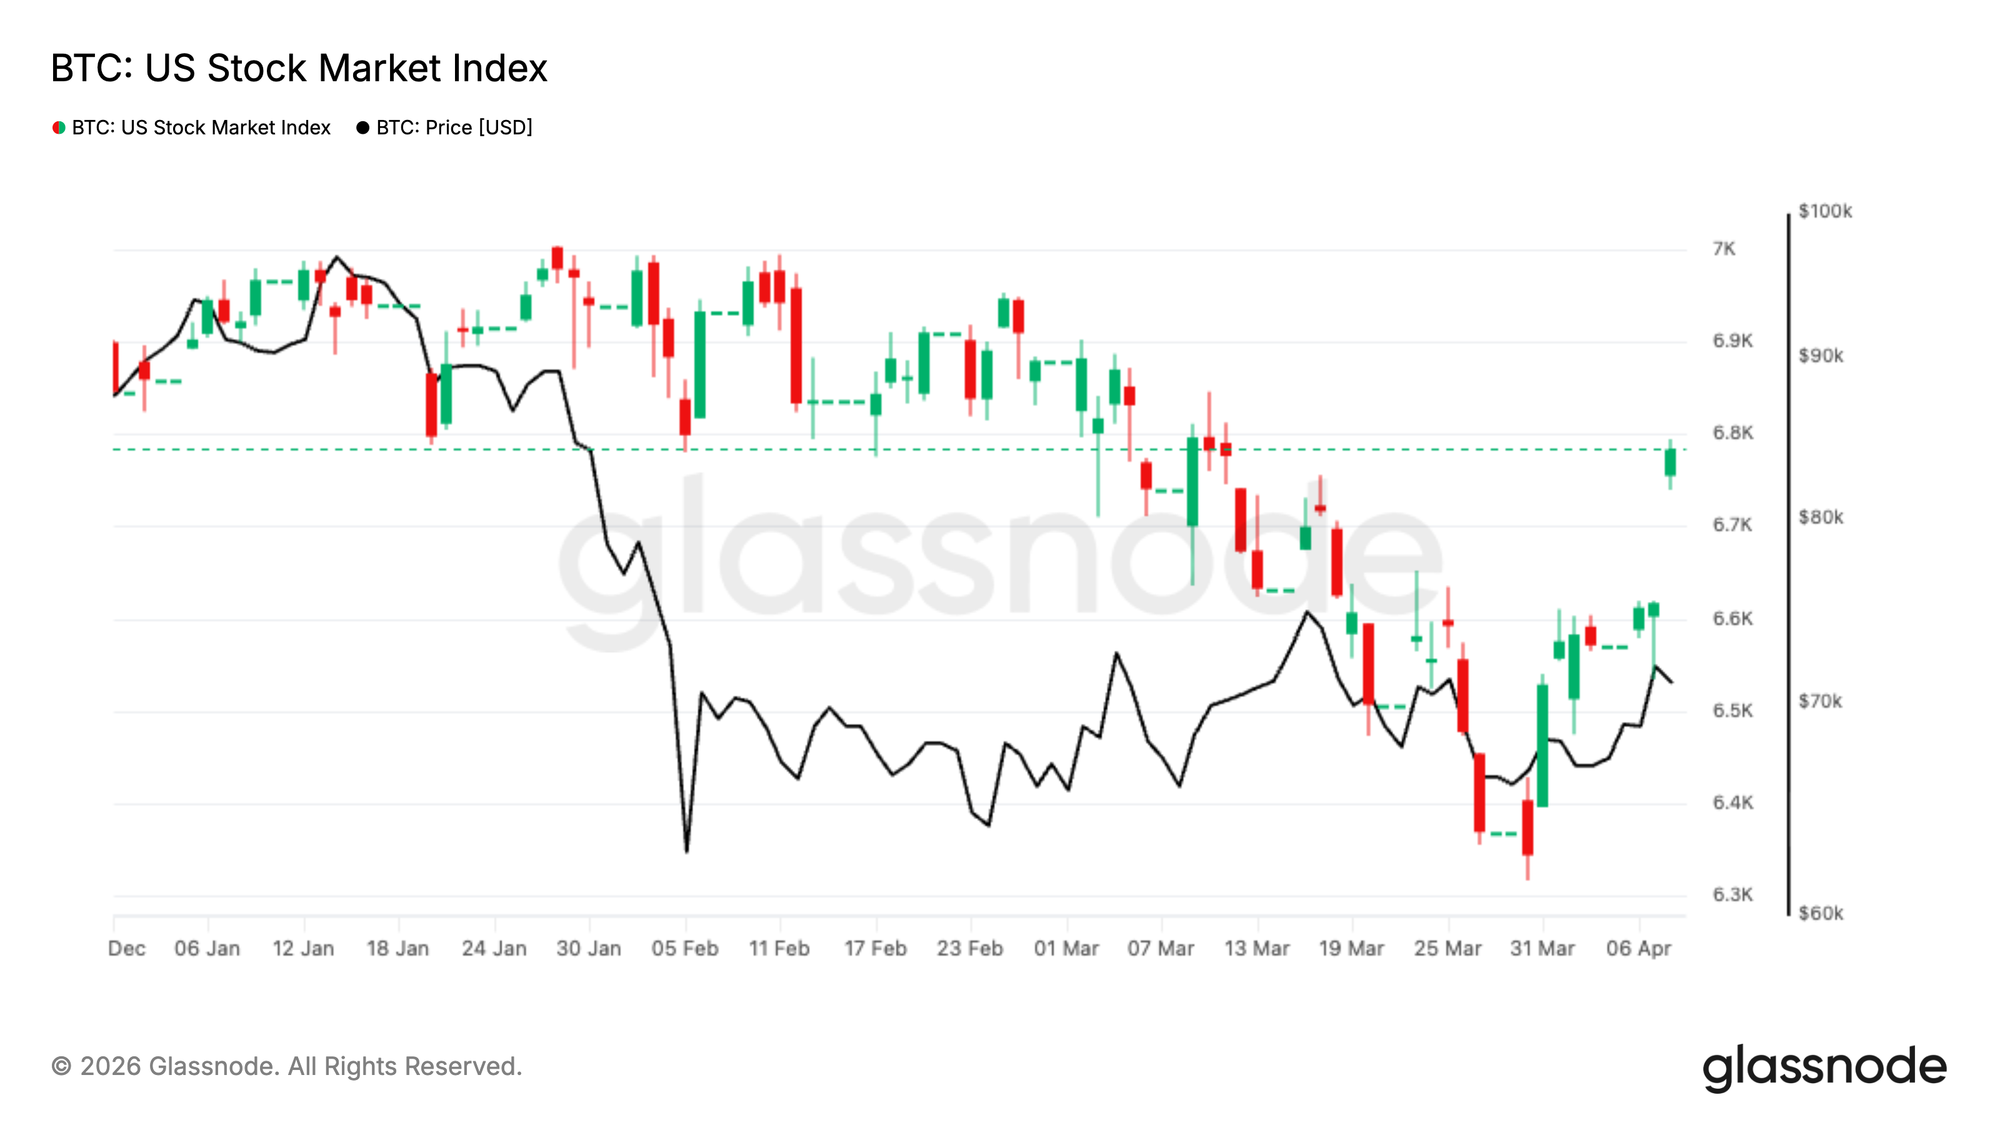
Equity benchmarks help gauge global risk appetite and market stress. Relevant metrics: The US 500 Stock Market Index and EU50 Stock Market Index, along with the US Fear Index and EU Fear Index

FX measures provide context on dollar strength and liquidity conditions, both of which can materially affect digital asset performance. Relevant metrics: EUR/USD and the U.S. Dollar Index

Commodity prices, including Gold, Silver, and WTI Crude Oil, add another layer by reflecting inflation expectations, safe-haven demand, and geopolitical risk.

One Platform, Full Market Context

The broader point is that digital asset markets are maturing. The arrival of spot ETFs, growing institutional participation, and stronger links to policy and geopolitics mean that digital assets increasingly sit within the same information ecosystem as equities, bonds, FX, and commodities. Glassnode’s Macro and TradFi metric categories are built for this environment.

Glassnode remains the home for deep digital asset-native intelligence. At the same time, delivering a comprehensive analytical view of the markets now requires tools to understand the macro and traditional financial forces that shape them.

Explore the new Macro and TradFi metrics in Glassnode Studio or compare pricing plans to gain access.

Compare plans

  • Follow us on X for timely market updates and analysis
  • Join our Telegram channel for regular market insights
  • For on-chain metrics, dashboards, and alerts, visit Glassnode Studio

Disclaimer: This report is for informational and educational purposes only. The analysis represents a limited case study with significant constraints and should not be interpreted as investment advice or definitive trading signals. Past performance patterns do not guarantee future results. Always conduct thorough due diligence and consider multiple factors before making investment decisions.


Pertanyaan Terkait

QWhat is the main reason Glassnode is expanding its product to include macroeconomic and traditional finance (TradFi) data?

ABecause digital assets have matured into a mainstream asset class and Bitcoin's price is increasingly influenced by traditional financial forces like geopolitical risks, monetary policy, and macroeconomic trends, making access to a broader set of actionable data more important than ever.

QAccording to the article, how do periods of monetary tightening by central banks typically affect Bitcoin?

APeriods of monetary tightening, characterized by higher interest rates, shrinking central bank balance sheets, and weaker liquidity conditions, tend to reduce risk appetite and create a more difficult backdrop that can weigh on digital asset markets like Bitcoin.

QWhat are two specific examples of macroeconomic metrics mentioned that help contextualize Bitcoin's price action within global liquidity cycles?

ATwo examples are the US Money Supply (M2) and the US Central Bank Balance Sheet. The article also mentions Euro Area equivalents of these metrics.

QThe article states that Bitcoin's correlation with the S&P 500 has changed over time. What is the described trend and what are the three driving forces behind this structural shift?

AThe trend is that Bitcoin's correlation with the S&P 500 has shifted from hovering around zero or being negative in earlier years to being meaningfully positive in recent years. The three driving forces are: 1) the entry of institutional capital that allocates across asset classes, 2) the post-COVID liquidity cycle, and 3) the launch of spot Bitcoin ETFs.

QBesides on-chain data, what four categories of TradFi metrics does Glassnode now provide to help users understand the external forces influencing digital asset markets?

AThe four categories are: 1) Rate and yield curve indicators, 2) Equity benchmarks, 3) FX measures, and 4) Commodity prices.

Bacaan Terkait

"Gergaji Musim Panas" Berlanjut: Breakout $67.000 Akan Menjadi Awal Kenaikan Bitcoin

Harga Bitcoin terus terkonsolidasi dalam kisaran $58.000–$67.000 sejak awal Juni, dengan harga terkini di sekitar $62.217 pada 1 Agustus. Para analis pasar mempertimbangkan beberapa skenario kunci. Secara teknis, pergerakan di atas $66.000 dianggap penting untuk mengubah momentum. Beberapa trader seperti Crypto Candy memprediksi kemungkinan penurunan menuju $60.000 jika level $66.000 tidak tertembus. Trader lain, Jelle, menggambarkan situasi ini sebagai "gergaji musim panas" yang berkepanjangan dan mempertahankan strategi rata-rata biaya dengan pembelian berkala. Di sisi lain, skenario breakout ke atas tetap ada. Daan Crypto Trades menekankan bahwa keberhasilan menembus $67.000 sangat penting untuk menghindari fase konsolidasi yang berlarut-larut. Roman bahkan memperkirakan bahwa breakout dengan volume yang kuat dapat mendorong harga dengan cepat ke zona $70.000–$80.000. Dari perspektif jangka panjang, analis Gert van Lagen melihat fase ini sebagai periode akumulasi, dengan Bitcoin menguji pola grafik besar "cangkir dengan pegangan". Dia mencatat bahwa pemegang jangka panjang masih enggan menjual, yang ditunjukkan oleh metrik NUPL mereka yang masih jauh dari zona kapitulasi. Kesimpulannya, pasar Bitcoin saat ini berada dalam fase akumulasi yang menentukan. Level $60.000 dan $67.000 menjadi kunci, dan breakout dari level mana pun kemungkinan akan menentukan arah tren berikutnya. Skenario AI dalam artikel juga mempertanyakan apakah konsolidasi saat ini dapat membentuk fondasi yang lebih kuat, atau apakah setiap ujian di level $67.000 akan terus menghadapi hambatan psikologis yang sama dari pemegang aset jangka pendek.

cryptonews.ru56m yang lalu

"Gergaji Musim Panas" Berlanjut: Breakout $67.000 Akan Menjadi Awal Kenaikan Bitcoin

cryptonews.ru56m yang lalu

Perhatian Wajib Pekan Depan|Undang-Undang CLARITY Diperkirakan Akan Masuk ke Pemungutan Suara Senat; SpaceX dan Circle Umumkan Laporan Keuangan (3-9 Agustus)

**Ringkasan Acara Penting Pekan Depan (3-9 Agustus)** Pekan depan diwarnai sejumlah pengumuman keuangan penting dan perkembangan regulasi kripto di AS. **Laporan Keuangan & Acara Perusahaan:** * **SpaceX** akan merilis laporan keuangan Q2 2026 pada 4 Agustus, diikuti gelombang pencairan saham internal pertama (hingga 12%) pada 6 Agustus. * **Circle** (penerbit USDC) dan **Hut 8** (penambang Bitcoin) masing-masing akan mengumumkan laporan kuartalan pada 5 Agustus dan 4 Agustus. * **American Bitcoin (ABTC)**, perusahaan tambang kripto yang dikaitkan dengan keluarga Trump, merilis laporan Q2 pada 3 Agustus. * Perusahaan robotika **宇树科技 (Unitree Robotics)** akan melakukan penawaran saham perdana (IPO) di pasar STAR China, dengan hari penentuan harga awal pada 5 Agustus. **Regulasi Kripto AS:** * **CLARITY Act**, undang-undang kerangka kerja federal untuk aset kripto, berpeluang dilakukan pemungutan suara penuh di Senat AS minggu ini. Para negosiator harus merampungkan aturan tentang konflik kepentingan sebelum masa reses 7 Agustus. RUU ini memerlukan 60 suara untuk disetujui. **Pengumuman Data & Teknologi:** * **Laporan Non-Farm AS** untuk Juli akan dirilis pada 7 Agustus, menjadi fokus pasar. * **Grok AI** versi 4.6 (dengan 1,5 triliun parameter) diperkirakan diluncurkan sekitar 7 Agustus, diikuti versi 4.7 yang lebih kuat beberapa minggu setelahnya. * **XRP Ledger** versi 3.3.0 dengan lima fitur baru, termasuk transaksi batch, dijadwalkan rilis minggu depan. **Penutupan & Perubahan Layanan:** * Beberapa layanan kripto akan berhenti beroperasi: **Zapper** (pelacak portofolio DeFi) dan **Ctrl Wallet** pada 3 Agustus, serta **LayerZero** akan menghentikan relayernya untuk v1 pada tanggal yang sama. Bursa Korea **Upbit** akan menghapus perdagangan pasangan **AQT** dan **AERGO** pada 3 Agustus. **Acara Lainnya:** * **BIP-110**, sebuah proposal peningkatan jaringan Bitcoin, akan memulai fase pengiriman sinyal wajib sekitar 8 Agustus.

marsbit1j yang lalu

Perhatian Wajib Pekan Depan|Undang-Undang CLARITY Diperkirakan Akan Masuk ke Pemungutan Suara Senat; SpaceX dan Circle Umumkan Laporan Keuangan (3-9 Agustus)

marsbit1j yang lalu

Saham Jatuh Lebih Parah daripada Kripto, Ke Mana Uangnya Pergi?

Penulis: Cathy,白话区块链 Pada 28 dan 29 Juli di Seoul, indeks Kospi memicu *circuit breaker* dua hari berturut-turut, suatu peristiwa yang belum pernah terjadi dalam sejarah pasar saham Korea. Saham-saham semikonduktor global, termasuk SK Hynix yang turun sekitar 23% dalam dua hari, mengalami penurunan drastis. Penarikan dana (pullback) Kospi pada Juli mencapai 40% dari titik tertinggi Juni, menjadikannya bulan terburuk yang tercatat. Produk leverage seperti ETF 2x Long SK Hynix bahkan anjlok hingga 83%, menghapus lebih dari 1 triliun HKD dalam nilai pasar. Ironisnya, Bitcoin justru naik hampir 15% dari titik terendah Juli, menunjukkan perilaku yang tidak biasa: **saham yang jatuh seperti aset kripto, sementara Bitcoin relatif stabil.** Penurunan ini bukan kepanikan pasar luas, melainkan "peledakan tertarget" terhadap perdagangan yang paling ramai (*crowded trades*), dipicu oleh laporan keuangan SK Hynix yang meski mencetak rekor laba tetapi di bawah perkiraan, serta IPO besar-besaran ChangXin Memory (CXMT) dari China. Ditambah dengan potensi likuidasi posisi *carry trade* Yen Jepang yang masif, pasar mengalami de-leverage paksa. Lalu, apakah uang yang keluar dari saham mengalir ke Bitcoin? Jawabannya tidak. Bitcoin tampak "tahan jatuh" karena sudah mengalami koreksi lebih dulu—jatuh sekitar 21% selama periode arus keluar ETF berkelanjutan pada Mei-Juni. Uang yang mencari perlindungan justru mengalir ke emas, yang harganya naik lebih dari 20% secara tahunan. Koefisien korelasi Bitcoin dengan emas mencapai -0.88, mengindikasikan bahwa institusi kini memandangnya sebagai aset yang berbeda: **emas untuk perlindungan, Bitcoin untuk potensi pertumbuhan.** Agar aliran dana besar-besaran benar-benar masuk ke Bitcoin, diperlukan tiga kondisi: tekanan likuidasi global mereda, The Fed menurunkan suku bunga tanpa memicu resesi, dan disahkannya RUU CLARITY di AS untuk memberikan kejelasan regulasi. Meski RUU tersebut tertunda di Senat, arahnya sudah jelas. **Harga saham teknologi ditentukan oleh pengeluaran modal AI dan laba perusahaan, sedangkan harga Bitcoin ditentukan oleh likuiditas global.** Ketidakselarasan ini justru menciptakan daya tarik bagi institusi yang ingin mendiversifikasi portofolio mereka. Kesimpulannya, Bitcoin saat ini bukan tempat perlindungan (*safe haven*), melainkan aset yang sudah terkoreksi lebih dulu dan sudah berada di posisi yang siap. **Dana belum datang, tetapi posisinya sudah dipersiapkan.** Ketika badai berlalu dan modal global mencari tempat baru untuk dialokasikan, Bitcoin berada di urutan terdepan dalam antrian.

marsbit1j yang lalu

Saham Jatuh Lebih Parah daripada Kripto, Ke Mana Uangnya Pergi?

marsbit1j yang lalu

Dialog dengan Ray Dalio: Saat Ini Berada dalam Gelembung AI, 1% Portofolio Investasi Adalah Bitcoin

Sumber: The Diary Of A CEO Ray Dalio, pendiri Bridgewater Associates yang meramalkan krisis keuangan 2008, memperingatkan bahwa ledakan AI saat ini menunjukkan tanda-tanda klasik gelembung ekonomi yang dapat pecah dan memicu resesi. Dalam wawancara podcast, dia menjelaskan dinamika "siklus besar" yang didorong oleh ketimpangan kekayaan, defisit pemerintah, dan perubahan geopolitik. Dalio mengidentifikasi pola di mana antusiasme berlebihan terhadap teknologi revolusioner baru, seperti AI, menyebabkan harga aset melambung dan pinjaman berlebihan. Ketika kondisi berubah (seperti kenaikan suku bunga atau kebutuhan tunai), gelembung ini dapat pecah, menyebabkan penurunan harga aset, kerugian luas, dan kontraksi ekonomi. Untuk melindungi kekayaan di masa ketidakpastian, Dalio sangat menekankan pentingnya **diversifikasi portofolio**—termasuk saham, obligasi, emas, dan real estat—daripada mengandalkan uang tunai saja. Dia mengungkapkan bahwa sekitar **1% portofolionya adalah Bitcoin**, yang diakuinya sebagai aset keras, tetapi dia lebih menyukai **emas fisik** karena sejarahnya sebagai penyimpan nilai dan aset bebas liabilitas. Mengenai dampak AI, Dalio percaya bahwa teknologi ini akan menggantikan tidak hanya tenaga fisik tetapi juga kemampuan kognitif manusia, berpotensi memperlebar kesenjangan antara pemilik modal dan pekerja. Masa depan akan menguntungkan mereka yang dapat memadukan kecerdasan manusia (seperti emosi dan intuisi) dengan kemitraan AI. Secara geopolitik, Dalio menggambarkan dunia yang memasuki fase "penurunan" dalam tatanan global, dengan Amerika Serikat menghadapi tantangan internal dan eksternal, termasuk konflik seperti di Iran yang mengungkap kelemahannya. Dia memprediksi dunia mungkin menjadi lebih terregionalisasi di masa depan. Secara keseluruhan, kunci untuk navigasi melalui periode kompleks ini adalah pemahaman akan pola sejarah, adaptasi, dan diversifikasi yang cermat.

marsbit5j yang lalu

Dialog dengan Ray Dalio: Saat Ini Berada dalam Gelembung AI, 1% Portofolio Investasi Adalah Bitcoin

marsbit5j yang lalu

Trading

Spot
活动图片