US Stocks Hit Record Highs: Why Isn't the Market Afraid of the Flames of War?

marsbitPublié le 2026-04-16Dernière mise à jour le 2026-04-16

Résumé

U.S. stocks hit a record high on April 15, with the S&P 500 closing at 7,022.95, just 77 days after its previous peak. This rebound occurred in only 11 trading days—far faster than recoveries following past crises like the COVID-19 pandemic (103 days) or the 2011 debt crisis (106 days). The market's rapid recovery is attributed to "ceasefire expectations" rather than deteriorating economic fundamentals. During the sell-off triggered by the U.S.-Israel military action against Iran in late February, the S&P 500 fell nearly 10%. However, the market rallied twice on ceasefire rumors—first on March 24 and again on April 8—even before any permanent peace deal was signed. Notably, the VIX fear index fell below pre-war levels, indicating that the market had repriced the conflict from an uncertainty to a calculable risk. Major financial institutions like JPMorgan reported record trading revenues of $11.6 billion in Q1 2026, largely driven by volatility in commodities and emerging markets. Hedge funds turned net long for the first time since late 2025, while margin debt hit a record $1.28 trillion. This reflects a financial system that commercializes volatility, treating geopolitical shocks as tradable opportunities rather than systemic threats. However, the current optimism relies on assumptions of a sustained ceasefire and stable oil prices, leaving the market vulnerable if these conditions change.

On April 15, the S&P 500 closed at 7,022.95 points, exactly 77 days after it last hit a record high. In those 77 days, the U.S. fought a war, oil prices broke above $100, and the stock market experienced its fastest 10% correction in five years. Then, it returned to a new high in about 11 trading days.

This number is worth pausing to think about. 11 trading days—this is an impossible speed in U.S. history following every crisis of a similar scale.

What 11 Trading Days Mean in History

Where does the speed of this recovery stand in the historical context?

According to a PBS report, JPMorgan strategists called this rebound "the fastest since the COVID-19 pandemic." Looking at the historical numbers, this statement is not an exaggeration.

During the COVID-19 pandemic in 2020, the market took about 103 trading days to rebound from the low on March 23 to a new high on August 18. During the Gulf War in 1990, it took about 87 trading days from the low at the end of October to return to the previous high in February 1991. During the U.S. debt crisis in 2011, it took about 106 trading days from the low in October of that year to a new high in March 2012.

This recovery from the 2026 Iran War: 11 trading days.
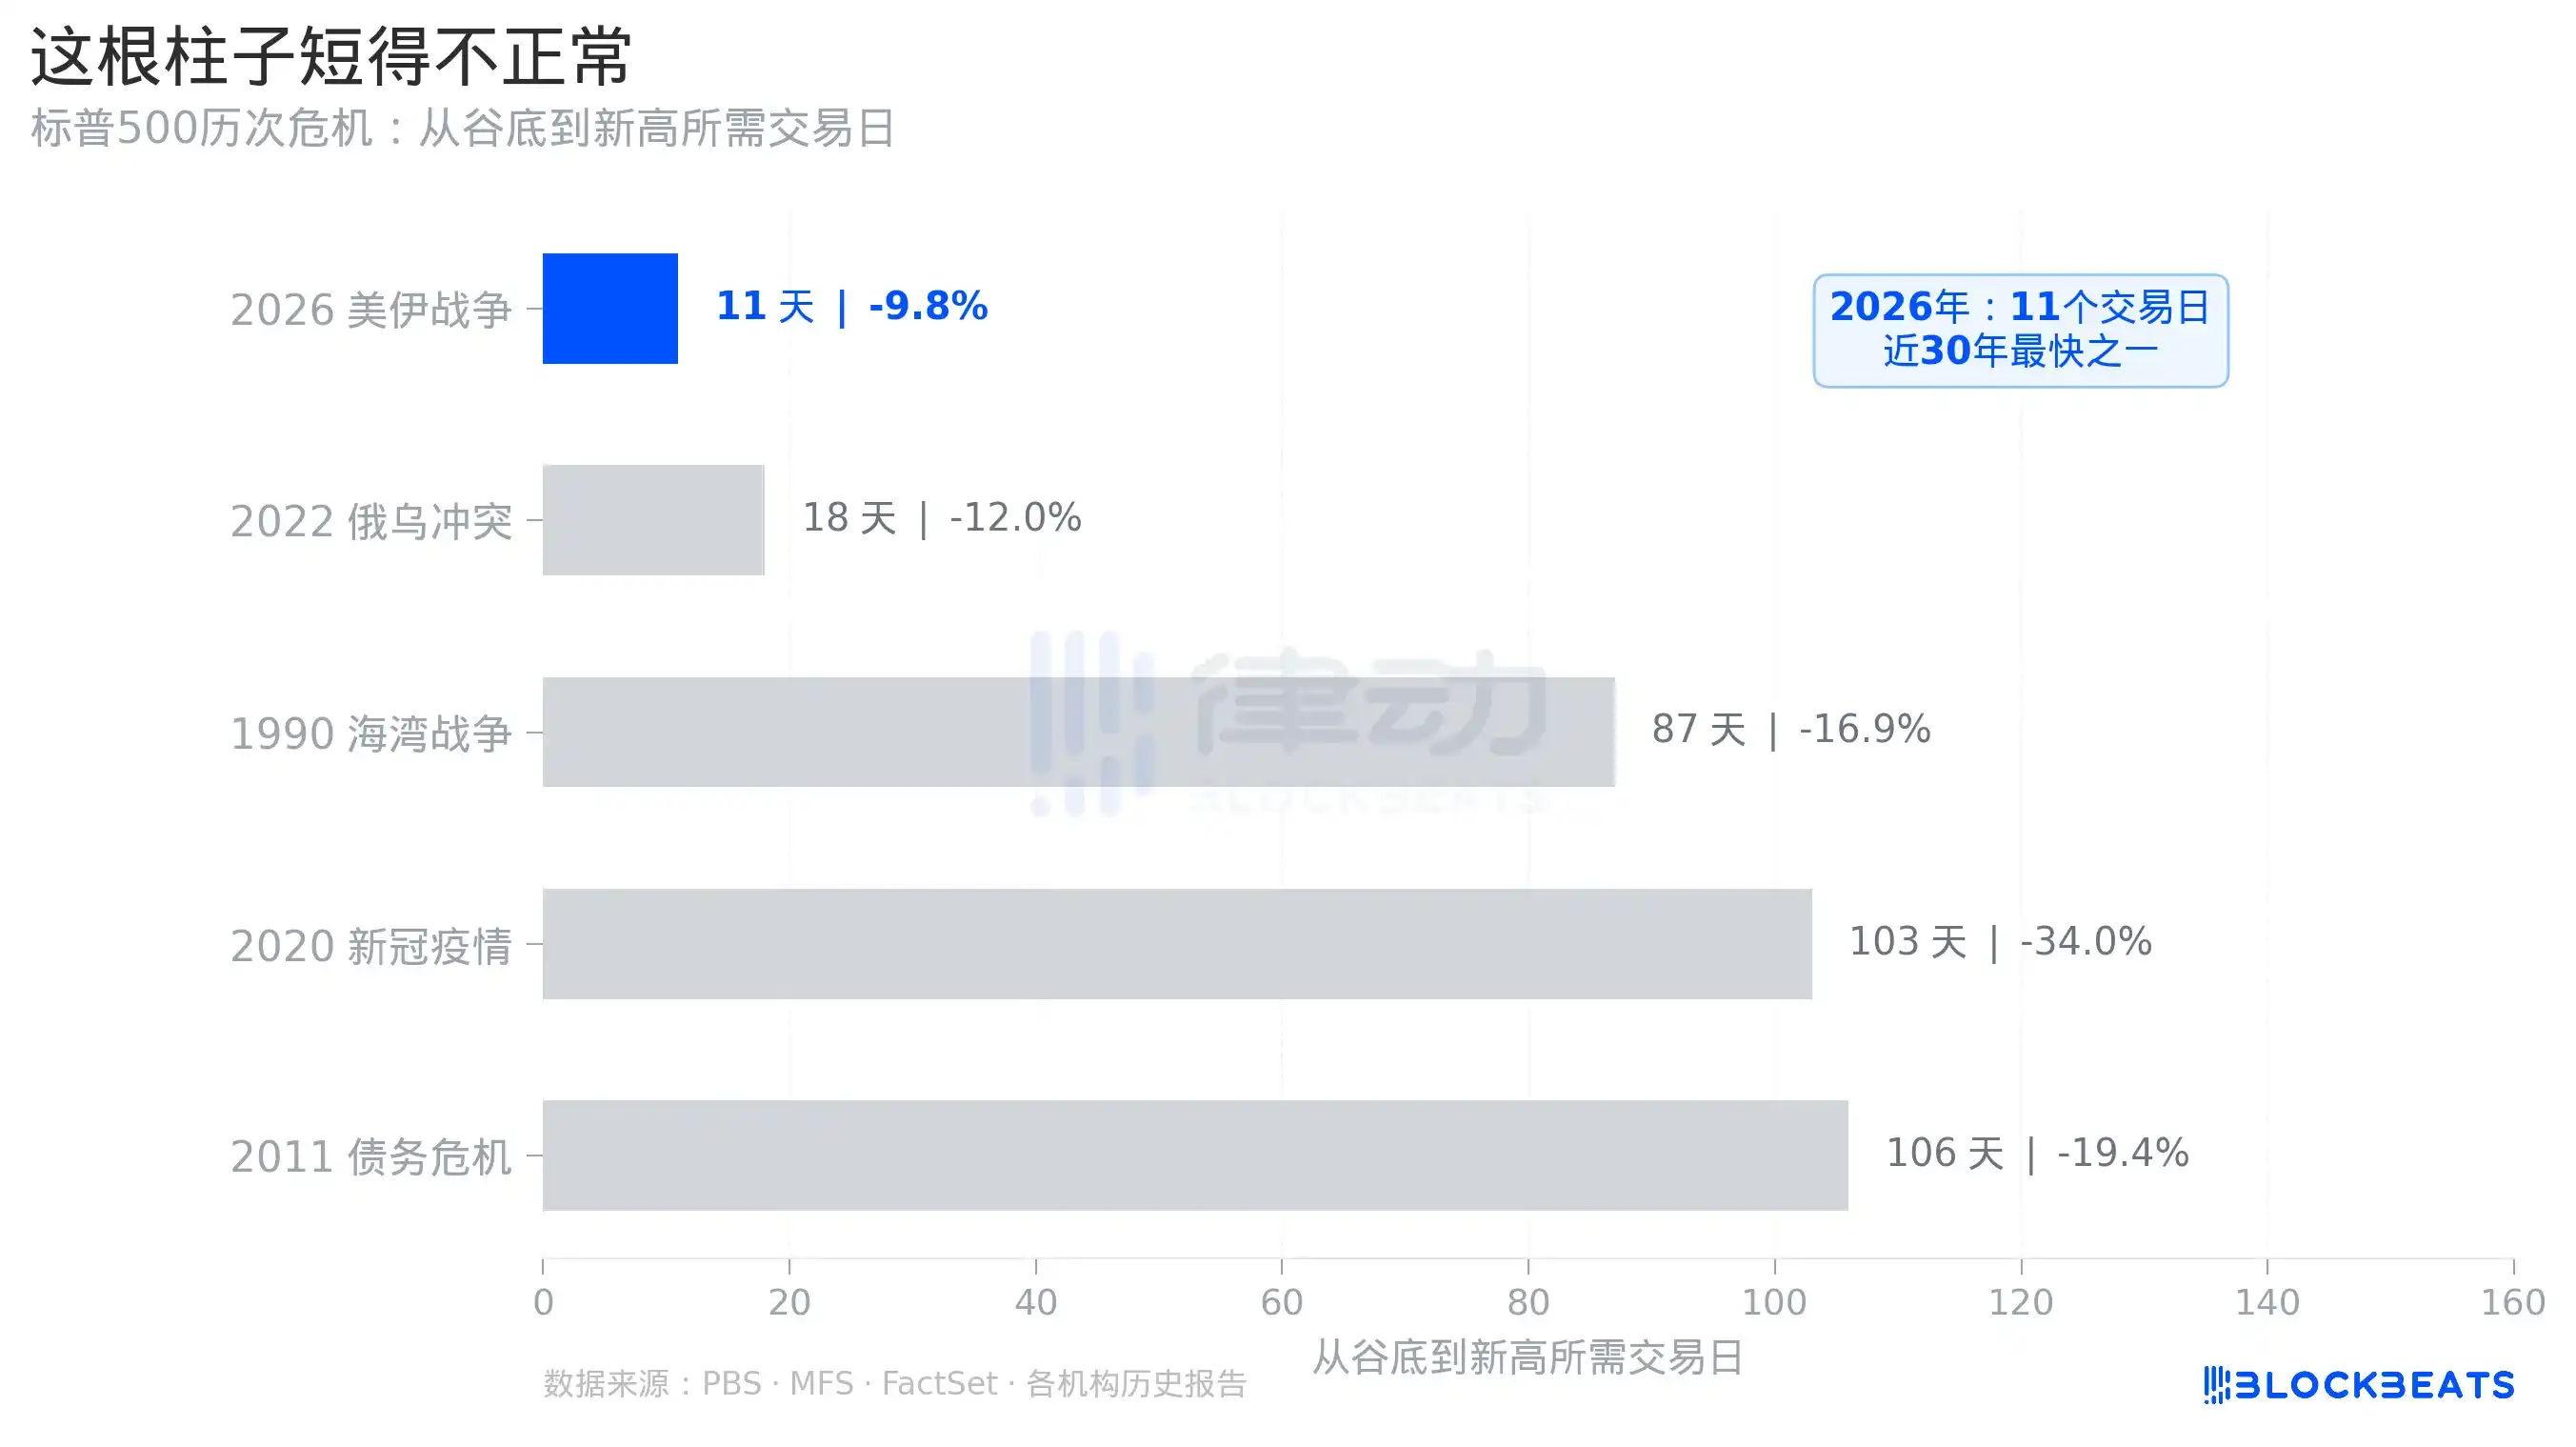
It should be noted that the magnitude of this correction (about 10%) was much smaller than during the COVID-19 period (about 34%) and 2011 (about 19%). But even compared to the 2022 Russia-Ukraine conflict, which had a similar decline, that recovery took about 18 trading days. Eleven days is still an outlier.

The narrative of this correction has always been "ceasefire expectations," not "deteriorating economic fundamentals." The market fell due to uncertainty, not profits. When ceasefire news actually emerged, the uncertainty pricing was quickly erased, without waiting for quarterly reports to rebuild confidence.

The Word "Ceasefire" Drove the Rally—Twice

To understand the speed of this recovery, it’s necessary to first clarify the news timeline.

On February 28, the U.S. and Israel launched military strikes against Iran. The S&P 500 began falling from its previous high of 7,002 points on January 28, dropping to 6,316 points by March 30, a maximum drop of nearly 10%. By Wall Street's definition, this was right on the edge of a "correction."

But during this decline, something strange happened. On March 24, rumors about the "possible unblocking of the Strait of Hormuz" circulated in the market, and the S&P rebounded that day. This was the first "ceasefire pricing." The rumors were later disproven, and the market continued to fall.

On April 8, Trump announced a two-week temporary ceasefire on social media, and Iran also accepted Pakistan's mediation proposal. The S&P 500 surged 2.5% in a single day. This was the second "ceasefire pricing," at a higher price, for almost exactly the same reason.
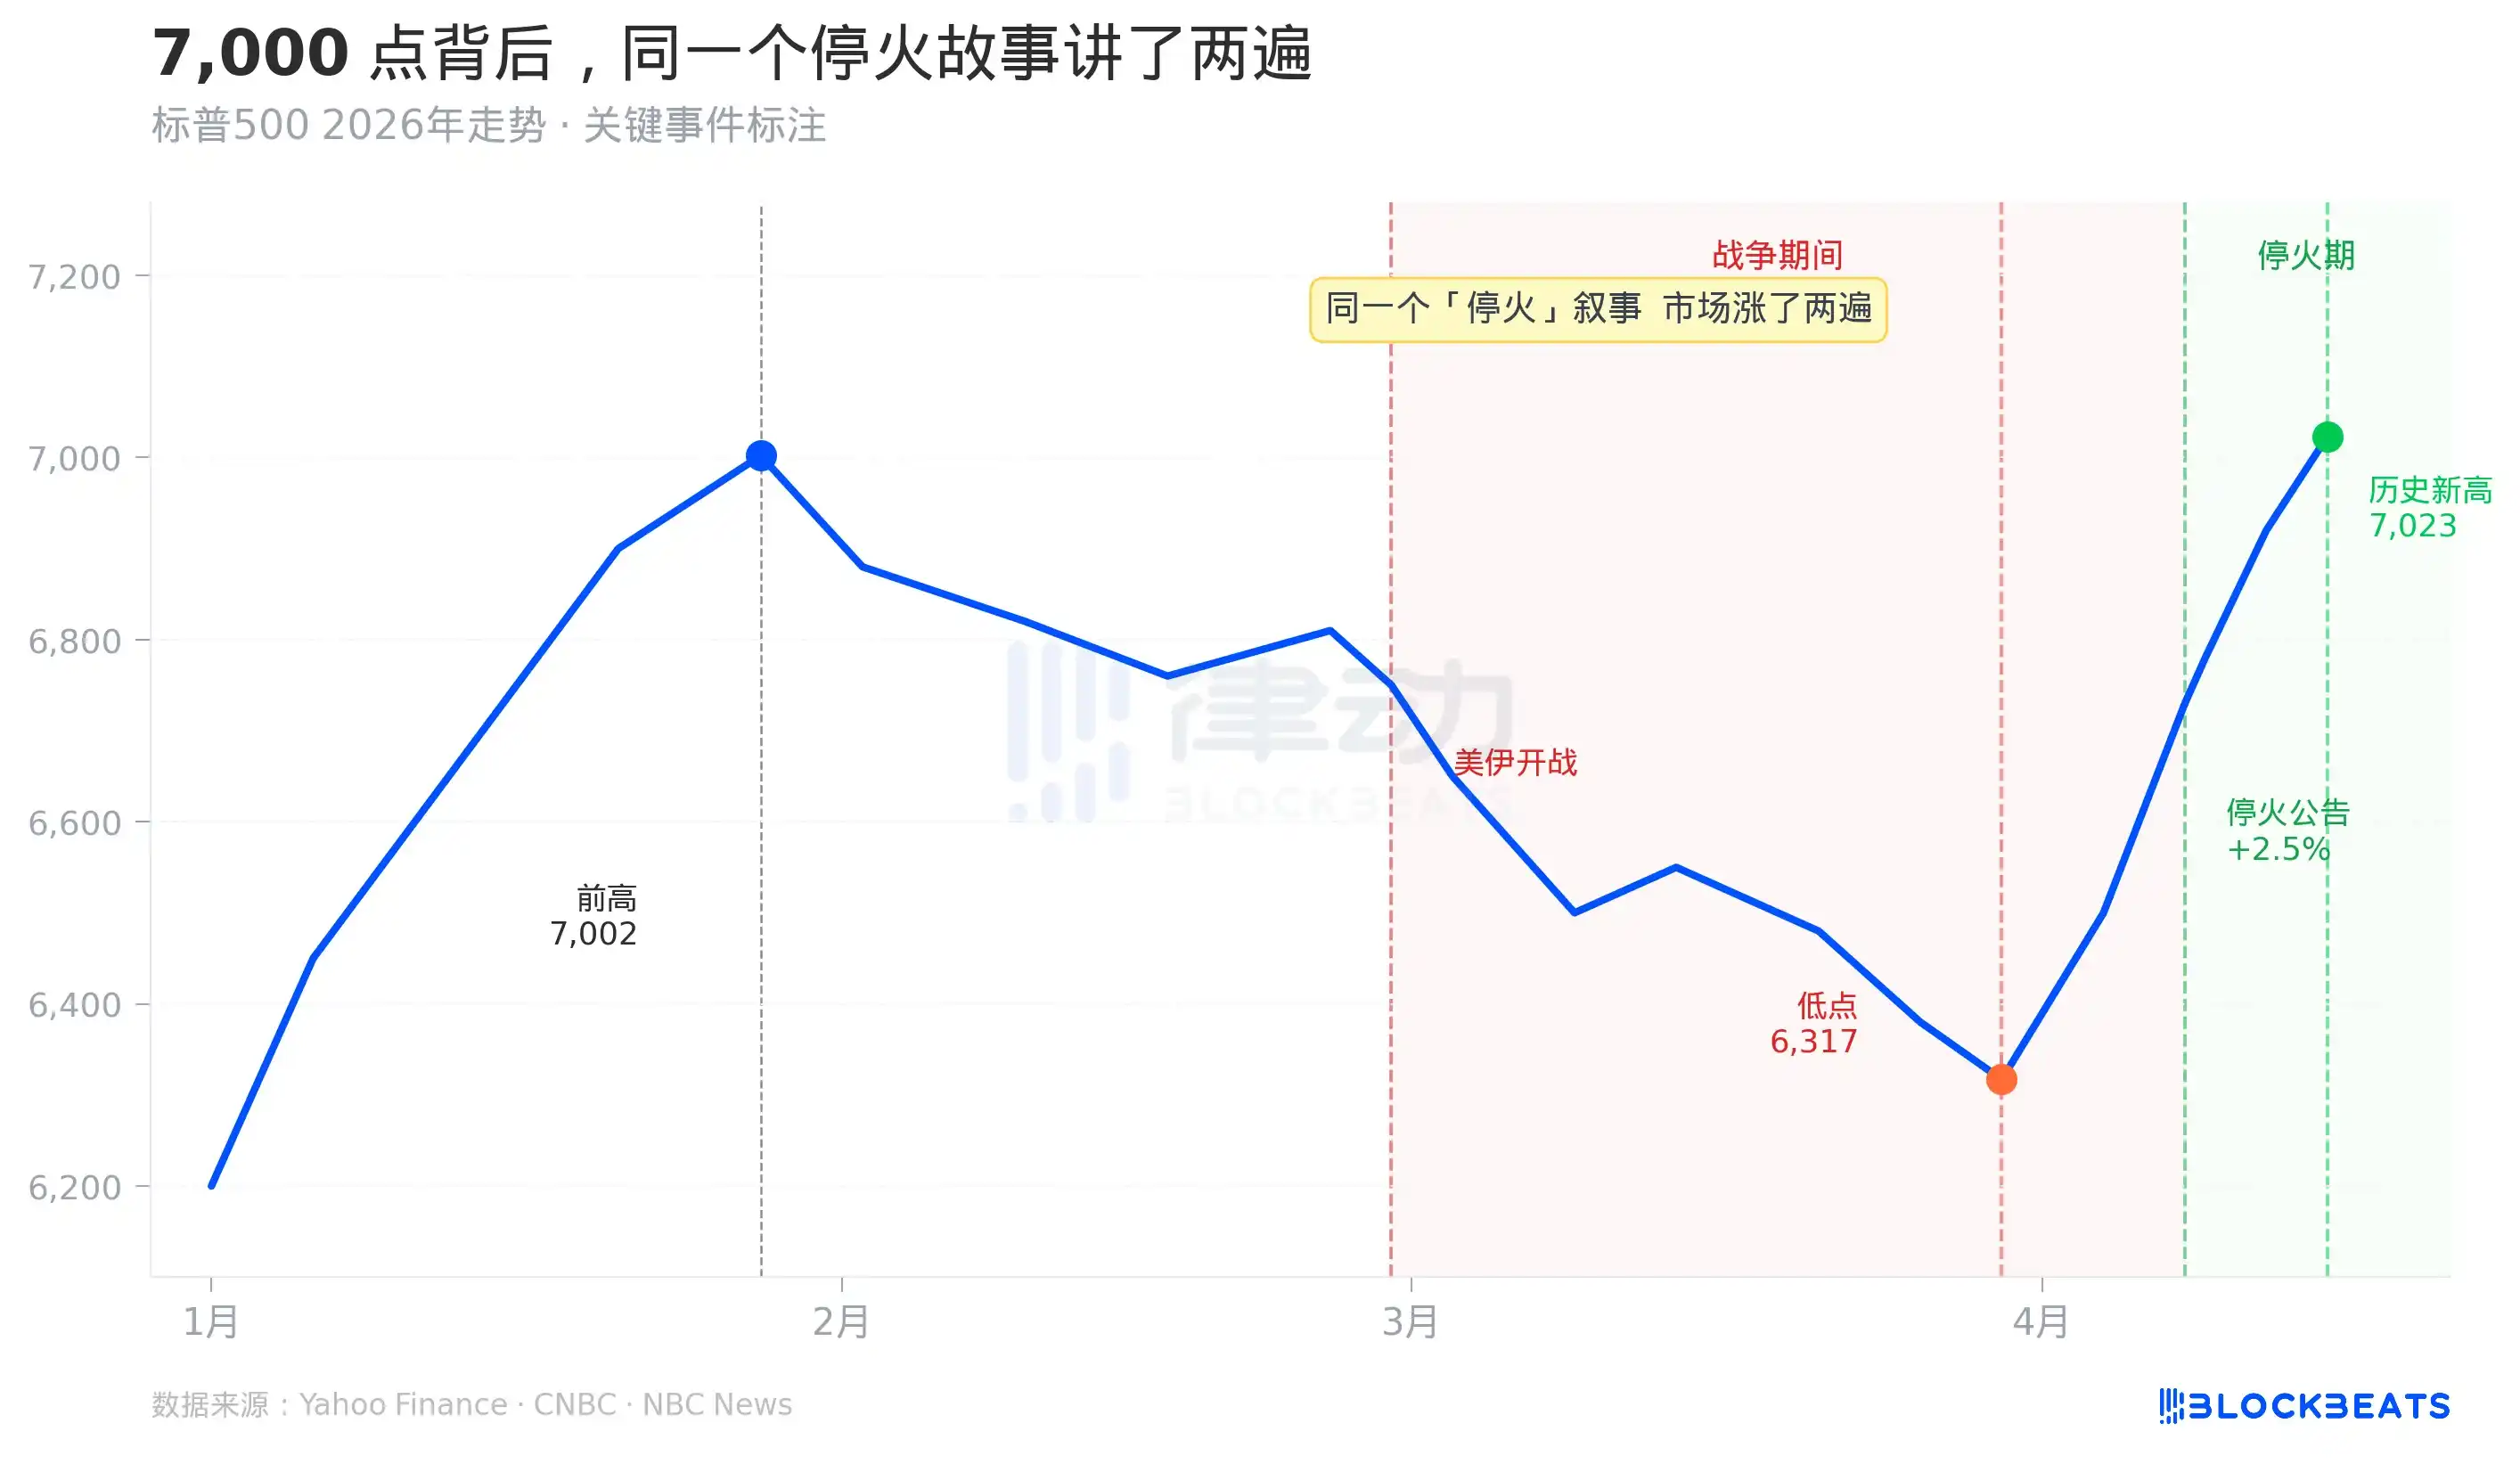
As shown in Chart 1, the two sharp rallies correspond to symmetrical event annotations, both labeled "increased possibility of ceasefire." It rose the first time, and then rose again the second time. As of April 15, when the new record high was set, the two-week temporary ceasefire agreement had not yet expired, and not a word of a permanent peace agreement had been signed.

What scenario is the market pricing in? Not "the end of the war," but "the possibility that the war could end." This expectation was priced—twice.

The Fear Index Is Lower Than Before the War

Even more counterintuitive is the number for the VIX, the index Wall Street uses to measure market panic.

When the war started on February 28, the VIX jumped from around 16 to touch 35.3 intraday on March 9. This aligns with common sense: war is a risk, and the market prices in uncertainty.
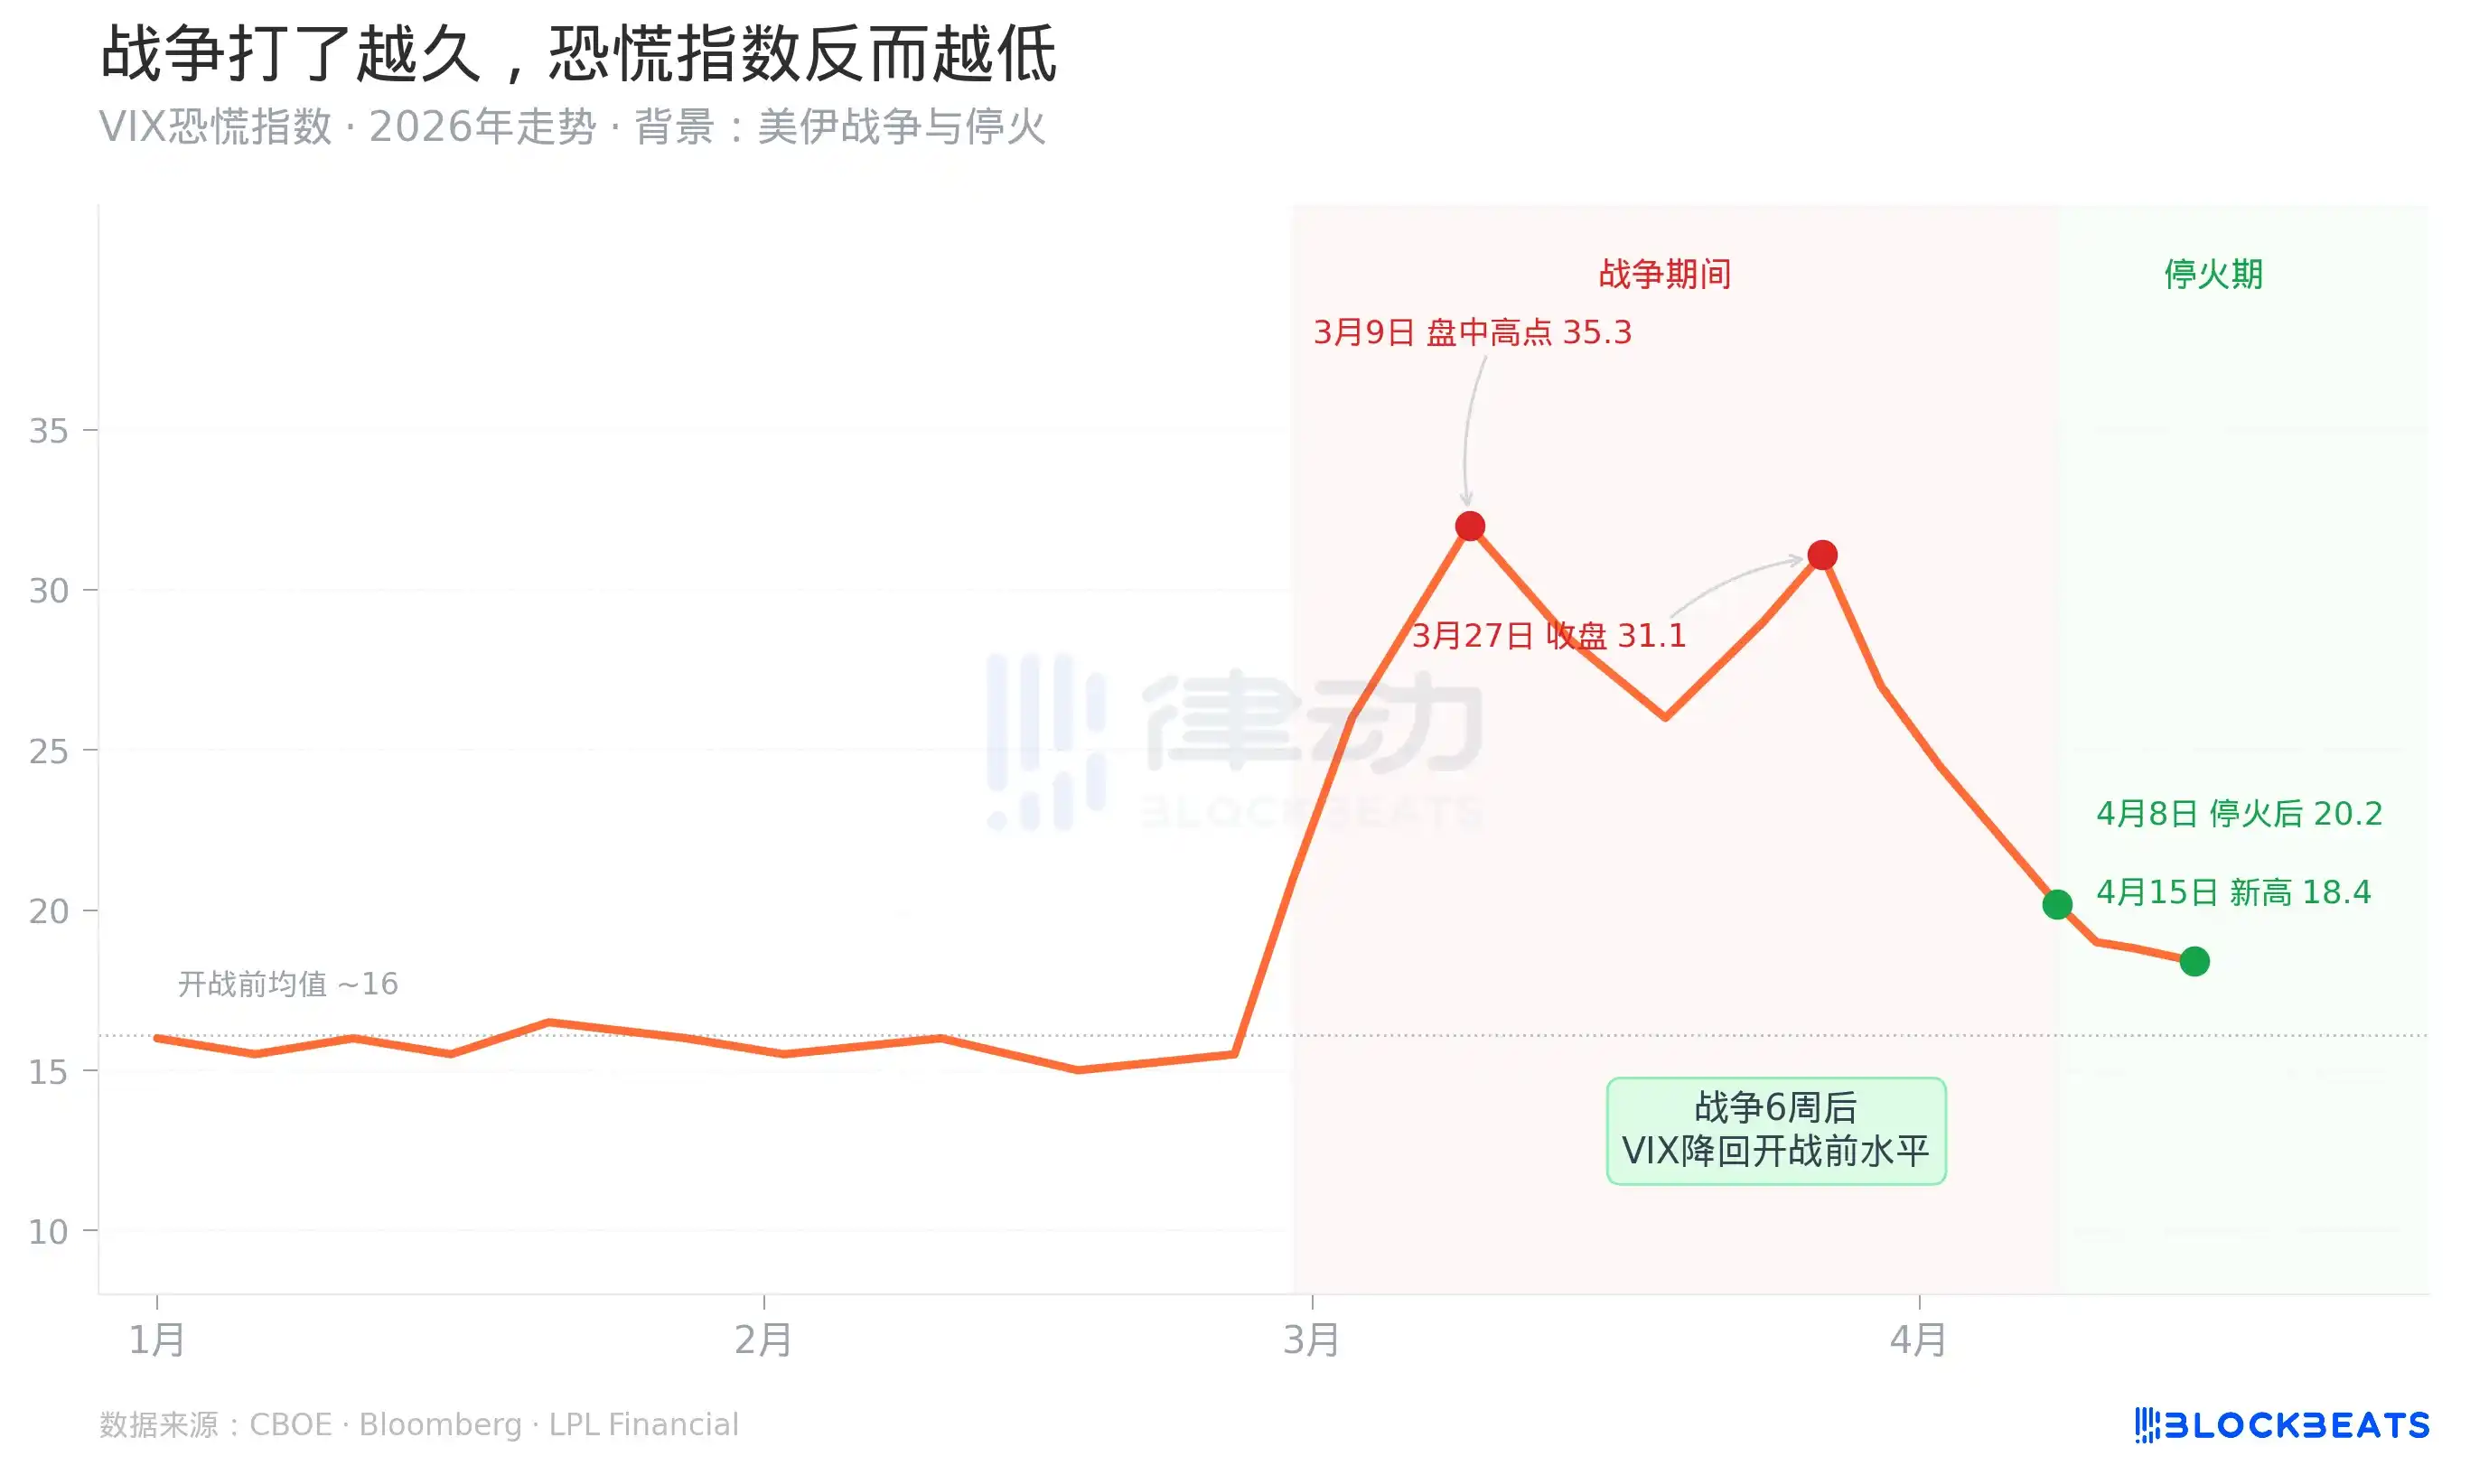
But the subsequent trend defies common sense. Starting from March 9, even as the war continued, oil prices rose, and the Senate voted on whether to authorize war powers, the VIX steadily declined. By April 15, the day the S&P hit its new record high, the VIX closed at around 18.4, lower than its level before the war started on February 28.

What does this mean? It means the market has reclassified this war from a "source of uncertainty" to a "calculable risk." Within six weeks, an ongoing war went from a "panic event" to "quarterly raw material."

This was achieved by a very specific financial mechanism. According to a CNBC report, JPMorgan's Q1 2026 trading division revenue reached $11.6 billion, a historical record, up 20% year-over-year. Fixed income division revenue was $7.1 billion, primarily driven by commodities, currency, and emerging market trading—precisely the areas where the Iran war generated the most "volatility."

In other words, while ordinary investors were feeling fear, professional institutions were harvesting volatility as profit. The more efficiently this mechanism operates, the more inclined the market is to "digest" the war, and the faster the VIX falls.

The Commercialization of Volatility

On April 15, the same day the S&P 500 hit a record high, the Pentagon announced the deployment of an additional 10,000 troops to the Middle East, and the Senate rejected the war powers authorization bill for the fourth time. These two things happened on the same day, and the market had no reaction to them.
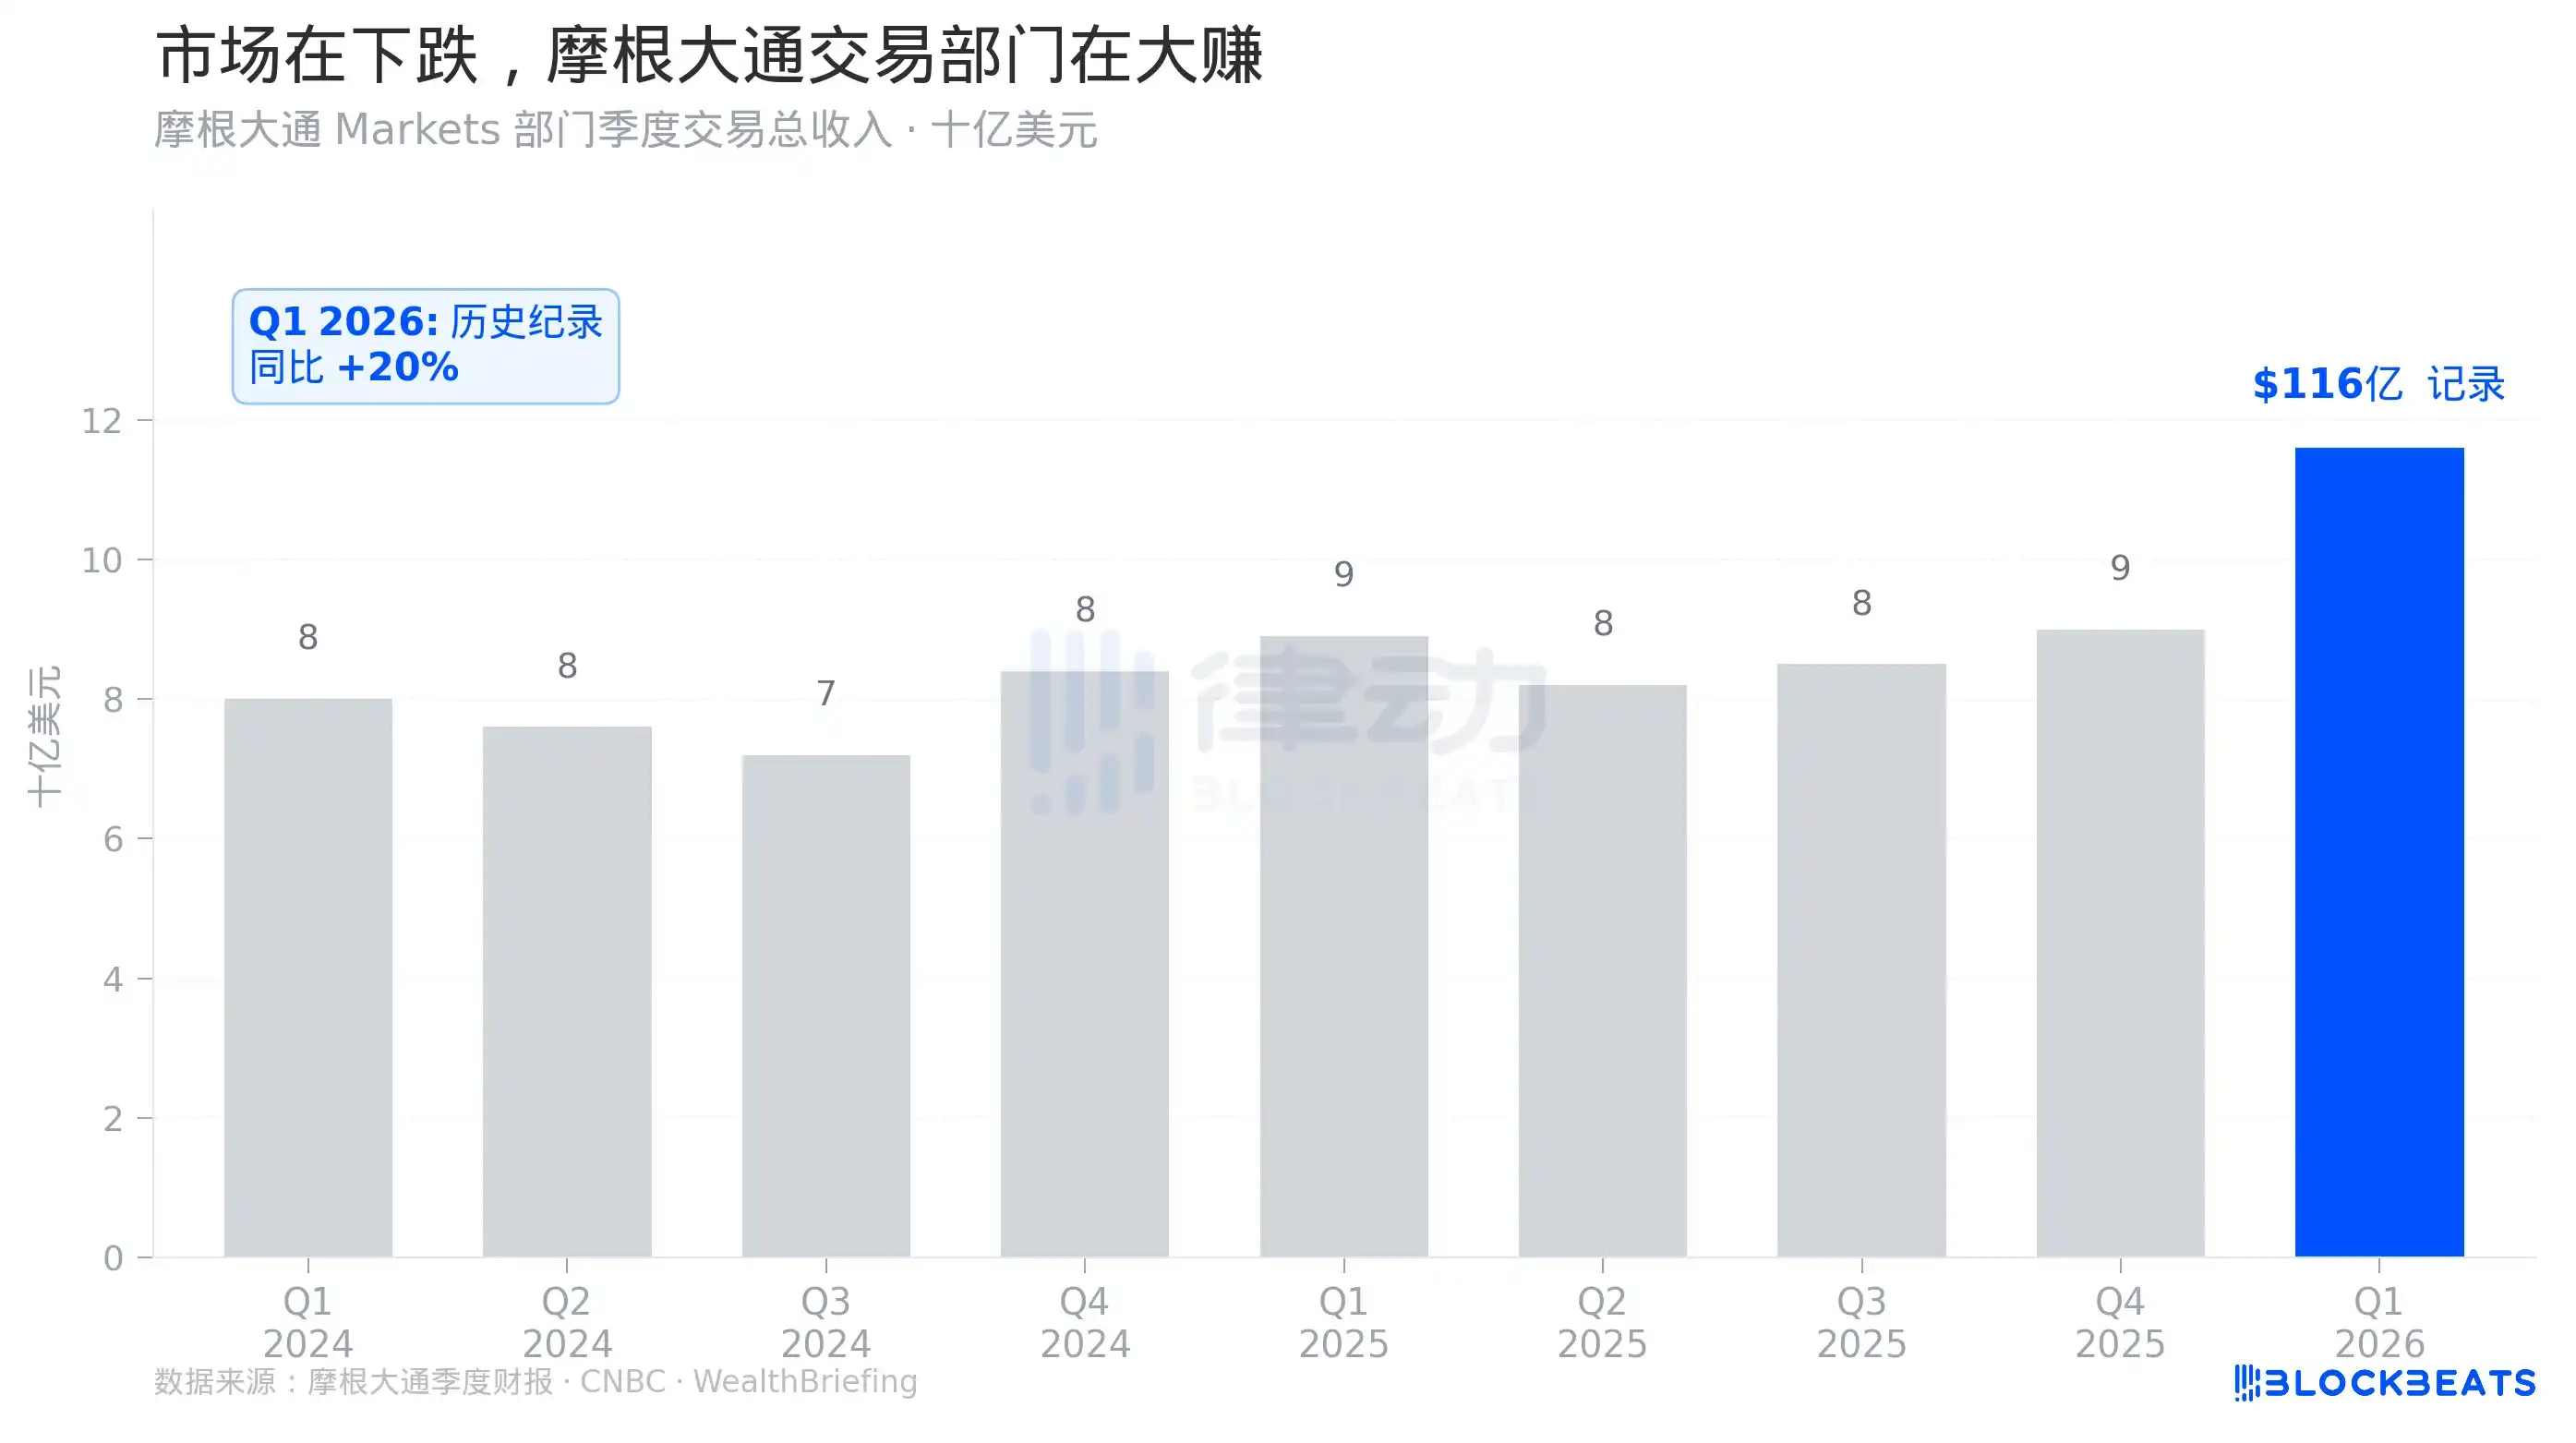
As shown in Chart 4, the bar for JPMorgan's Q1 2026 trading revenue is significantly higher than the previous eight quarters. This isn't a marginal improvement; it's a jump.

Supporting this jump are the profits hedge funds and market makers made from war volatility. According to Goldman Sachs Prime Brokerage data, as of April 14, the net long positions of U.S. hedge funds had turned positive for the first time since the end of 2025. During the same period, according to FINRA data cited by Atwater Malick, U.S. stock margin debt hit a record high of $1.28 trillion, up 36% year-over-year.

Three signals appeared simultaneously: hedge funds shifting from short to long, record leverage, and the market hitting record highs. This is a standard "trading on optimism" pattern.

Understanding this pattern involves looking at the financial infrastructure layer. When Wall Street's market makers, derivatives markets, and hedge funds are sufficiently mature, geopolitical shocks are no longer exogenous, unmeasurable risks but rather raw materials that can be priced, hedged, and commercialized. The Iran war, for JPMorgan's trading desk, is not a threat but an opportunity. The same goes for hedge funds that positioned correctly.

This is the true meaning of the "two screens, two worlds" on April 15. The Pentagon is prolonging the war; the market is pricing the end of the war. These two things are not contradictory because, for market makers, how long the war lasts is not important; whether the volatility is large enough is.

Of course, this mechanism has its fragility. The new high in 11 trading days implies an assumption: the two-week ceasefire will be smoothly extended, Iran nuclear negotiations will proceed as expected, and oil prices will fall. If any of these assumptions prove wrong, there is little buffer in the current pricing. The $1.28 trillion in leveraged funds is also an amplifier on the way down.

7,000 points is a price that only holds in the most optimistic scenario.

Cryptos en tendance

Questions liées

QHow many trading days did it take for the S&P 500 to recover to a new all-time high after the Iran War correction, and how does this compare to historical events?

AIt took 11 trading days for the S&P 500 to recover to a new all-time high after the Iran War correction. This is significantly faster than historical events such as the COVID-19 pandemic (103 days), the Gulf War (87 days), the 2011 US debt crisis (106 days), and even the 2022 Russia-Ukraine conflict (18 days).

QWhat was the primary narrative driving the market correction and subsequent rapid recovery during the Iran War event?

AThe primary narrative driving the market correction was 'ceasefire expectations' rather than a deterioration in economic fundamentals. The market fell due to uncertainty, not corporate earnings. When ceasefire news emerged, the uncertainty was quickly priced out, leading to a rapid recovery without the need to wait for quarterly earnings data to rebuild confidence.

QWhat unusual pattern was observed in the VIX (Volatility Index) during the Iran War, and what does it signify?

AThe VIX spiked from around 16 to 35.3 at the start of the war but then steadily declined, closing at approximately 18.4 by April 15—lower than its pre-war level. This indicates that the market rapidly reclassified the war from a source of 'uncertainty' to a 'calculable risk,' effectively commercializing the volatility it generated.

QHow did major financial institutions like JPMorgan perform during Q1 2026, and what was the driver behind this performance?

AJPMorgan's Q1 2026 trading department revenue reached a record $11.6 billion, a 20% year-over-year increase. This was largely driven by its fixed income division, which generated $7.1 billion in revenue from trading commodities, currencies, and emerging markets—areas most affected by the volatility from the Iran War.

QWhat are the potential risks associated with the market's rapid recovery and record-high leverage, as mentioned in the article?

AThe rapid recovery and record-high leverage of $1.28 trillion in margin debt assume optimistic scenarios, such as the temporary ceasefire being extended and Iran nuclear negotiations progressing smoothly. If any of these assumptions fail, the highly leveraged market has little buffer, and the same leverage that amplified gains could exacerbate losses in a downturn.

Lectures associées

Après trois trimestres consécutifs de baisse, le marché des cryptomonnaies pourra-t-il connaître une fenêtre de stabilisation au troisième trimestre ?

Le marché des cryptomonnaies a enregistré son pire trimestre depuis 2022, avec une capitalisation totale chutant de 12,6% à 2 100 milliards de dollars. Tous les indicateurs clés (volume des échanges, valeur des stablecoins) montrent une sortie nette de capitaux. Le Bitcoin a perdu 14,2% et l'Ethereum 25,4% sur le trimestre, rompant sa corrélation antérieure avec les actions technologiques. Les ETF spot américains sur le Bitcoin ont subi des rachats massifs, avec une sortie nette de 4,67 milliards de dollars au Q2, indiquant une pression de vente continue. Le resserrement de la politique de la Fed et les ventes d'entreprises comme Strategy ont accentué la déleveragisation du secteur. L'attention du marché se porte désormais presque exclusivement sur la réunion de la Fed fin juillet. Une position accommodante pourrait stabiliser le Bitcoin entre 68 000 et 84 000 dollars, tandis qu'un ton hawkish pourrait le faire osciller autour de 50 000-56 000 dollars. Parallèlement, la progression du *CLARITY Act*, une loi cruciale pour la clarté réglementaire, est au point mort au Sénat, réduisant les chances d'adoption en 2026 et maintenant une prime de risque élevée sur l'ensemble du secteur. Malgré ce contexte difficile, quelques secteurs résistent : les marchés de prédiction ont vu leur volume nominal augmenter de 48,7% et les biens collectionnables tokenisés ont progressé d'environ 143%. La tokenisation d'actifs du monde réel (RWA) continue également sa croissance régulière, portée par des fondamentaux indépendants du cycle crypto. Les bases d'un effondrement extrême semblent absentes, mais le marché est désormais guidé par les politiques monétaires, les prix et les attentes de taux, plutôt que par le simple récit haussier. La fin des sorties massives des ETF et le retour des achats des détenteurs à long terme pourraient indiquer une phase de stabilisation potentielle.

marsbitIl y a 10 h

Après trois trimestres consécutifs de baisse, le marché des cryptomonnaies pourra-t-il connaître une fenêtre de stabilisation au troisième trimestre ?

marsbitIl y a 10 h

The SpaceX Trade, Unlocked: SPCXON Débarque sur WEEX

En juin 2026, SpaceX a réalisé la plus grande introduction en bourse de l'histoire, mais l'accès à l'action a été limité pour de nombreux investisseurs en raison de restrictions régionales et de frictions liées aux courtiers. La plateforme WEEX propose désormais une solution via SPCXON/USDT, un instrument tokenisé sur le marché au comptant qui permet d'obtenir une exposition au cours de SpaceX en utilisant l'USDT, sans nécessiter de compte de courtage américain. SPCXON est un produit tokenisé construit sur l'infrastructure d'Ondo, conçu pour refléter l'économie de la détention d'actions SpaceX pour les traders éligibles en dehors des États-Unis, avec des dividendes réinvestis. Le cas d'investissement repose sur la croissance des revenus de Starlink et les progrès de Starship, malgré un valorisation déjà élevée et des risques liés à un flottant public réduit et à des déblocages d'actions internes à venir. Il est important de noter que SPCXON offre une exposition, et non la propriété directe d'actions ou de droits de vote. Son prix peut évoluer avec une prime ou une décote par rapport à la valeur liquidative. WEEX propose également d'autres produits tokenisés comme MSTRON et MUON dans un compte unifié, permettant une rotation entre crypto-monnaies et actions traditionnelles sans transfert de fonds. La plateforme souligne ainsi comment les barrières entre la finance traditionnelle et les actifs numériques s'estompent.

TheNewsCryptoIl y a 10 h

The SpaceX Trade, Unlocked: SPCXON Débarque sur WEEX

TheNewsCryptoIl y a 10 h

BIT Trading Moment : Le BTC reste sous la pression de l'EMA 200 hebdomadaire, un rejet pourrait relancer la baisse, les actions de stockage et de semi-conducteurs qui ont bondi cette nuit ont baissé en séance de nuit

**Résumé des marchés : Bitcoin sous pression, actions technologiques en réajustement** Le marché crypto poursuit son rebond, avec Bitcoin évoluant autour de 66 000 $. Il fait face à une résistance clé vers 68 000 $, niveau correspondant au coût moyen des investisseurs sur cinq mois. Les traders surveillent les moyennes mobiles clés (200 MA à ~63 333 $ et 200 EMA à ~68 328 $ en hebdomadaire). Une rupture au-dessus de 68 000 $ ouvrirait la voie à une hausse, tandis qu'un échec pourrait entraîner un retest des 63 000 $. L'analyse suggère que la dynamique actuelle ressemble à un rebond estival à faible liquidité plutôt qu'au début d'un véritable marché haussier. Sur le marché actions américain, après une forte séance mardi portée par les semi-conducteurs et les titres du stockage (Micron, AMD, Intel...), les contrats à terme indiquent une ouverture en baisse. Les secteurs ayant récemment bondi, comme les semi-conducteurs et le stockage, reculent en séance de nuit. Certaines valeurs se démarquent néanmoins, comme Super Micro Computer (SMCI), en hausse après des résultats et des perspectives robustes liées à la demande de serveurs IA. Des vents contraires persistent : les prix du pétrole (Brent >91$) et les rendements des obligations d'État américaines grimpent, ravivant les craintes inflationnistes. En Asie, les marchés ont suivi le rebond technologique américain, mais de manière hésitante. La tension reste forte sur le yen japonais, qui atteint son plus bas niveau depuis des décennies. **Points clés à surveiller :** * **Crypto :** Niveaux techniques de Bitcoin (68k$/63k$), flux des ETF spot. * **Actions :** Saison des résultats (Tesla, Alphabet, Intel...), activité d'AMD sur l'IA. * **Économie :** Données américaines sur l'emploi, décision de la BCE, tensions géopolitiques et prix de l'énergie.

marsbitIl y a 10 h

BIT Trading Moment : Le BTC reste sous la pression de l'EMA 200 hebdomadaire, un rejet pourrait relancer la baisse, les actions de stockage et de semi-conducteurs qui ont bondi cette nuit ont baissé en séance de nuit

marsbitIl y a 10 h

Gate Research Institute : La vague de « Wall Streetisation » des produits financiers cryptographiques, concurrence ou fusion ?

Le titre de l'article est : "Gate Institute : La vague de 'Wall Street-isation' des produits financiers cryptos, est-ce une compétition ou une fusion ?" Résumé en français (environ 1400 caractères) : Il y a dix-sept ans, Bitcoin fut créé avec une vision décentralisée et anti-establishment financier. Aujourd'hui, paradoxalement, son adoption massive passe souvent par des ETF émis par des géants comme BlackRock. Cet article analyse cette "Wall Street-isation" apparente des actifs cryptos : les institutions traditionnelles s'emparent-elles du pouvoir d'émission, de tarification, de garde et de distribution ? La réalité est plus nuancée. C'est une convergence à double sens. D'un côté, les plateformes cryptos comme Gate.io étendent leurs services aux actions traditionnelles (états-uniennes, hongkongaises, sud-coréennes), aux CFD et aux produits tokenisés, offrant un compte unifié. De l'autre, des courtiers traditionnels comme Robinhood intègrent les cryptomonnaies et explorent la tokenisation d'actions sur blockchain. Cette fusion vise à créer le "super-compte" financier de demain, où actions, cryptos, ETF et obligations tokenisées (RWA) coexistent dans une même interface, comblant les faiblesses de chaque écosystème. Les RWA, notamment les obligations d'État tokenisées, agissent comme une couche intermédiaire unificatrice. En conclusion, Wall Street n'a pas conquis la crypto, et la crypto n'a pas contourné Wall Street. Ils construisent ensemble une nouvelle forme de marché des capitaux, plus efficace et mondial, où l'idéal décentralisé persiste dans les protocoles, tandis qu'une expérience utilisateur unifiée émerge à l'interface.

marsbitIl y a 10 h

Gate Research Institute : La vague de « Wall Streetisation » des produits financiers cryptographiques, concurrence ou fusion ?

marsbitIl y a 10 h

Trading

Spot

Articles tendance

Comment acheter WAR

Bienvenue sur HTX.com ! Nous vous permettons d'acheter WAR (WAR) de manière simple et pratique. Suivez notre guide étape par étape pour commencer votre parcours crypto.Étape 1 : Création de votre compte HTXUtilisez votre adresse e-mail ou votre numéro de téléphone pour ouvrir un compte sur HTX gratuitement. L'inscription se fait en toute simplicité et débloque toutes les fonctionnalités.Créer mon compteÉtape 2 : Choix du mode de paiement (rubrique Acheter des cryptosCarte de crédit/débit : utilisez votre carte Visa ou Mastercard pour acheter instantanément WAR (WAR).Solde :utilisez les fonds du solde de votre compte HTX pour trader en toute simplicité.Prestataire tiers :pour accroître la commodité d'utilisation, nous avons ajouté des modes de paiement populaires tels que Google Pay et Apple Pay.P2P :tradez directement avec d'autres utilisateurs sur HTX.OTC (de gré à gré) : nous offrons des services personnalisés et des taux de change compétitifs aux traders.Étape 3 : stockage de vos WAR (WAR)Après avoir acheté vos WAR (WAR), stockez-les sur votre compte HTX. Vous pouvez également les envoyer ailleurs via un transfert sur la blockchain ou les utiliser pour trader d'autres cryptos.Étape 4 : tradez des WAR (WAR)Tradez facilement WAR (WAR) sur le marché Spot de HTX. Il vous suffit d'accéder à votre compte, de sélectionner la paire de trading, d'exécuter vos trades et de les suivre en temps réel. Nous offrons une expérience conviviale aux débutants comme aux traders chevronnés.

574 vues totalesPublié le 2024.12.11Mis à jour le 2026.06.02

Comment acheter WAR

Discussions

Bienvenue dans la Communauté HTX. Ici, vous pouvez vous tenir informé(e) des derniers développements de la plateforme et accéder à des analyses de marché professionnelles. Les opinions des utilisateurs sur le prix de WAR (WAR) sont présentées ci-dessous.

活动图片













