US Stocks Hit Record Highs: Why Isn't the Market Afraid of the Flames of War?

marsbitPublié le 2026-04-16Dernière mise à jour le 2026-04-16

Résumé

U.S. stocks hit a record high on April 15, with the S&P 500 closing at 7,022.95, just 77 days after its previous peak. This rebound occurred in only 11 trading days—far faster than recoveries following past crises like the COVID-19 pandemic (103 days) or the 2011 debt crisis (106 days). The market's rapid recovery is attributed to "ceasefire expectations" rather than deteriorating economic fundamentals. During the sell-off triggered by the U.S.-Israel military action against Iran in late February, the S&P 500 fell nearly 10%. However, the market rallied twice on ceasefire rumors—first on March 24 and again on April 8—even before any permanent peace deal was signed. Notably, the VIX fear index fell below pre-war levels, indicating that the market had repriced the conflict from an uncertainty to a calculable risk. Major financial institutions like JPMorgan reported record trading revenues of $11.6 billion in Q1 2026, largely driven by volatility in commodities and emerging markets. Hedge funds turned net long for the first time since late 2025, while margin debt hit a record $1.28 trillion. This reflects a financial system that commercializes volatility, treating geopolitical shocks as tradable opportunities rather than systemic threats. However, the current optimism relies on assumptions of a sustained ceasefire and stable oil prices, leaving the market vulnerable if these conditions change.

On April 15, the S&P 500 closed at 7,022.95 points, exactly 77 days after it last hit a record high. In those 77 days, the U.S. fought a war, oil prices broke above $100, and the stock market experienced its fastest 10% correction in five years. Then, it returned to a new high in about 11 trading days.

This number is worth pausing to think about. 11 trading days—this is an impossible speed in U.S. history following every crisis of a similar scale.

What 11 Trading Days Mean in History

Where does the speed of this recovery stand in the historical context?

According to a PBS report, JPMorgan strategists called this rebound "the fastest since the COVID-19 pandemic." Looking at the historical numbers, this statement is not an exaggeration.

During the COVID-19 pandemic in 2020, the market took about 103 trading days to rebound from the low on March 23 to a new high on August 18. During the Gulf War in 1990, it took about 87 trading days from the low at the end of October to return to the previous high in February 1991. During the U.S. debt crisis in 2011, it took about 106 trading days from the low in October of that year to a new high in March 2012.

This recovery from the 2026 Iran War: 11 trading days.

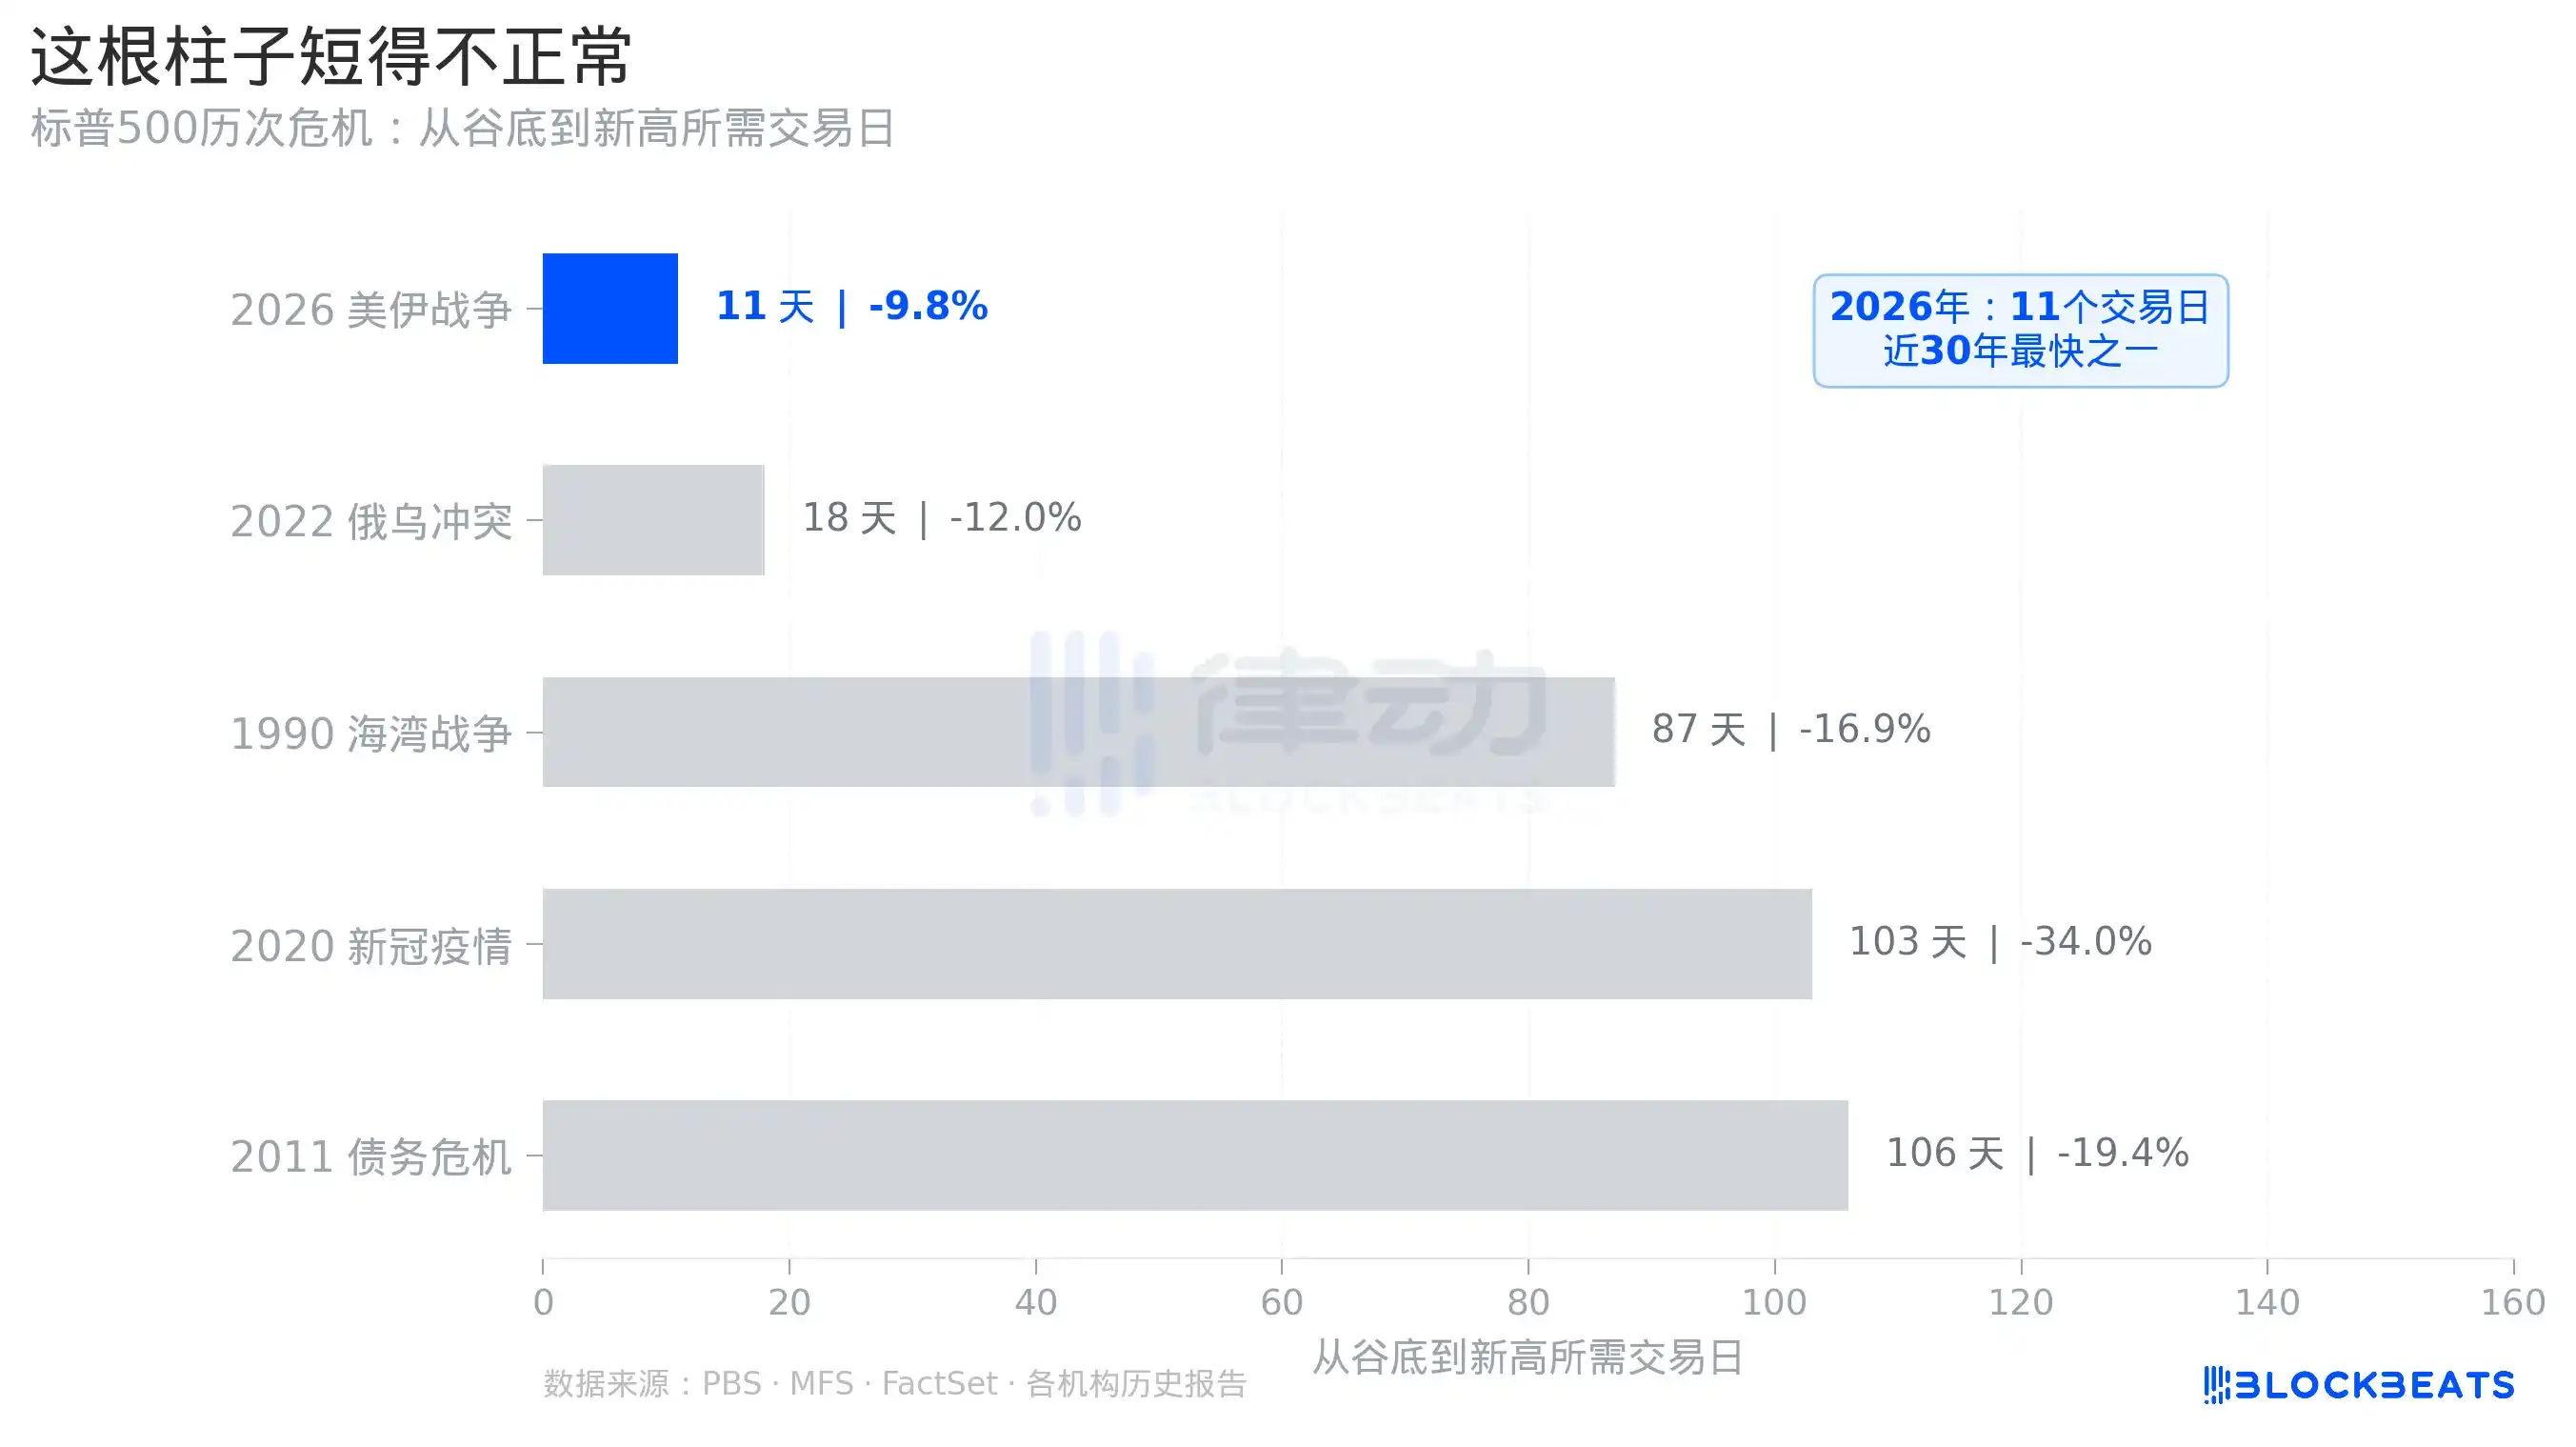
It should be noted that the magnitude of this correction (about 10%) was much smaller than during the COVID-19 period (about 34%) and 2011 (about 19%). But even compared to the 2022 Russia-Ukraine conflict, which had a similar decline, that recovery took about 18 trading days. Eleven days is still an outlier.

The narrative of this correction has always been "ceasefire expectations," not "deteriorating economic fundamentals." The market fell due to uncertainty, not profits. When ceasefire news actually emerged, the uncertainty pricing was quickly erased, without waiting for quarterly reports to rebuild confidence.

The Word "Ceasefire" Drove the Rally—Twice

To understand the speed of this recovery, it’s necessary to first clarify the news timeline.

On February 28, the U.S. and Israel launched military strikes against Iran. The S&P 500 began falling from its previous high of 7,002 points on January 28, dropping to 6,316 points by March 30, a maximum drop of nearly 10%. By Wall Street's definition, this was right on the edge of a "correction."

But during this decline, something strange happened. On March 24, rumors about the "possible unblocking of the Strait of Hormuz" circulated in the market, and the S&P rebounded that day. This was the first "ceasefire pricing." The rumors were later disproven, and the market continued to fall.

On April 8, Trump announced a two-week temporary ceasefire on social media, and Iran also accepted Pakistan's mediation proposal. The S&P 500 surged 2.5% in a single day. This was the second "ceasefire pricing," at a higher price, for almost exactly the same reason.

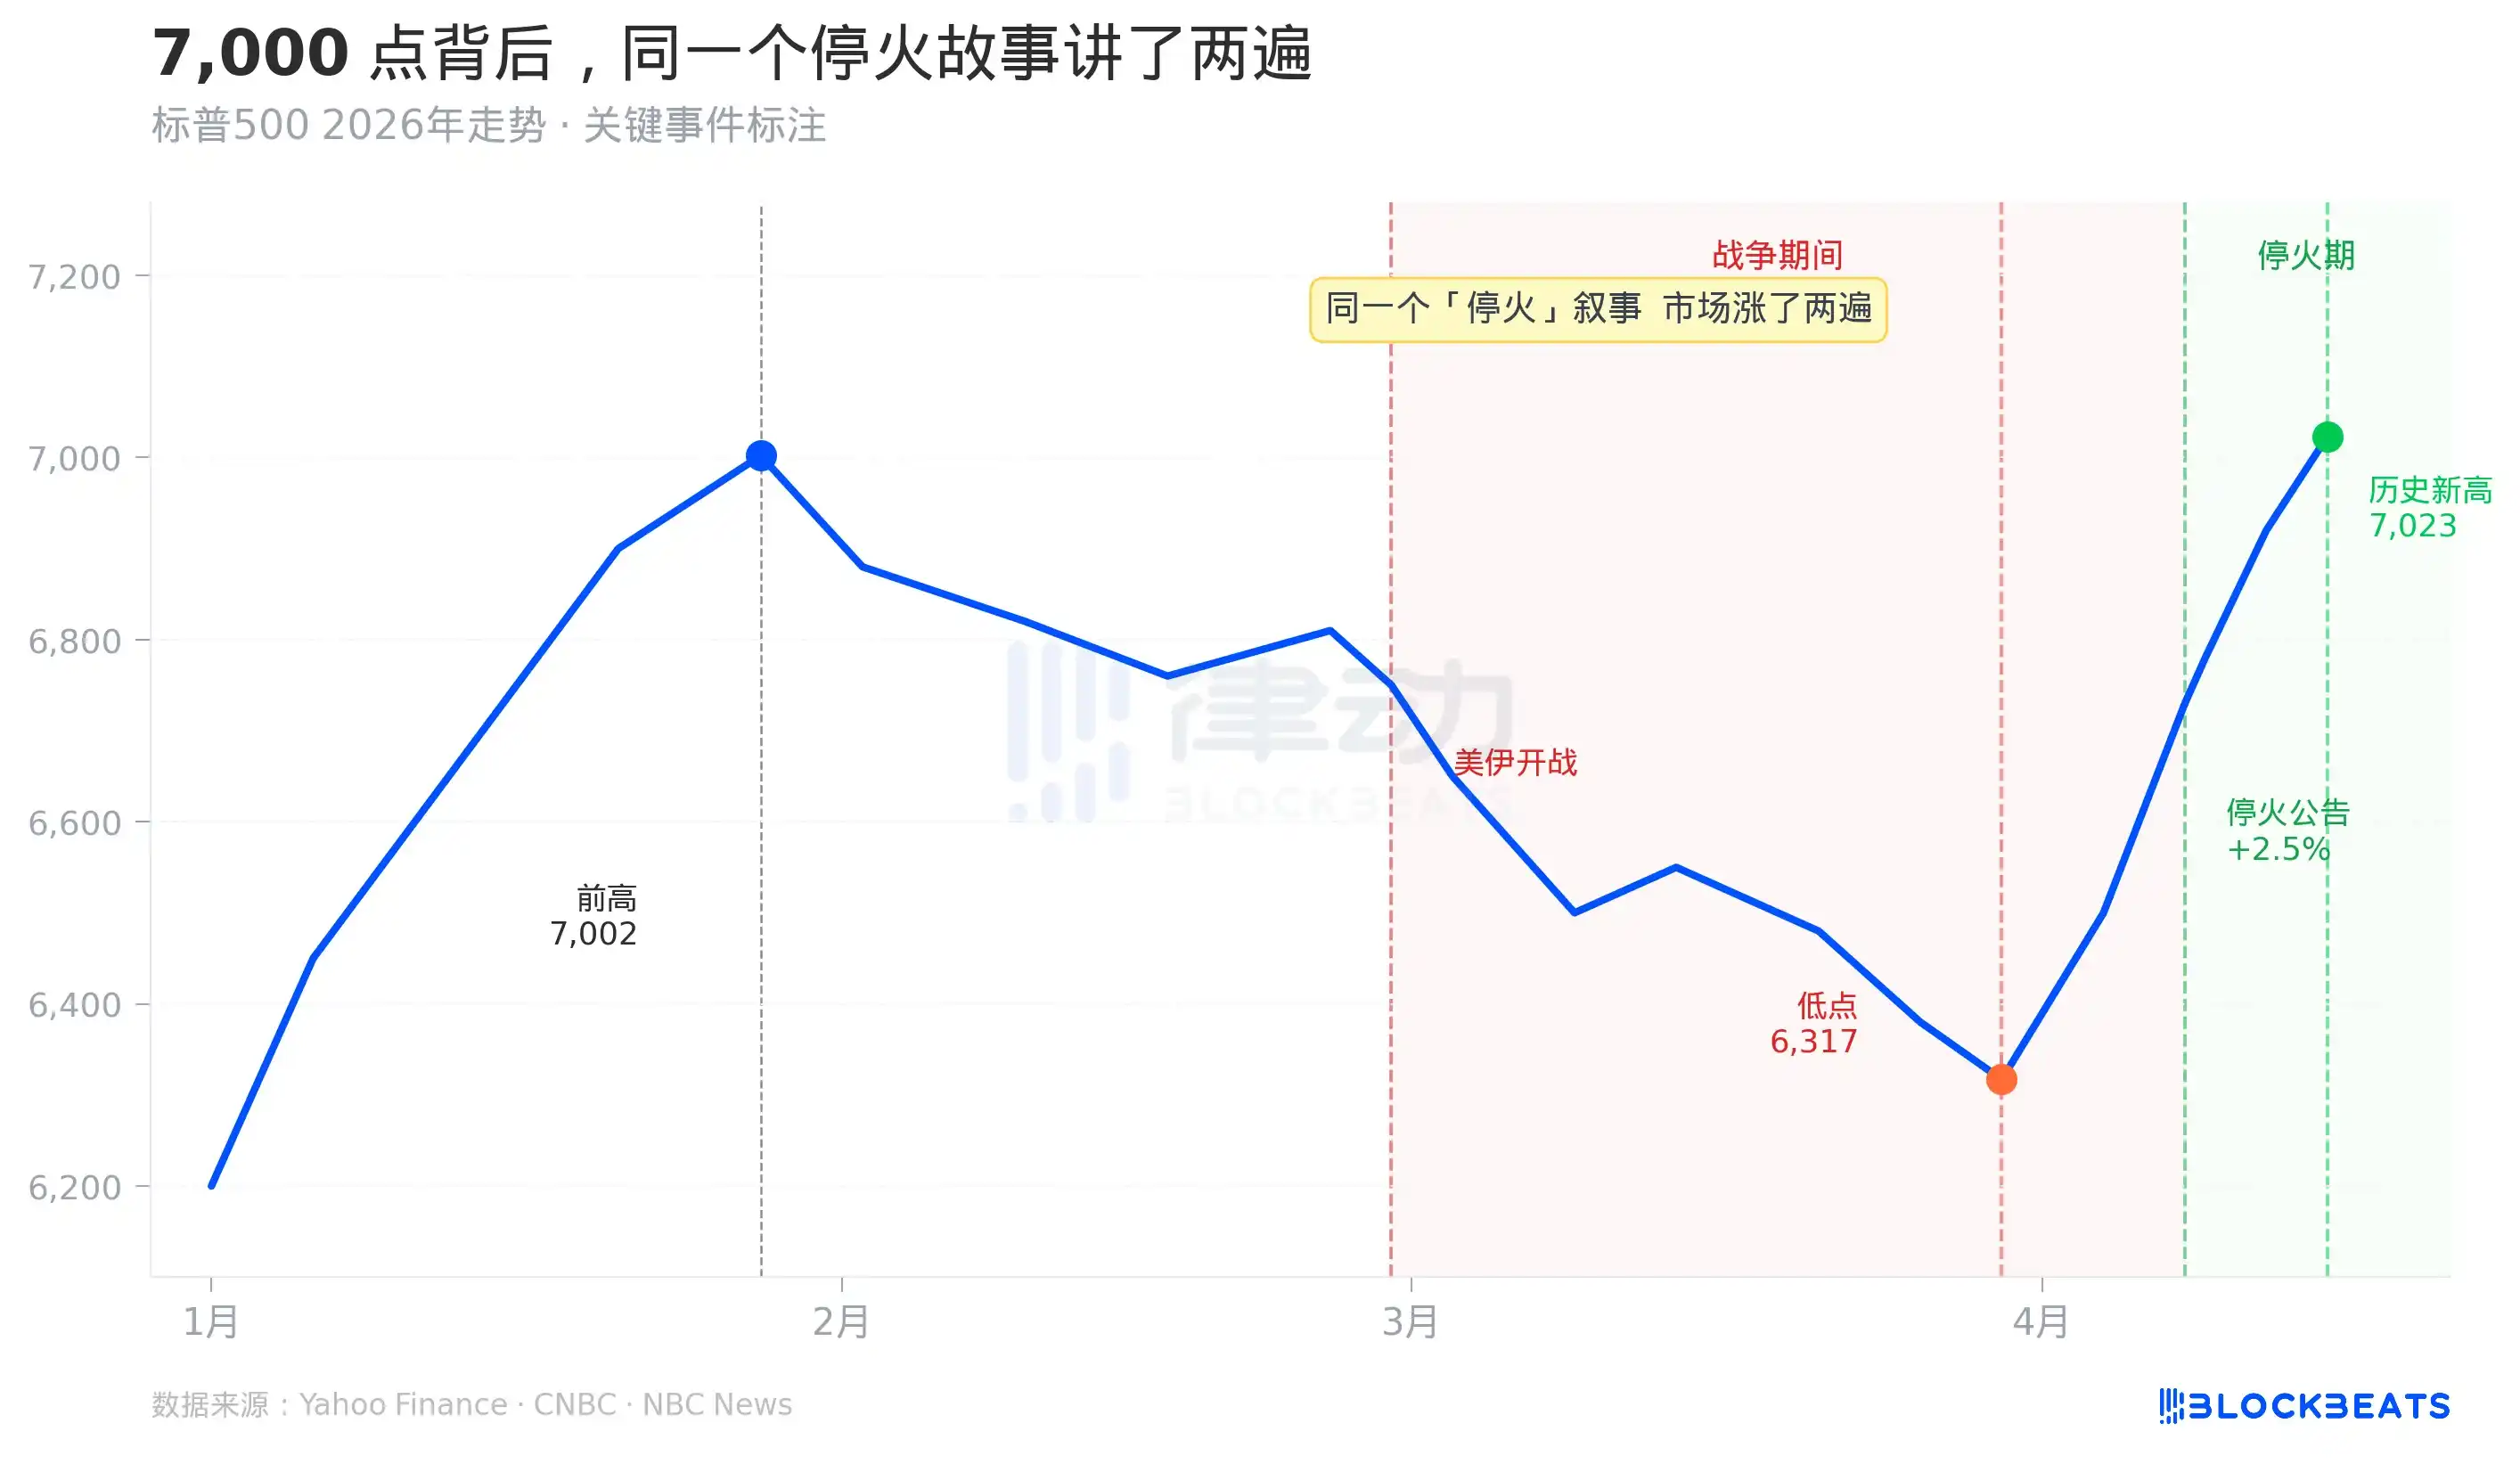
As shown in Chart 1, the two sharp rallies correspond to symmetrical event annotations, both labeled "increased possibility of ceasefire." It rose the first time, and then rose again the second time. As of April 15, when the new record high was set, the two-week temporary ceasefire agreement had not yet expired, and not a word of a permanent peace agreement had been signed.

What scenario is the market pricing in? Not "the end of the war," but "the possibility that the war could end." This expectation was priced—twice.

The Fear Index Is Lower Than Before the War

Even more counterintuitive is the number for the VIX, the index Wall Street uses to measure market panic.

When the war started on February 28, the VIX jumped from around 16 to touch 35.3 intraday on March 9. This aligns with common sense: war is a risk, and the market prices in uncertainty.

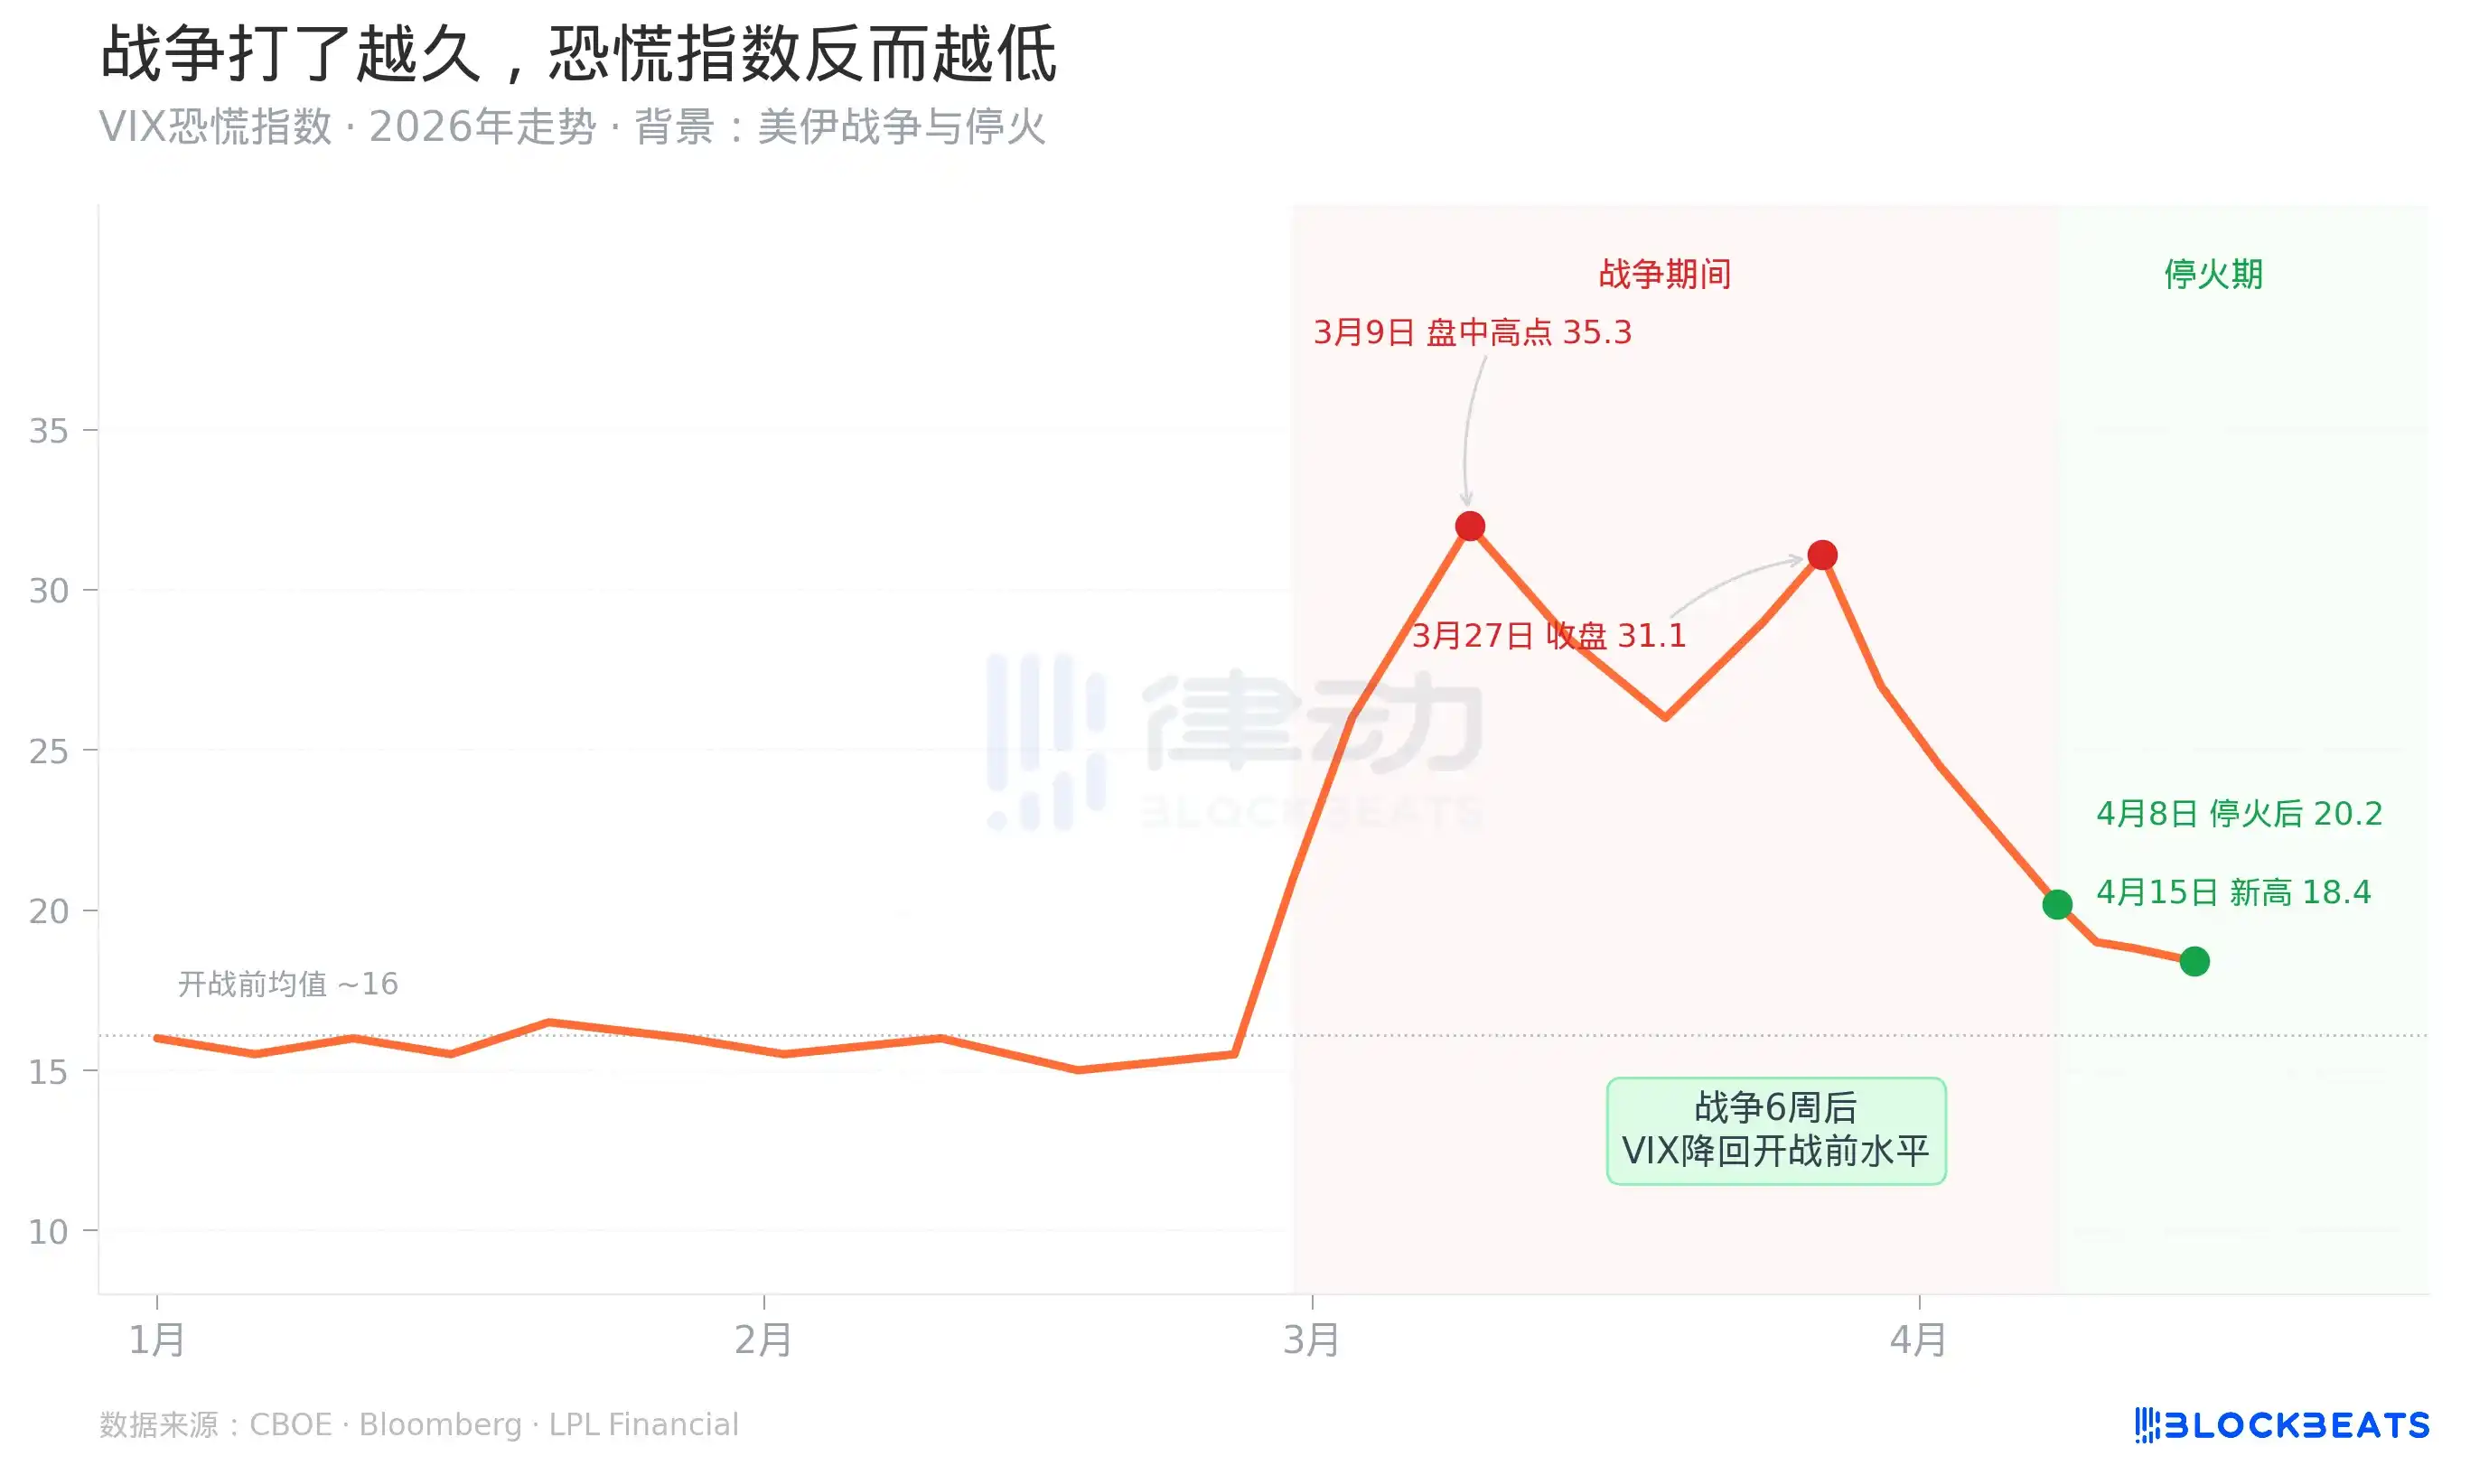
But the subsequent trend defies common sense. Starting from March 9, even as the war continued, oil prices rose, and the Senate voted on whether to authorize war powers, the VIX steadily declined. By April 15, the day the S&P hit its new record high, the VIX closed at around 18.4, lower than its level before the war started on February 28.

What does this mean? It means the market has reclassified this war from a "source of uncertainty" to a "calculable risk." Within six weeks, an ongoing war went from a "panic event" to "quarterly raw material."

This was achieved by a very specific financial mechanism. According to a CNBC report, JPMorgan's Q1 2026 trading division revenue reached $11.6 billion, a historical record, up 20% year-over-year. Fixed income division revenue was $7.1 billion, primarily driven by commodities, currency, and emerging market trading—precisely the areas where the Iran war generated the most "volatility."

In other words, while ordinary investors were feeling fear, professional institutions were harvesting volatility as profit. The more efficiently this mechanism operates, the more inclined the market is to "digest" the war, and the faster the VIX falls.

The Commercialization of Volatility

On April 15, the same day the S&P 500 hit a record high, the Pentagon announced the deployment of an additional 10,000 troops to the Middle East, and the Senate rejected the war powers authorization bill for the fourth time. These two things happened on the same day, and the market had no reaction to them.

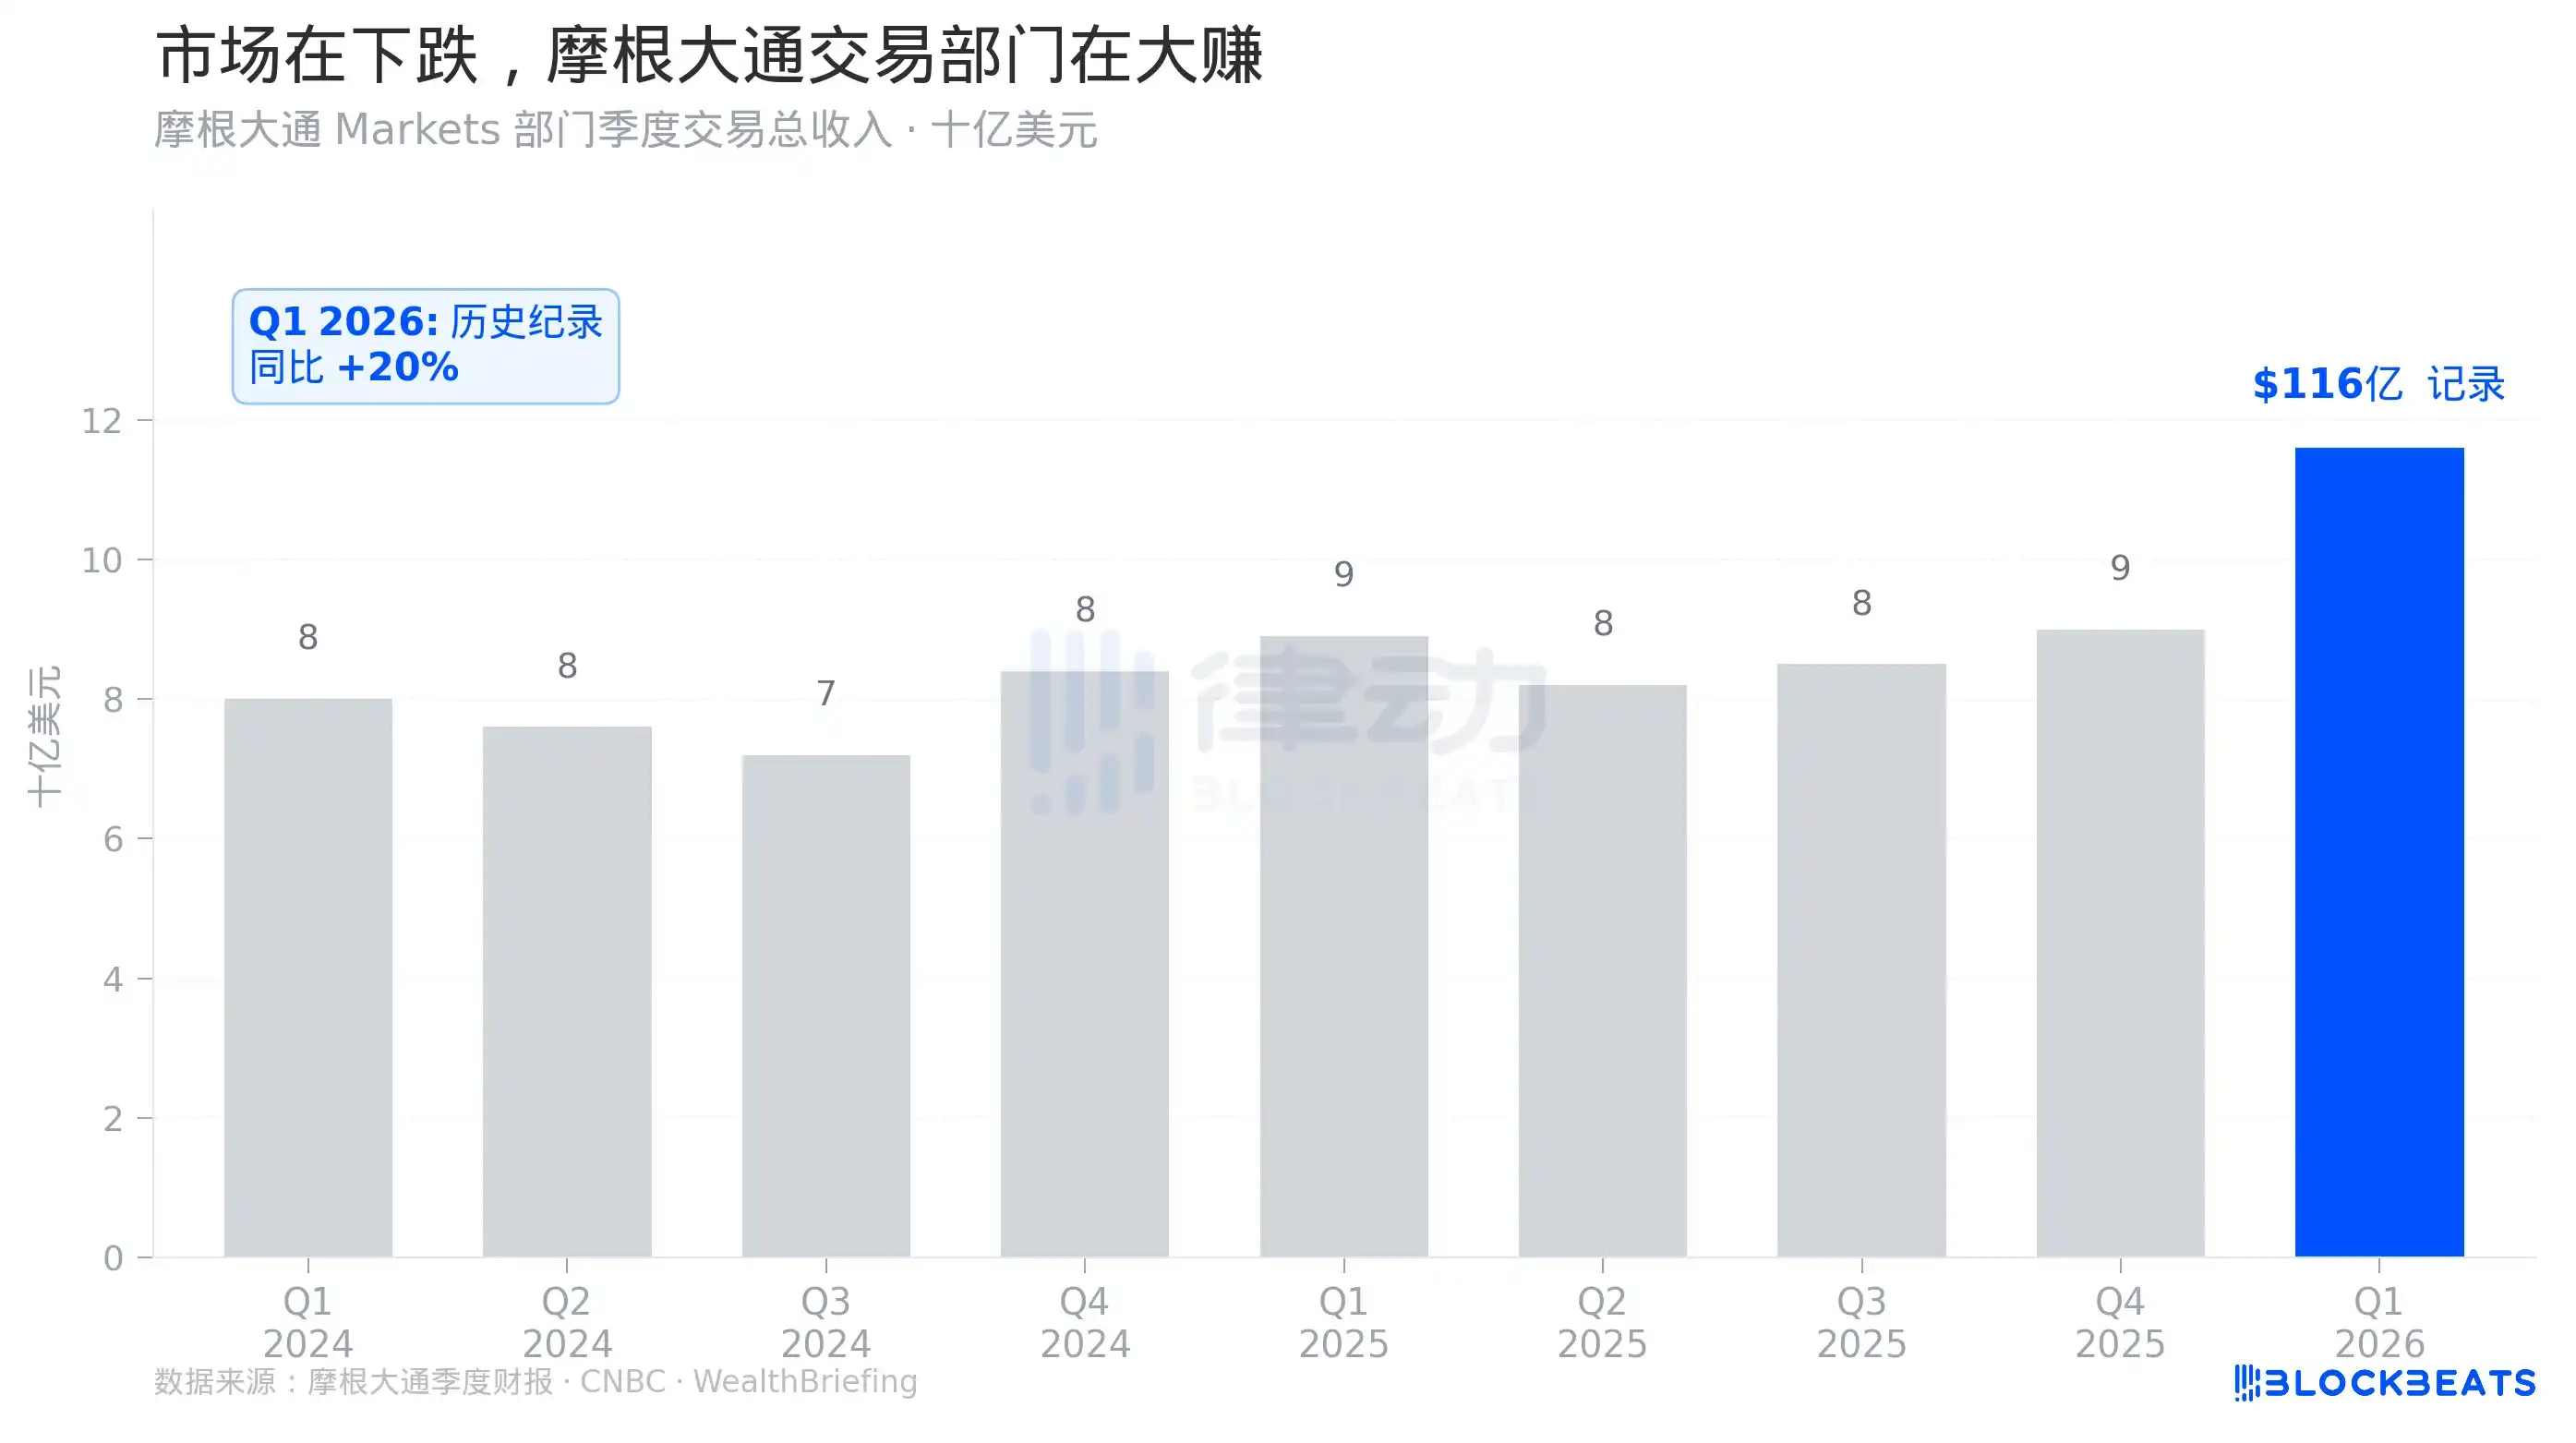
As shown in Chart 4, the bar for JPMorgan's Q1 2026 trading revenue is significantly higher than the previous eight quarters. This isn't a marginal improvement; it's a jump.

Supporting this jump are the profits hedge funds and market makers made from war volatility. According to Goldman Sachs Prime Brokerage data, as of April 14, the net long positions of U.S. hedge funds had turned positive for the first time since the end of 2025. During the same period, according to FINRA data cited by Atwater Malick, U.S. stock margin debt hit a record high of $1.28 trillion, up 36% year-over-year.

Three signals appeared simultaneously: hedge funds shifting from short to long, record leverage, and the market hitting record highs. This is a standard "trading on optimism" pattern.

Understanding this pattern involves looking at the financial infrastructure layer. When Wall Street's market makers, derivatives markets, and hedge funds are sufficiently mature, geopolitical shocks are no longer exogenous, unmeasurable risks but rather raw materials that can be priced, hedged, and commercialized. The Iran war, for JPMorgan's trading desk, is not a threat but an opportunity. The same goes for hedge funds that positioned correctly.

This is the true meaning of the "two screens, two worlds" on April 15. The Pentagon is prolonging the war; the market is pricing the end of the war. These two things are not contradictory because, for market makers, how long the war lasts is not important; whether the volatility is large enough is.

Of course, this mechanism has its fragility. The new high in 11 trading days implies an assumption: the two-week ceasefire will be smoothly extended, Iran nuclear negotiations will proceed as expected, and oil prices will fall. If any of these assumptions prove wrong, there is little buffer in the current pricing. The $1.28 trillion in leveraged funds is also an amplifier on the way down.

7,000 points is a price that only holds in the most optimistic scenario.

Questions liées

QHow many trading days did it take for the S&P 500 to recover to a new all-time high after the Iran War correction, and how does this compare to historical events?

AIt took 11 trading days for the S&P 500 to recover to a new all-time high after the Iran War correction. This is significantly faster than historical events such as the COVID-19 pandemic (103 days), the Gulf War (87 days), the 2011 US debt crisis (106 days), and even the 2022 Russia-Ukraine conflict (18 days).

QWhat was the primary narrative driving the market correction and subsequent rapid recovery during the Iran War event?

AThe primary narrative driving the market correction was 'ceasefire expectations' rather than a deterioration in economic fundamentals. The market fell due to uncertainty, not corporate earnings. When ceasefire news emerged, the uncertainty was quickly priced out, leading to a rapid recovery without the need to wait for quarterly earnings data to rebuild confidence.

QWhat unusual pattern was observed in the VIX (Volatility Index) during the Iran War, and what does it signify?

AThe VIX spiked from around 16 to 35.3 at the start of the war but then steadily declined, closing at approximately 18.4 by April 15—lower than its pre-war level. This indicates that the market rapidly reclassified the war from a source of 'uncertainty' to a 'calculable risk,' effectively commercializing the volatility it generated.

QHow did major financial institutions like JPMorgan perform during Q1 2026, and what was the driver behind this performance?

AJPMorgan's Q1 2026 trading department revenue reached a record $11.6 billion, a 20% year-over-year increase. This was largely driven by its fixed income division, which generated $7.1 billion in revenue from trading commodities, currencies, and emerging markets—areas most affected by the volatility from the Iran War.

QWhat are the potential risks associated with the market's rapid recovery and record-high leverage, as mentioned in the article?

AThe rapid recovery and record-high leverage of $1.28 trillion in margin debt assume optimistic scenarios, such as the temporary ceasefire being extended and Iran nuclear negotiations progressing smoothly. If any of these assumptions fail, the highly leveraged market has little buffer, and the same leverage that amplified gains could exacerbate losses in a downturn.

Lectures associées

En trois mois, 35 milliards de yuans, les investisseurs se disputent l'"OpenAI du monde physique"

Une course effrénée des investisseurs s'engage vers l'AGI physique. La start-up chinoise Jijia Shijie (Excellent Vision) vient de boucler un financement de 3,5 milliards de yuans en seulement trois mois, portant sa valorisation à plus de 10 milliards. Dirigée par Huang Guan, un docteur de 30 ans de l'Université Tsinghua, l'entreprise attire un large éventail de fonds d'investissement nationaux et internationaux. La stratégie de Jijia Shijie repose sur un système en « double pyramide » combinant algorithmes et données, et centré sur un « modèle du monde » pour comprendre et interagir avec l'environnement physique. Ses modèles phares, GigaBrain et GigaWorld, ont obtenu des premières places dans des benchmarks mondiaux. La société vise le « moment GPT-3 » de l'AGI physique, où des capacités émergentes se manifesteront. Concrètement, Jijia Shijie déploie sa technologie sur deux fronts : grand public (robot domestique polyvalent « Shiguang S1 ») et industriel (robots « Maker » pour l'automatisation des usines et modèle de conduite autonome « DriveDreamer »). Ces déploiements génèrent des données et des revenus essentiels pour alimenter la boucle d'amélioration de ses modèles. L'objectif ultime est de dépasser l'AGI purement numérique pour créer une intelligence capable d'agir dans le monde physique, remodelant potentiellement les modes de production et la vie quotidienne. Les investisseurs parient que ce futur est proche.

marsbitIl y a 5 mins

En trois mois, 35 milliards de yuans, les investisseurs se disputent l'"OpenAI du monde physique"

marsbitIl y a 5 mins

Quel lien existe entre Huang Zheng, le fondateur de Pinduoduo, et la blockchain ?

L'auteur de l'article explore le lien entre Huang Zheng, fondateur de Pinduoduo, et la technologie blockchain, à travers une réflexion inspirée par l'essai de Huang « Inverser le capitalisme ». L'article explique que le modèle économique fondamental de Pinduoduo est une « affaire d'assurance » basée sur la gestion de l'« incertitude ». Huang Zheng observe que les capitaux tendent à s'accumuler chez les riches car ils peuvent absorber les incertitudes (comme les risques de maladie ou de perte d'emploi) que les plus pauvres paient pour éviter via des assurances ou des achats sécurisés. Le concept de Pinduoduo, le « group buying » (achat groupé), fonctionne comme une « assurance inversée ». Il agrège la demande préalable d'un grand nombre de consommateurs pour créer une commande certaine et massive, permettant aux usines de réduire le risque de surproduction. Cette certitude permet aux fabricants de baisser leurs prix, faisant ainsi refluer une partie de la valeur vers les consommateurs. Le lien avec la blockchain apparaît comme la pièce manquante pour perfectionner ce modèle. Le principal défi de « l'assurance inversée » est que l'engagement individuel d'un consommateur n'est pas crédible ou coûteux à faire respecter. La blockchain, via ses contrats intelligents (smart contracts), pourrait résoudre ce problème en rendant les engagements (comme une intention d'achat) contraignants, vérifiables et exécutables automatiquement, sans intermédiaire. Huang Zheng lui-même s'interroge : la blockchain n'est-elle pas idéalement conçue pour ce type d'« assurance inversée » ? En conclusion, l'article compare deux voies pour créer de la certitude : la voie « Pinduoduo », qui utilise la masse pour aplanir l'incertitude, et la voie « Bitcoin », qui verrouille les règles par un code inviolable, remplaçant la confiance en une institution par la confiance en un protocole.

链捕手Il y a 1 h

Quel lien existe entre Huang Zheng, le fondateur de Pinduoduo, et la blockchain ?

链捕手Il y a 1 h

Le magnat du stockage qui a conquis des milliers de milliards de territoire ne deviendra jamais l'homme le plus riche

Fondateur de GigaDevice et ChangXin Technology, Zhu Yiming est une figure majeure de l'industrie chinoise des puces mémoire. Malgré la valeur boursière potentielle de ses entreprises (ChangXin visant les 1 000 milliards de yuans, GigaDevice valant 340 milliards), sa fortune personnelle reste limitée en raison de sa faible participation directe (moins de 3% dans ChangXin). GigaDevice (兆易创新), créée en 2005, a débuté avec des NOR Flash, profitant du désengagement des géants comme Samsung pour capturer des parts de marché (20% mondial en 2025). L'entreprise a diversifié ses activités vers les microcontrôleurs (MCU), les capteurs et les puces analogiques, mais les mémoires et MCU représentent 92% de son chiffre d'affaires. Son modèle économique Fabless (sans usine) et sa focalisation sur les segments de moyenne et basse gamme lui ont permis de maintenir une rentabilité solide, avec des marges brutes autour de 40%. Cependant, l'industrie des semi-conducteurs mémoire est très cyclique, comme en témoignent les fluctuations de ses bénéfices nets. L'article souligne que le modèle Fabless présente une vulnérabilité face aux cycles sévères du secteur. C'est pourquoi Zhu Yiming a cofondé ChangXin Technology en 2016 avec le gouvernement de Hefei, adoptant un modèle IDM (intégré) nécessitant des investissements massifs (équipements évalués à 169,3 milliards de yuans fin 2025). Son engagement personnel – renoncement au salaire, partage des incitations actions, verrouillage prolongé de ses parts – a été crucial pour sécuriser le financement public. En définitive, bien que Zhu Yiming ait "bâti un empire" dans le stockage, sa stratégie de dilution du capital pour assurer le développement de ses entreprises le place loin des tout premiers rangs des fortunes individuelles chinoises.

marsbitIl y a 1 h

Le magnat du stockage qui a conquis des milliers de milliards de territoire ne deviendra jamais l'homme le plus riche

marsbitIl y a 1 h

Une faille de gouvernance sur Token Of Power a drainé 1,58 million de dollars en WETH, selon TRM

La société d'intelligence blockchain TRM Labs a détaillé une attaque par prise de contrôle de gouvernance contre le protocole Token of Power, drainant environ 1,58 million de dollars en WETH. Selon l'analyse, l'attaquant a exploité une faille dans la configuration DAO Aragon du protocole : l'absence de délai d'exécution (timelock). Cela lui a permis de proposer, voter et exécuter une action de gouvernance malveillante en un seul bloc. L'opération aurait été financée avec 662 ETH retirés de Tornado Cash. L'attaquant a acheté suffisamment de jetons TOP pour obtenir le pouvoir de vote majoritaire, a frappé 10 milliards de nouveaux TOP et les a échangés contre du WETH via un pool Balancer avant de blanchir les fonds via Tornado Cash. Cette attaque illustre comment la conception de la gouvernance peut devenir un risque de sécurité direct. Sans timelock pour donner aux utilisateurs et aux équipes de sécurité un temps de réaction, un vote hostile peut être exécuté instantanément. Pour les utilisateurs de la DeFi, cet incident rappelle que les risques ne se limitent pas aux bugs de code smart-contract. Les paramètres de gouvernance, les contrôles des trésoreries et les seuils de vote sont tout aussi critiques. L'affaire montre également comment les mixers et les pools de liquidités peuvent être utilisés dans le sillage d'une exploitation. La suite à surveiller concerne les mouvements potentiels des fonds volés et d'éventuels détails de correction de la part du protocole, d'Aragon ou des fournisseurs de liquidités affectés.

bitcoinistIl y a 4 h

Une faille de gouvernance sur Token Of Power a drainé 1,58 million de dollars en WETH, selon TRM

bitcoinistIl y a 4 h

XRP Ledger : les frais journaliers tombent sous la barre des 400 $, la question de l'activité du réseau revient sur le tapis

Le réseau XRP Ledger (XRPL) suscite à nouveau des interrogations après que des données ont montré que ses frais quotidiens totaux sont tombés en dessous de 400 dollars. Si des frais bas correspondent à la conception du réseau et sont souvent présentés comme un atout pour l'accessibilité, ils peuvent aussi être un indicateur de l'activité et de la demande réelle. Ce chiffre hebdomadaire d'environ 3 100 dollars brûlés contraste fortement avec des blockchains comme Ethereum ou Bitcoin. Pour les partisans, cela confirme l'efficacité du XRPL. Pour les critiques, cela peut soulever des questions sur le niveau d'adoption transactionnelle à haute valeur, un point central pour le récit des paiements autour du XRP. Les données sur les frais permettent ainsi d'évaluer si l'activité on-chain correspond aux ambitions du réseau. Il est important de ne pas tirer de conclusions excessives : une journée à faibles frais ne signifie pas un dysfonctionnement. Cela alimente simplement le débat sur l'utilisation du XRPL, d'autant plus dans le contexte des initiatives de Ripple comme le RLUSD ou les paiements par agents IA. Il convient désormais d'observer si les frais rebondissent et si les comptes de transactions confirment cette tendance. Dans le paysage crypto actuel, où l'infrastructure et l'utilité gagnent en importance, cette information mérite d'être rapportée comme un point de données factuel pour une conversation de marché équilibrée, en évitant tout sensationnalisme.

bitcoinistIl y a 6 h

XRP Ledger : les frais journaliers tombent sous la barre des 400 $, la question de l'activité du réseau revient sur le tapis

bitcoinistIl y a 6 h

Trading

Spot
Futures

Articles tendance

Comment acheter WAR

Bienvenue sur HTX.com ! Nous vous permettons d'acheter WAR (WAR) de manière simple et pratique. Suivez notre guide étape par étape pour commencer votre parcours crypto.Étape 1 : Création de votre compte HTXUtilisez votre adresse e-mail ou votre numéro de téléphone pour ouvrir un compte sur HTX gratuitement. L'inscription se fait en toute simplicité et débloque toutes les fonctionnalités.Créer mon compteÉtape 2 : Choix du mode de paiement (rubrique Acheter des cryptosCarte de crédit/débit : utilisez votre carte Visa ou Mastercard pour acheter instantanément WAR (WAR).Solde :utilisez les fonds du solde de votre compte HTX pour trader en toute simplicité.Prestataire tiers :pour accroître la commodité d'utilisation, nous avons ajouté des modes de paiement populaires tels que Google Pay et Apple Pay.P2P :tradez directement avec d'autres utilisateurs sur HTX.OTC (de gré à gré) : nous offrons des services personnalisés et des taux de change compétitifs aux traders.Étape 3 : stockage de vos WAR (WAR)Après avoir acheté vos WAR (WAR), stockez-les sur votre compte HTX. Vous pouvez également les envoyer ailleurs via un transfert sur la blockchain ou les utiliser pour trader d'autres cryptos.Étape 4 : tradez des WAR (WAR)Tradez facilement WAR (WAR) sur le marché Spot de HTX. Il vous suffit d'accéder à votre compte, de sélectionner la paire de trading, d'exécuter vos trades et de les suivre en temps réel. Nous offrons une expérience conviviale aux débutants comme aux traders chevronnés.

528 vues totalesPublié le 2024.12.11Mis à jour le 2026.06.02

Comment acheter WAR

Discussions

Bienvenue dans la Communauté HTX. Ici, vous pouvez vous tenir informé(e) des derniers développements de la plateforme et accéder à des analyses de marché professionnelles. Les opinions des utilisateurs sur le prix de WAR (WAR) sont présentées ci-dessous.

活动图片