LayerZero rallies 11% as market activity overheats: Can ZRO push past $2.28?

ambcryptoPublié le 2026-03-17Dernière mise à jour le 2026-03-17

Résumé

LayerZero (ZRO) surged over 11% in 24 hours, with trading volume jumping more than 140%, pushing its price toward the key $2.286 resistance level. The token recovered from a February low below $1.60, showing a sequence of higher lows and improved trend stability. Technical indicators like the positive MACD crossover and green histogram bars suggest growing buying momentum. However, spot market data signals overheating, with high speculative activity and persistent taker sell dominance creating short-term imbalance. Derivatives data shows higher short liquidations, amplifying volatility. While buyer interest is strong, overcoming the $2.286 barrier remains uncertain due to potential selling pressure. A breakout depends on sustained demand versus speculative activity.

LayerZero rallied more than 11% in the last 24 hours as trading activity intensified and 24-hour volume jumped over 140%, pushing ZRO toward key resistance.

Rising participation has pushed ZRO back into focus across spot and derivatives markets. Buyers have returned aggressively after weeks of choppy consolidation.

At the time of press, LayerZero [ZRO] traded at around $2.20, reflecting renewed speculative interest. Volume expansion usually signals strong participation; however, overheated conditions sometimes follow rapid spikes.

Traders therefore continue monitoring whether this surge reflects sustained demand or short-term speculation.

ZRO climbs toward major resistance barrier

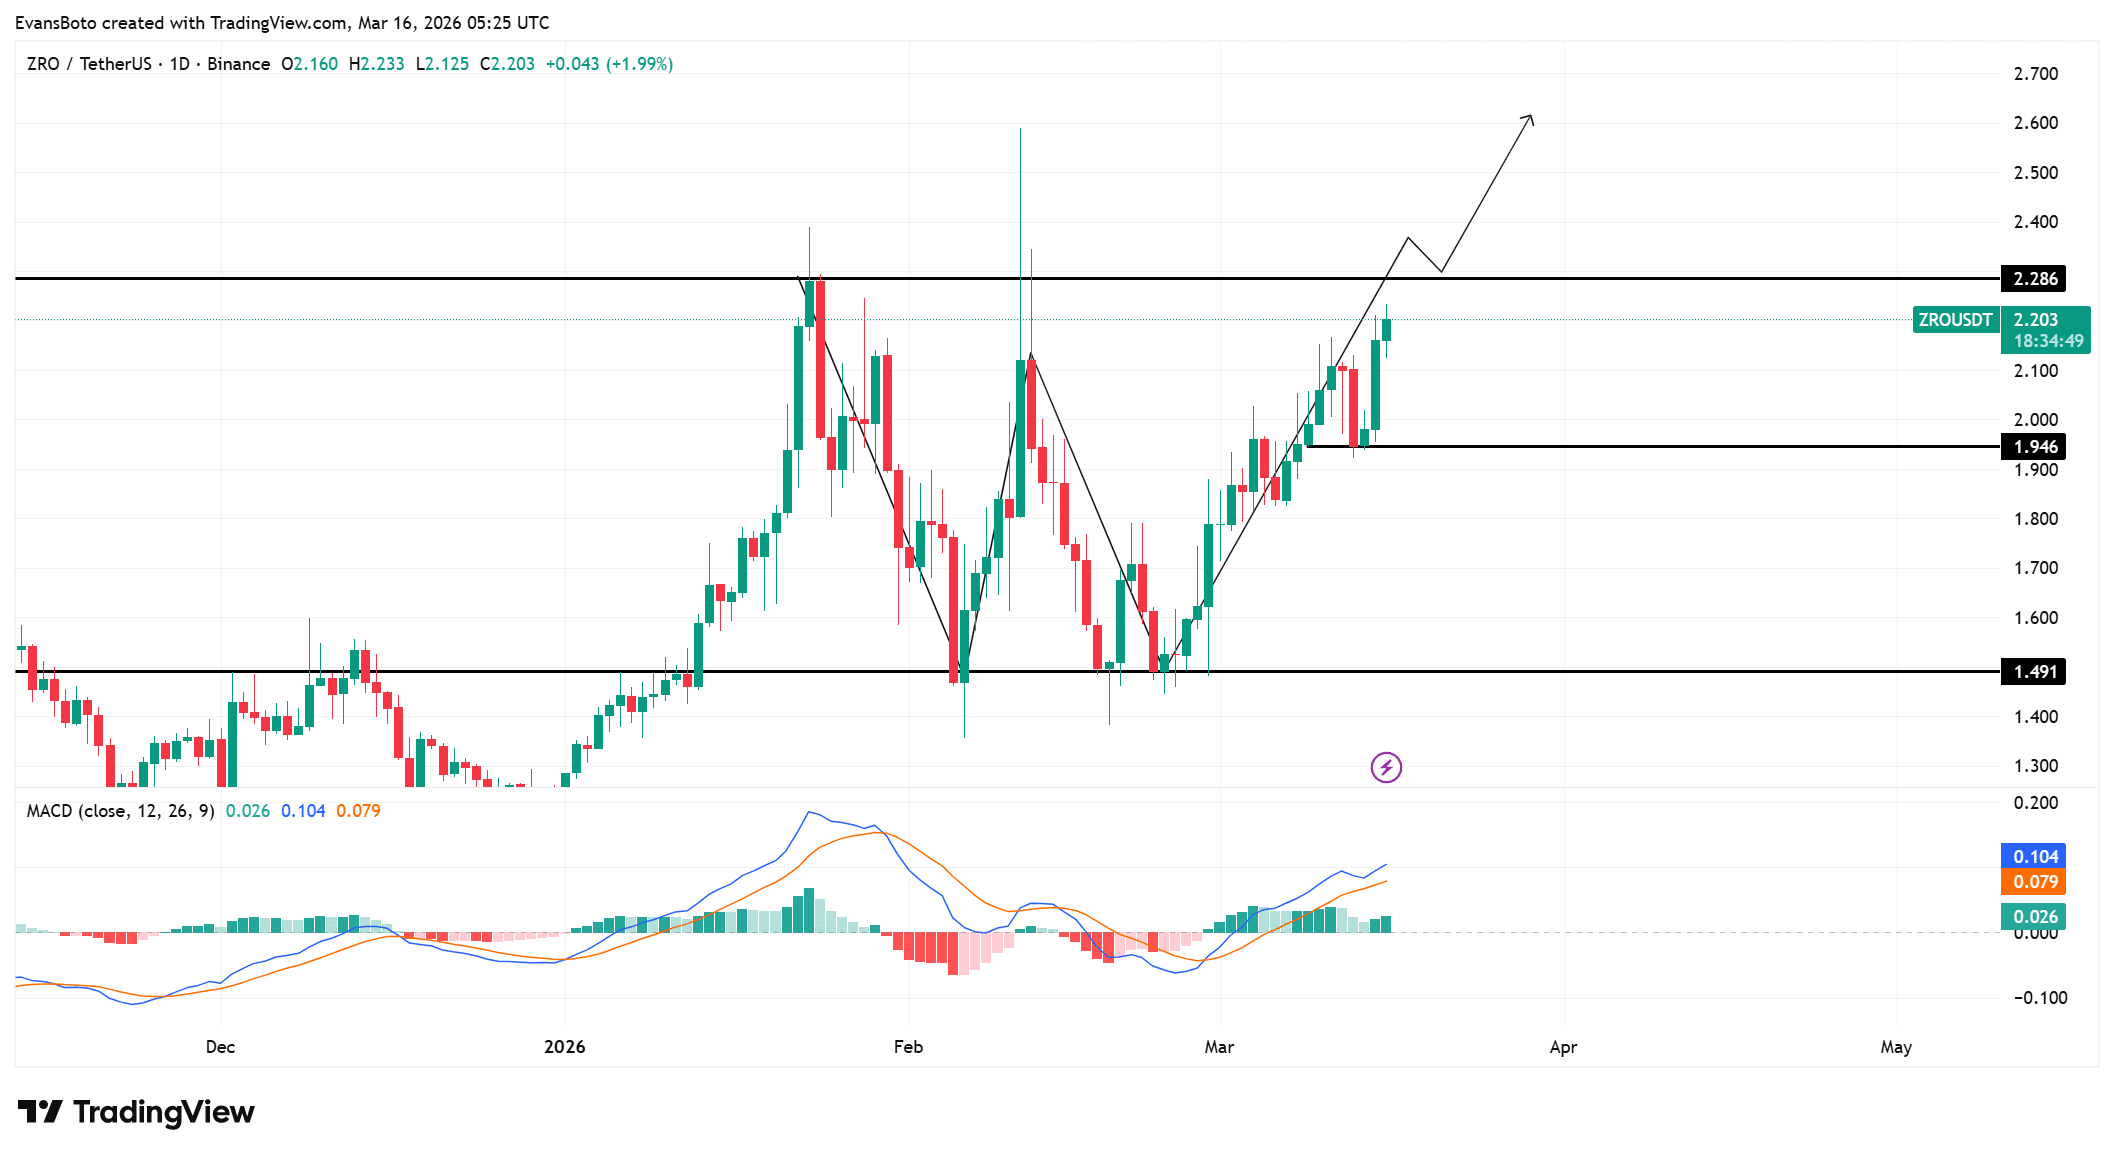
Recent price action shows LayerZero recovering strongly from the $1.491 support level and steadily advancing toward the $2.286 resistance zone.

Buyers regained control after the February decline pushed the price briefly below $1.60. Since then, a sequence of higher lows has developed across the daily chart.

This structure reflects improving trend stability. Price has already reclaimed the intermediate $1.946 level, which now acts as a support pivot.

However, the $2.286 region represents a major barrier where previous rallies stalled earlier this year. Sellers previously defended that zone aggressively.

If buyers maintain pressure near current levels, price could attempt another breakout toward higher targets.

The MACD line currently sits around 0.104, while the signal line remains near 0.079, confirming a positive crossover.

Histogram bars have also turned green near 0.026, showing strengthening buying pressure over recent sessions. This configuration normally appears during early trend recovery phases.
Source: TradingView

Spot market overheating raises caution signals

While price strength has attracted buyers, Spot market data suggests traders have started pushing activity into overheated territory.

The Spot Volume Bubble Map currently signals overheating conditions following the rapid surge in trading activity. Large bursts of volume often appear when speculative interest intensifies.

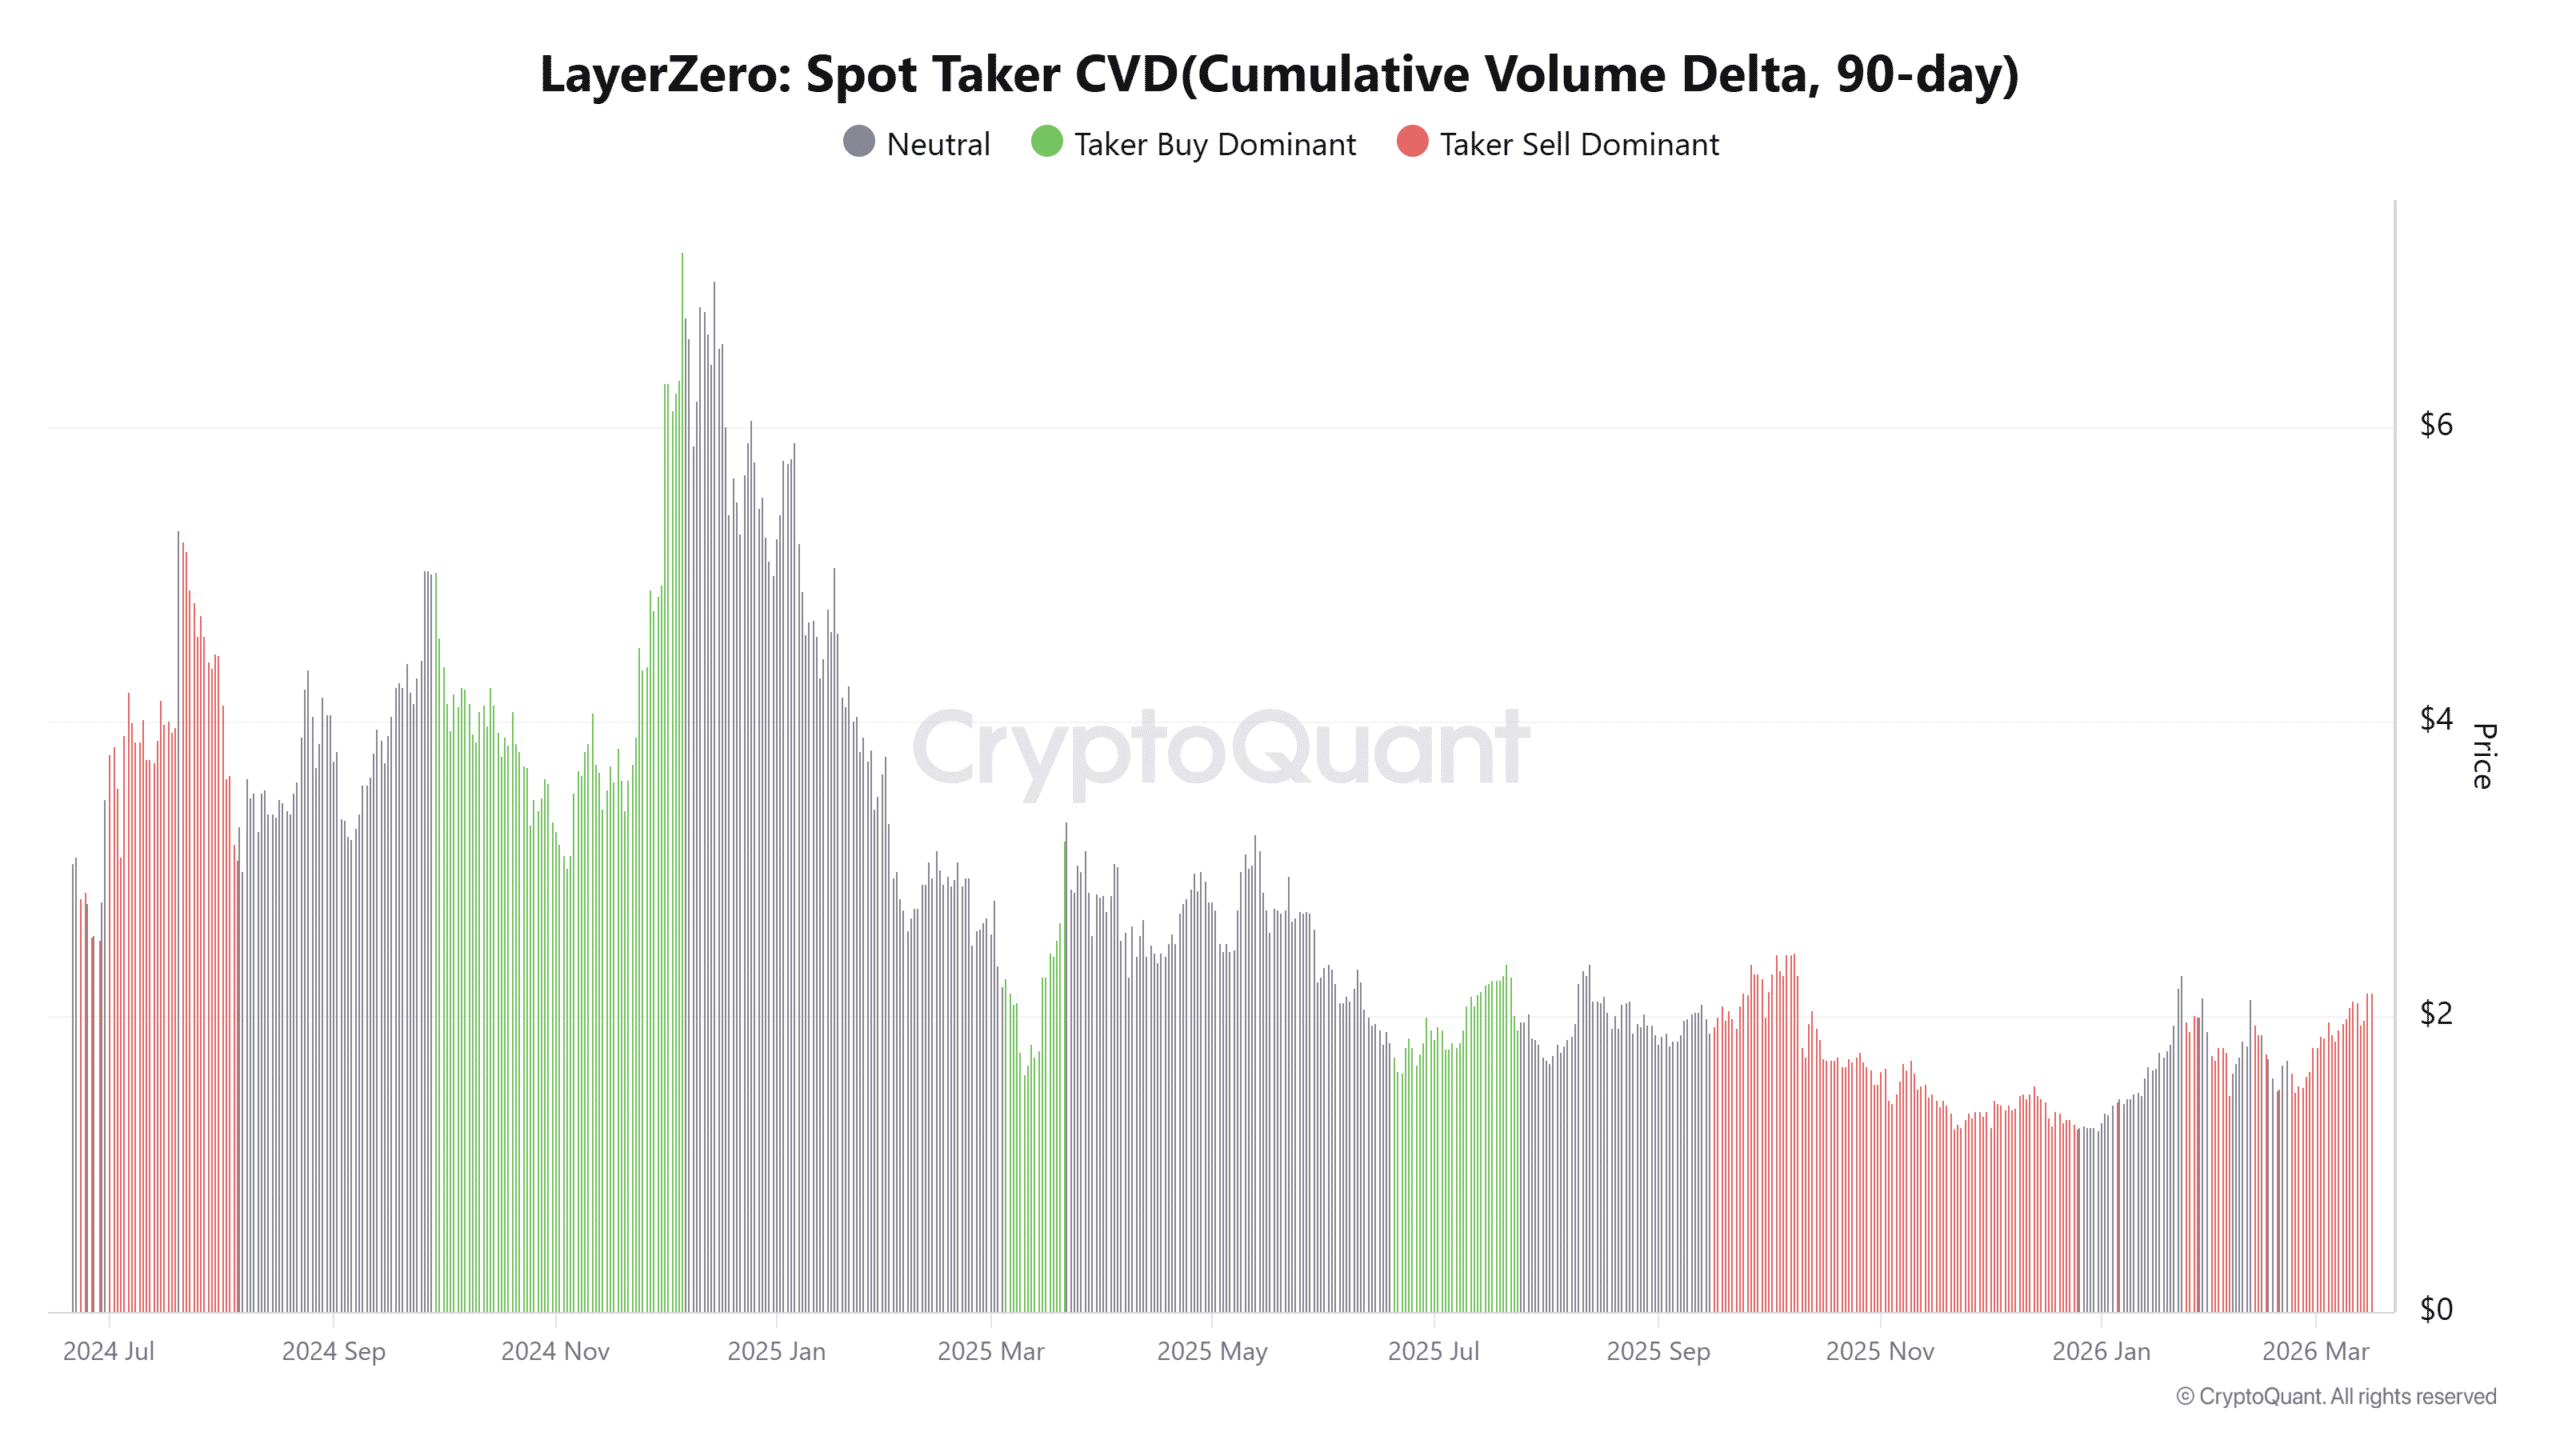
However, the 90-day Spot Taker CVD continues reflecting taker sell dominance, indicating that market sell orders still outweigh aggressive buying.

This imbalance creates a conflicting signal for short-term direction. Price rises while sellers remain active, which sometimes leads to brief volatility spikes.
Source: CryptoQuant

Short liquidations hint at growing volatility

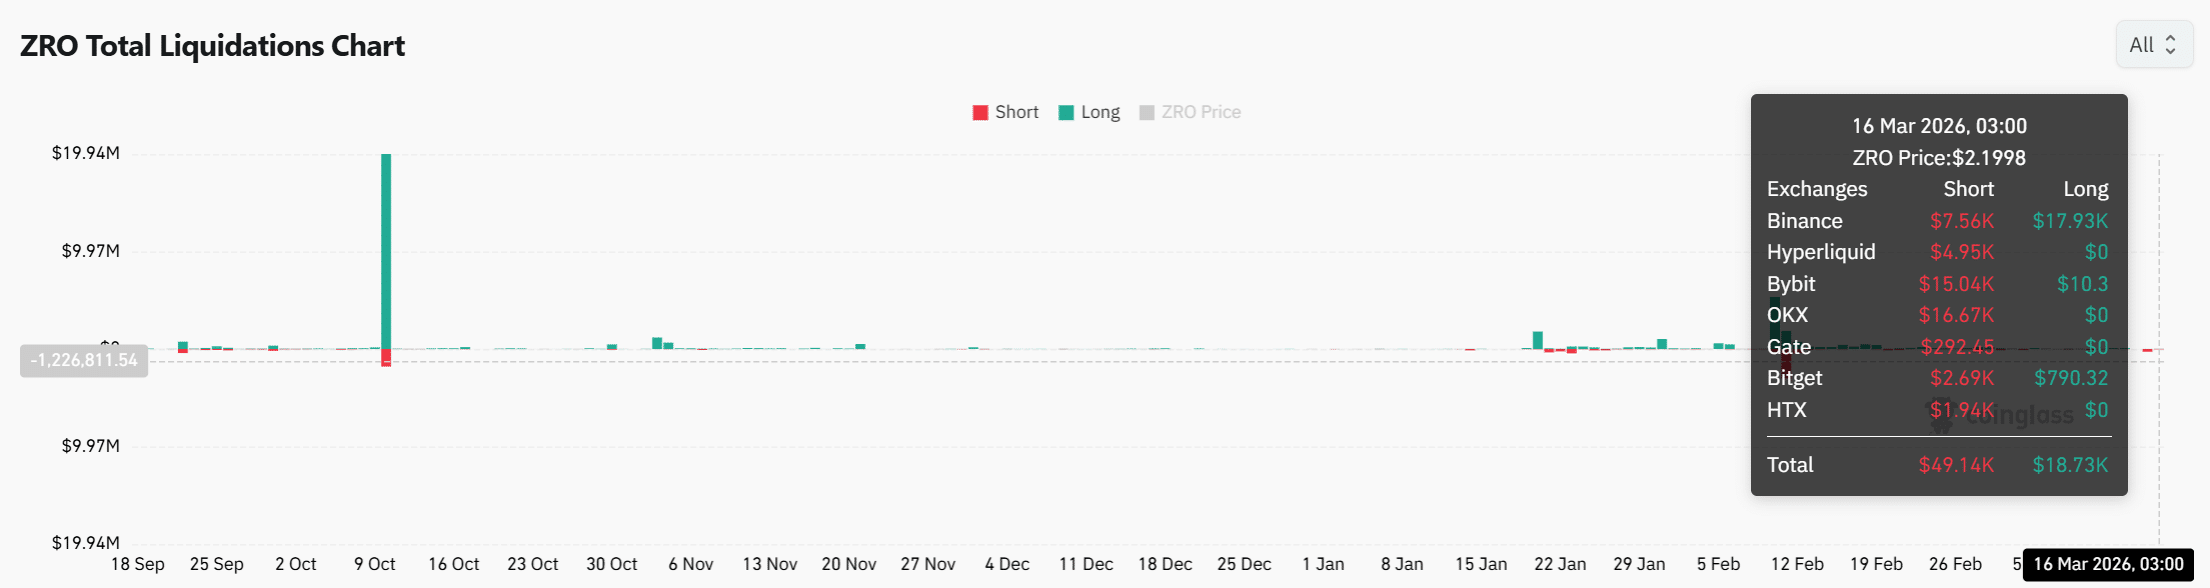
Derivatives data has also started reflecting the renewed price expansion across LayerZero markets. The total liquidation chart shows short positions absorbing slightly higher pressure during the latest move.

At the latest data point, short liquidations reached about $49.14K, while long liquidations remained near $18.73K.

This imbalance shows that rising prices have forced several short traders to close positions. Forced exits usually amplify volatility because liquidations trigger additional buying pressure.

Exchanges such as OKX and Bybit have recorded some of the largest short liquidations. However, the overall scale of liquidations remains moderate compared with earlier spikes.
Source: CoinGlass

LayerZero’s rally has pushed the price close to the $2.286 resistance, while indicators and liquidation data suggest strengthening market activity.

However, overheating spot signals and persistent taker sell dominance introduce short-term uncertainty.

If buyers sustain pressure near current levels, ZRO could challenge resistance again. However, heavy selling activity may still slow the advance before a confirmed breakout.


Final Summary

  • Growing participation has revived LayerZero interest; however, resistance pressure could still challenge sustained upside continuation soon.
  • Rising volatility and strong buyer activity could sustain ZRO’s recovery if resistance pressure weakens across markets.


Questions liées

QWhat was the percentage increase in LayerZero (ZRO) over the last 24 hours and what key resistance level is it approaching?

ALayerZero rallied more than 11% in the last 24 hours and is approaching the key resistance level of $2.286.

QWhat technical indicator is mentioned as confirming a positive crossover and what does this signal?

AThe MACD indicator is mentioned, with the MACD line at 0.104 and the signal line at 0.079, confirming a positive crossover which is a signal that often appears during early trend recovery phases.

QAccording to the Spot Volume Bubble Map, what condition is the market signaling and what does a 90-day metric show?

AThe Spot Volume Bubble Map is signaling overheating conditions, while the 90-day Spot Taker CVD continues to reflect taker sell dominance, indicating that market sell orders still outweigh aggressive buying.

QWhat does the imbalance between short and long liquidations suggest about recent market activity?

AThe imbalance, with short liquidations at $49.14K and long liquidations at $18.73K, suggests that rising prices have forced short traders to close positions, which can amplify volatility by triggering additional buying pressure.

QWhat are the two potential outcomes for ZRO's price mentioned in the final summary regarding resistance?

AThe final summary states that if buyers sustain pressure, ZRO could challenge the $2.286 resistance again, but heavy selling activity may slow the advance before a confirmed breakout occurs.

Lectures associées

Fujian Jinjiang, un super-licorne de stockage dans l'ombre

Voici un résumé de l'article en français : Au cœur de la ville de Jinjiang, Fujian, connue pour ses chaussures de sport, se cache Fujian Jinhua Integrated Circuit Co., un acteur majeur mais discret dans le domaine de la mémoire DRAM. Fondée en 2016 avec une mission nationale de briser le monopole de Samsung, SK Hynix et Micron, l'entreprise a connu un départ prometteur grâce à un partenariat technologique avec United Microelectronics Corporation (UMC) de Taïwan et la direction de Chen Zhengkun, ancien cadre de Micron. Cependant, son développement a été brutalement interrompu en 2018 lorsque les États-Unis l'ont placée sur la liste des entités et ont engagé des poursuites pénales pour espionnage économique, alléguant le vol de secrets commerciaux de Micron. Cette sanction a gelé sa chaîne d'approvisionnement et paralysé sa production pendant près de cinq ans. Malgré un verdict d'innocence rendu par un tribunal américain en février 2024, Jinhua reste sous sanction. Pendant cette période difficile, soutenue par les autorités provinciales et locales, l'entreprise a travaillé à reconstruire sa ligne de production en réduisant sa dépendance aux technologies américaines. Elle se concentre désormais sur le marché des DRAM de niche (pour téléviseurs intelligents, routeurs, etc.) avec une capacité mensuelle d'environ 40 000 plaquettes. Bien que ses performances (chiffre d'affaires annuel d'environ 2 milliards de yuans) soient loin derrière celles de ses homologues chinois ChangXin Memory Technologies (CXMT) et Yangtze Memory Technologies Corp (YMTC), Jinhua a survécu et maintient sa position. L'histoire de Jinhua s'inscrit également dans la transformation audacieuse de Jinjiang, une ville dont l'économie reposait traditionnellement sur le textile et l'agroalimentaire, vers l'industrie des semi-conducteurs. Cet investissement massif, symbolisant la ténacité de la ville, a donné naissance à un cluster intégré de la filière des puces. Alors que l'industrie mondiale de la mémoire entre dans un super-cycle porté par l'IA, Jinhua, bien que modeste en taille, représente la résilience d'une entreprise ayant résisté à une intense pression géopolitique.

marsbitIl y a 2 h

Fujian Jinjiang, un super-licorne de stockage dans l'ombre

marsbitIl y a 2 h

Trading

Spot
活动图片