After 13% Daily Distribution, Why Did SATA Still Fall?

marsbitPublié le 2026-07-13Dernière mise à jour le 2026-07-13

Résumé

Strive Asset Management's BTC-linked preferred stock SATA transitioned from monthly to daily dividend distributions on June 16, with a current annualized yield of 13%. Despite this change, SATA's price fell approximately 9.9% from June 22 to June 26. The analysis highlights that this decline reflects fundamental credit and structural risks, not simply dividend frequency. SATA represents a perpetual, cumulative preferred equity interest in Strive, not a direct Bitcoin-backed bond. Its dividends depend on Strive's corporate credit and access to capital markets. While Strive's Bitcoin holdings grew from 15,009 to 19,864 BTC between May 12 and June 18, SATA's outstanding shares grew faster (from ~4.96 million to ~7.83 million). Coupled with a drop in BTC price, the pure Bitcoin coverage ratio for SATA's stated amount fell from ~2.44x to ~1.52x. A further ~34.3% decline in BTC to ~$39,416 would bring this coverage to 1.0x. Daily dividends smooth cash flow for investors and reduce dividend-capture trading, but do not eliminate price volatility or credit risk. SATA now trades at a ~12.25% discount to its $100 stated amount, implying a market yield of ~14.81% and a credit spread of ~1,117 bps over SOFR. Key risks include a negative feedback loop if SATA trades below par, making new issuance dilutive; reliance on capital markets for dividend funding despite a ~17-month cash buffer; and the perpetual nature of the security, where dividends can be deferred. In summary, SATA innovates...

Data Note:BTC uses the spot price of approximately $60,005 on June 28. Company holdings and share capital are based on Strive's latest SEC filing submitted on June 22, with data as of June 18. Market prices and company disclosure times are not perfectly synchronized. Calculations of coverage ratios in this article are snapshot estimates.

1. Summary

On June 16, Strive switched SATA's dividend distribution frequency from monthly to each business day.

Strive calls this the first listed security in the US market to pay dividends on each business day. SATA's current annualized dividend yield is 13%; for July 2026, it has declared a daily dividend per share of $0.0493 for 22 business days, totaling $1.0846 monthly.

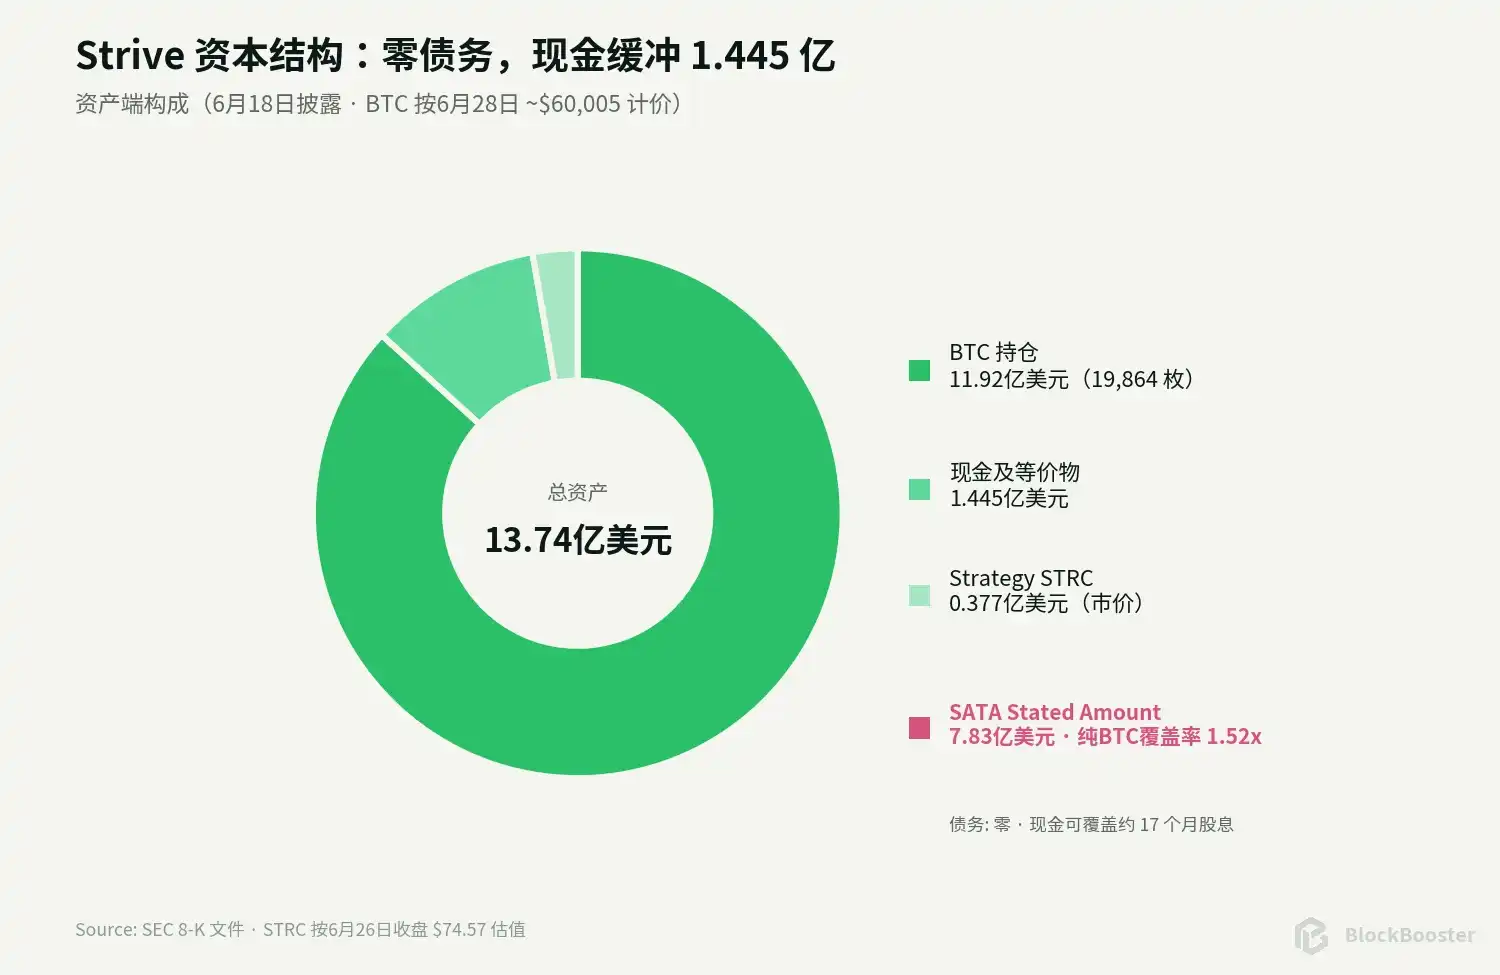
As of June 18, Strive holds 19,864 BTC, $144.5 million in cash, and 505,000 shares of Strategy's STRC Preferred Stock; SATA has 7,829,502 shares issued. Based on a $100 stated amount per share, the principal amount of the preferred stock is approximately $783 million. Using the June 28 BTC price of approximately $60,005, the BTC holding value is about $1.192 billion.

The article's conclusions are as follows:

First, SATA is a layer of corporate preferred equity without a maturity date, whose dividends are deferrable but cumulative. SATA ranks senior to common stock in liquidation but remains junior to company creditors and does not have a direct lien on any specific batch of BTC. Legally, it bears the risk of Strive's corporate credit + BTC balance sheet risk.

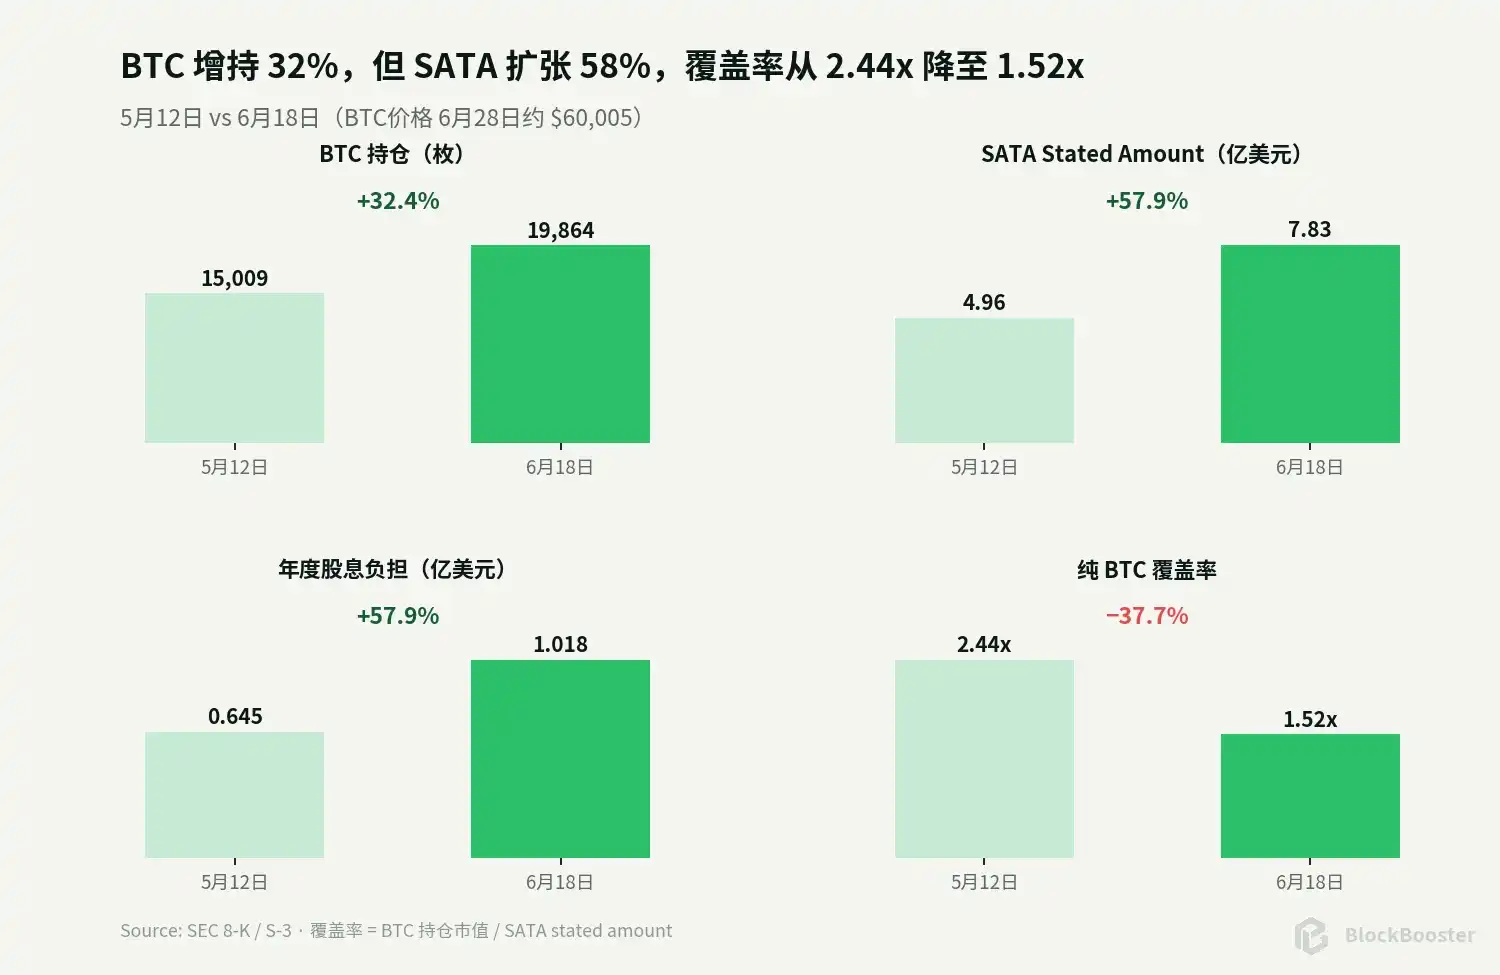
Second, Strive's BTC count continues to grow, but SATA is expanding faster, with coverage ratios significantly compressed compared to May. From May 12 to June 18, BTC holdings increased from 15,009 to 19,864, a rise of about 32.4%; SATA shares increased from 4,959,500 to 7,829,502, a rise of about 57.9%. During the same period, BTC fell from approximately $80,624 to approximately $60,005. The result is that the pure BTC coverage ratio to SATA stated amount decreased from about 2.44x to about 1.52x. If BTC falls another approximately 34.3%, to about $39,416, the pure BTC coverage would drop to 1x.

Third, the cash buffer is substantial but cannot be conflated with collateral. Strive's latest disclosed cash is $144.5 million; valuing the 505,000 STRC shares at STRC's closing price of $74.57 on June 26 gives a value of approximately $37.66 million. The coverage ratio of liquid assets to SATA stated amount is approximately 1.76x.

Fourth, SATA has been repriced by the secondary market. SATA closed at $87.75 on June 26, a 12.25% discount to the $100 stated amount. Based on the $13 annual dividend, the static current yield is approximately 14.81%. Using the latest SOFR of approximately 3.64% as a benchmark, SATA's market current yield spread is approximately 1,117 basis points.

Fifth, daily distribution improves the granularity of cash flow, not the stability of principal. SATA fell from $97.38 on June 22 to $87.75 on June 26, a drop of about 9.9% over four trading days. This single price decline has offset about nine months of stated dividends. Daily distribution can soften the gap at monthly ex-dividend dates and reduce dividend capture trades, but it does not turn a perpetual preferred stock into a money market fund.

Therefore, the most noteworthy aspect of SATA is not "13% daily distribution," but rather that it slices the balance sheet of a BTC treasury company into two layers: common stockholders absorb residual volatility, while preferred stockholders receive prioritized cash flow, while bearing company credit risk, perpetual duration risk, financing channel risk, and BTC valuation risk.

2. Background

2.1 Latest Capital Structure
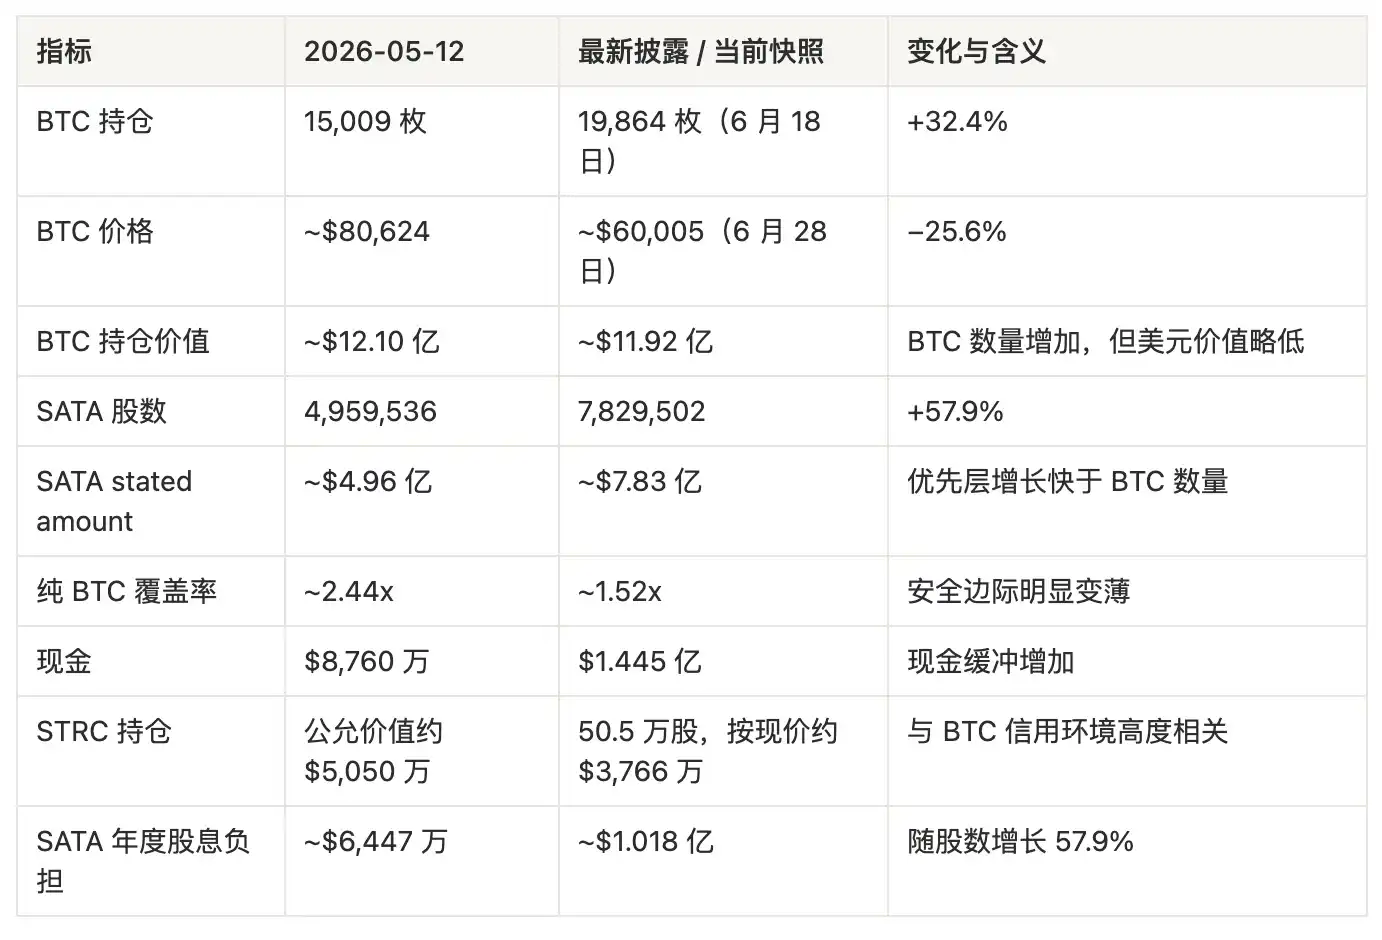
Strive bought more BTC, but did not increase the dollar value of BTC assets; meanwhile, the preferred stock principal and annual dividend burden are rising rapidly.

From May 12 to the present, BTC count increased by about 4,855, but the price fell by about a quarter, offsetting the quantity increase. The dollar value of BTC holdings changed from about $1.210 billion to about $1.192 billion; SATA stated amount, however, increased from about $496 million to about $783 million. This is precisely why the coverage ratio compressed from 2.44x to 1.52x.
2.2 What Dividends Depend On

SATA's current annual cash dividend burden is approximately: $782.95 million × 13% ≈ $101.8 million/year

Strive's payment of SATA dividends primarily relies on the following sources:

  1. Proceeds from ATM offerings of SATA or common stock;
  2. Existing cash reserves;
  3. Sale or liquidation of other securities;
  4. Sale of BTC if necessary;
  5. Future operational income or other financing that may arise.

Therefore, SATA is a cash flow commitment highly sensitive to the continuous openness of capital markets. When the market is willing to absorb new shares at prices close to or above $100, Strive can use the financing to expand BTC reserves and maintain dividends; when SATA trades significantly below $100, the economics of new financing deteriorate markedly.

Taking the current $87.75 as an example, if the company issues one share of SATA near this price, it receives only about $87.75 in gross proceeds but adds $100 to the stated amount and assumes a $13 annual dividend. Simply based on the proceeds, the financing cash cost is approximately: $13 ÷ $87.75 ≈ 14.81%

If the raised funds are primarily used to buy BTC, each new $87.75 in assets corresponds to $100 in preferred stock stated amount, diluting the pure asset coverage ratio. Continued aggressive ATM issuance at this point is only reasonable if management believes BTC's future returns, common stock financing, or market price recovery can compensate for the deteriorating structure.

2.3 Duration of Cash Coverage

Based on $144.5 million in cash and the approximately $101.8 million annual SATA dividend burden, ignoring operational expenses and new issuances, the cash can cover dividends for about 17.0 months.

If we include the STRC holdings, valued at the current market price of approximately $37.66 million, the dividend coverage duration could increase a bit more. But this figure is not "how long the company can survive":

  • The company still has employee, listing, audit, legal, and trading expenses;
  • Continued issuance of SATA increases the annual dividend burden;
  • STRC may depreciate simultaneously with BTC declines and credit tightening;
  • Cash is not specifically segregated for SATA holders;
  • Management can use funds to continue purchasing BTC or for other corporate purposes.

The cash buffer indeed lowers the probability of forced BTC sales in the short term but does not eliminate financing dependence.

3. What SATA's Daily Distribution Changes

3.1 Actual Daily Amount

The formal declaration for July 2026 is:

  • Each business day per share: $0.0493;
  • Total of 22 business days;
  • Monthly total per share: $1.0846.

Based on the current 7,829,502 shares, if the share count remains unchanged throughout the month, the July cash dividend would be approximately $8.49 million.

3.2 It Does Reduce Dividend Calendar Trading

Traditional monthly or quarterly preferred stocks accumulate accrued dividends before the ex-dividend date and experience a visible price adjustment on that date. Splitting one month's cash into daily business-day payments can:

  • Reduce the single ex-dividend amount;
  • Decrease dividend capture trades centered on a single ex-dividend date;
  • Smooth cash returns more evenly;
  • Facilitate holders wishing to frequently reinvest or cover expenses.

This is a genuine product innovation for SATA.

3.3 But Daily Distribution Does Not Eliminate Price Risk

SATA closed at approximately $97.38 on June 22 and at $87.75 on June 26, a decline of about 9.9% over four trading days, a per-share loss of $9.63. Based on the $13 annual dividend, this is equivalent to about 8.9 months of stated dividends.

During the same period, STRC fell from approximately $88.79 to $74.57, a drop of about 16.0%. SATA's relative decline was smaller, suggesting its higher coupon, cleaner balance sheet, and product novelty might still command some premium.

Daily distribution smooths cash flow but does not smooth credit price.

4. How BTC Price Changes Alter the Safety Margin

The following stress test starts from the current snapshot:

  • BTC: 19,864;
  • Current BTC price: ~$60,005;
  • SATA stated amount: ~$782.95 million;
  • Cash: $144.5 million;
  • STRC holdings at current market price: ~$37.66 million.

"Pure BTC coverage" only compares BTC value to SATA stated amount; "Extended liquid asset coverage" mechanically adds cash and STRC at current market value. This does not represent legal collateral and does not assume STRC declines in sync with BTC.
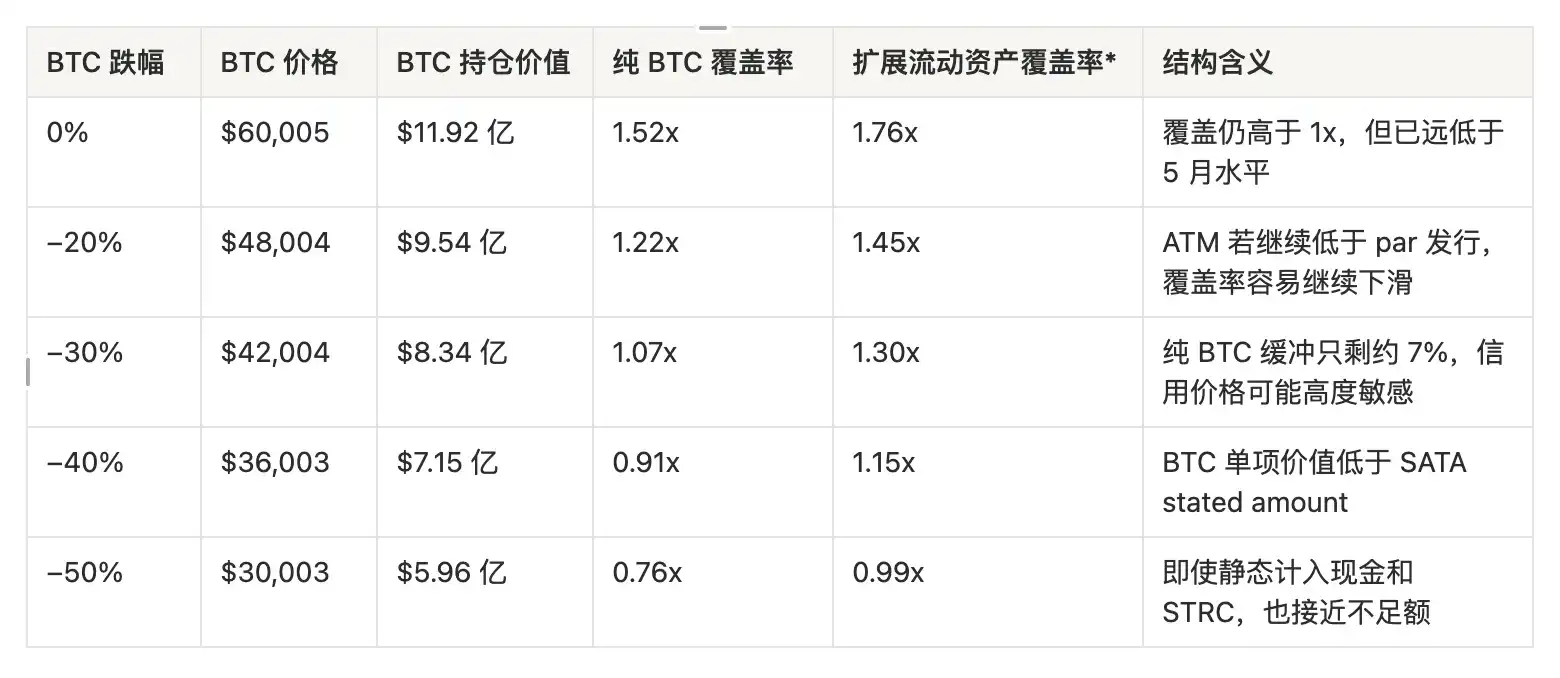
*The extended calculation assumes cash and STRC value remain constant, which is overly optimistic in a BTC crash scenario.
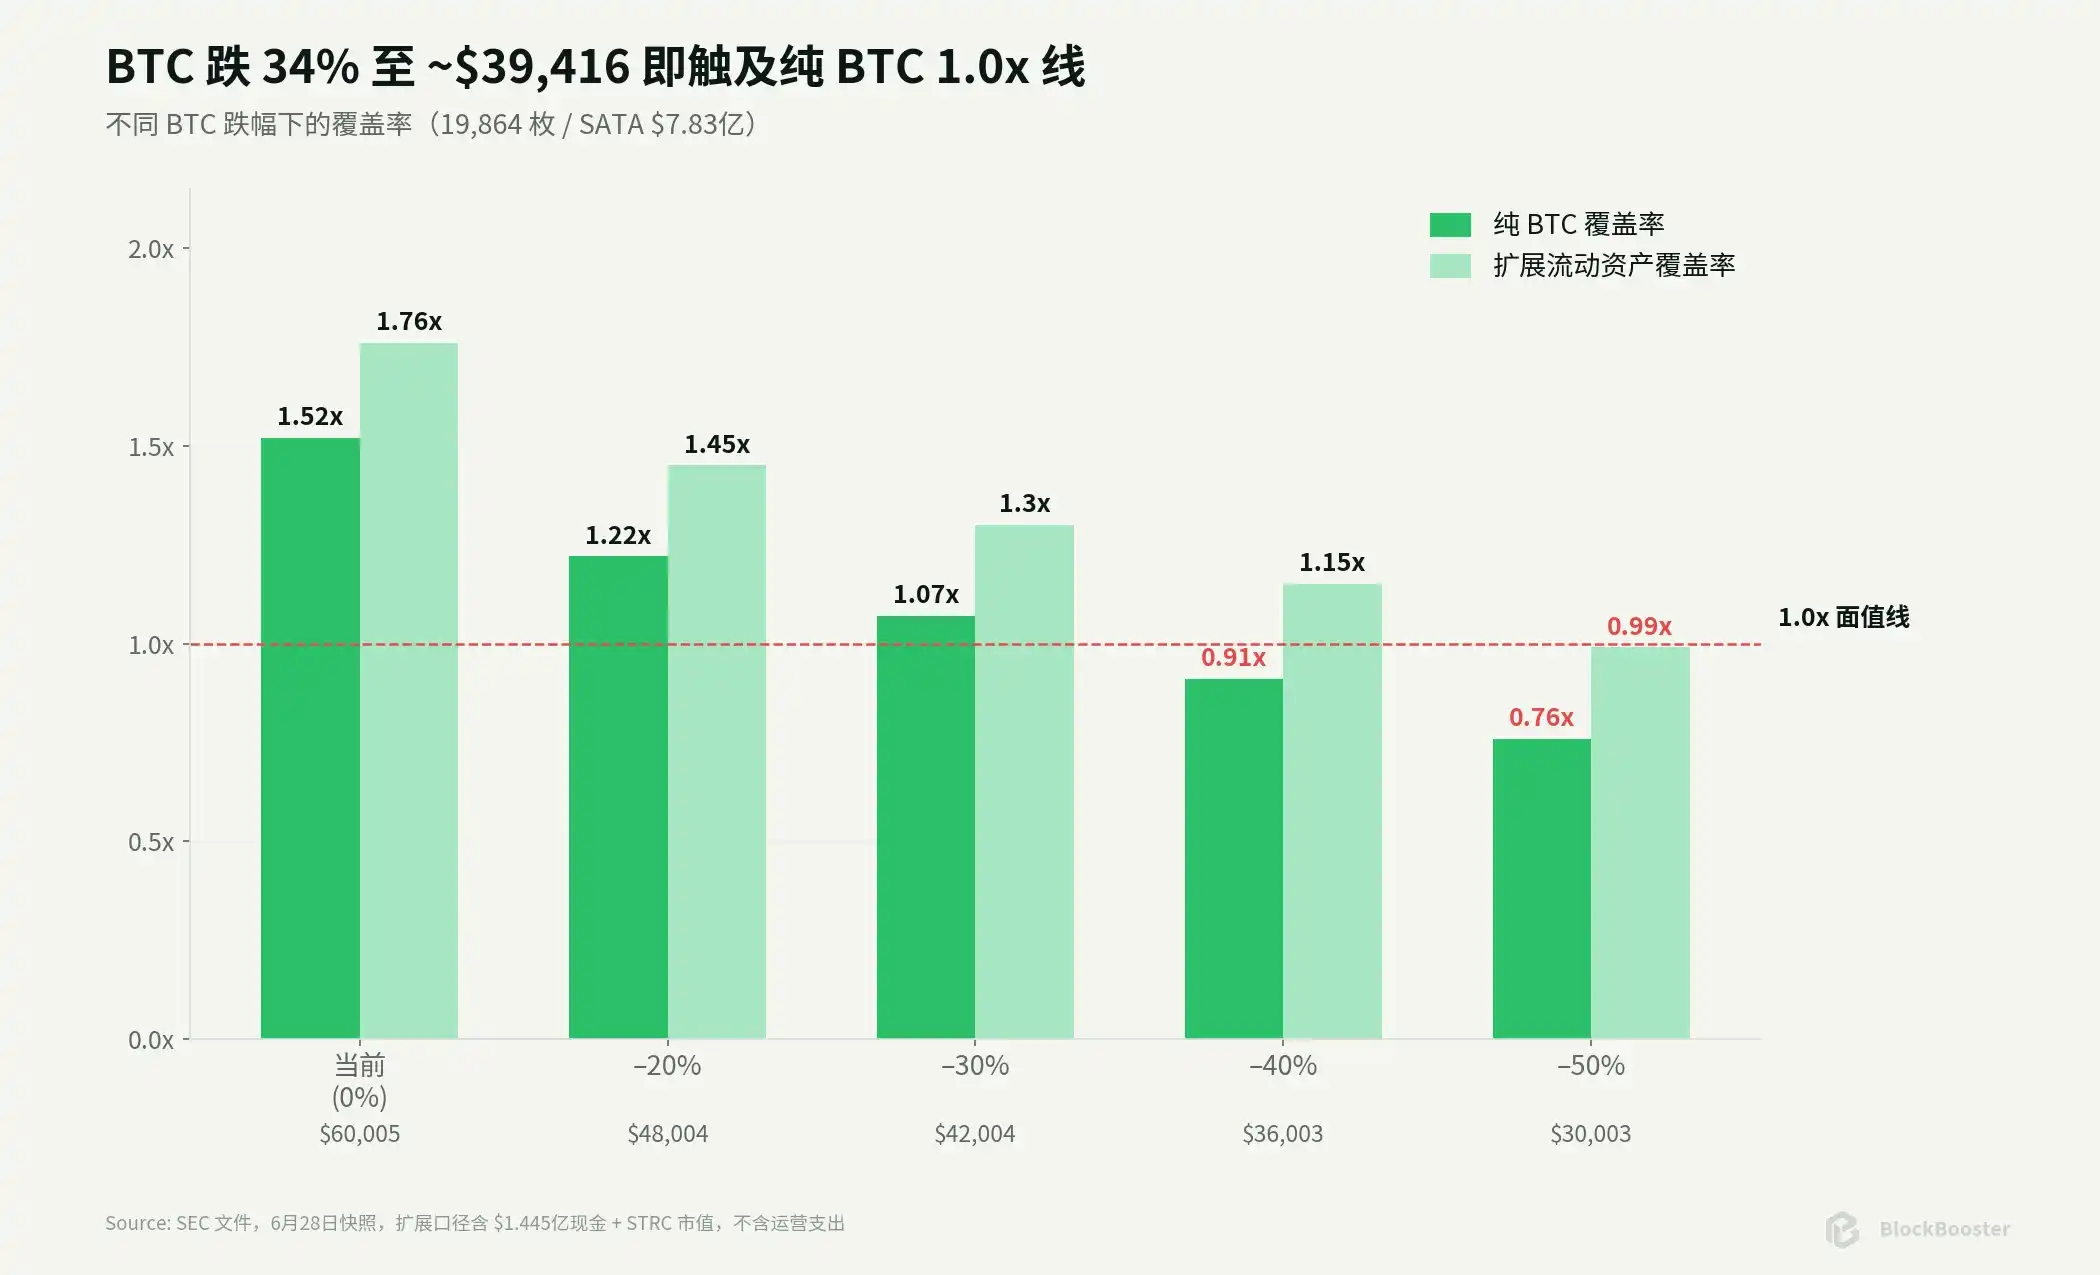
The price at which pure BTC coverage falls to 1.0x is approximately:

$782.95 million ÷ 19,864 ≈ $39,416/BTC

Relative to the current ~$60,005, this is a decline of about 34.3%. A 1.52x coverage cannot be considered robust tail protection.

But one cannot simplistically say that SATA will "default" as soon as BTC hits $39,416. SATA is a preferred stock, not a bond with a maturity date; the company still possesses cash, other assets, financing capabilities, and options to adjust capital allocation. What is more likely to happen is:

  1. SATA's market price falls significantly in advance;
  2. ATM issuance efficiency declines;
  3. Management increases the coupon to stabilize the price, ironically increasing the cash burden;
  4. The company reduces BTC purchases, sells other assets or BTC;
  5. In extreme cases, it defers dividends.

Credit deterioration is a continuous process, not a mechanical default triggered by crossing a single price line.

5. Key Risks

5.1 Below-Par ATM Reflexivity

When SATA trades above or near $100, issuance can raise funds relatively efficiently; when SATA falls to $87.75, continued issuance exchanges cash below the stated amount for higher preferred stock principal and dividend burden.

A potential negative feedback loop: SATA price falls → financing cost rises → proceeds per share raised decrease → coverage ratio deteriorates → market demands higher yield → SATA price continues to fall.

The company can pause or slow the ATM, thereby stopping mechanical dilution, but at the cost of reduced BTC purchase speed, a weaker capital markets narrative, and increased reliance on existing cash.

5.2 Cash Flow & Financing Channel Risk

Current cash is sufficient to cover about 17 months of static dividends, but this calculation excludes operational costs and future SATA additions. If capital markets close, the company will ultimately have to choose between reducing BTC purchases, selling securities, selling BTC, or deferring dividends.

5.3 Dividend Rate Governance & Cash Cost Stickiness

The board can adjust the coupon rate monthly, but the current low price limits downward adjustment room. The weaker the price, the higher the yield the market demands; the higher the coupon, the greater the company's cash burden. This is an inherent credit reflexivity.

5.4 Preferred Stock Is Not a Bond

Cumulative deferral protects holders, but a dividend suspension is not equivalent to a bond default. Investors may not receive timely cash and may not possess creditors' rights to remedies. In liquidation, creditors and other senior claimants must still be satisfied first.

6. Relative Value

6.1 SATA vs. STRC: Which Is Cheaper?

Current static current yields:

  • SATA: ~14.81%;
  • STRC: ~15.42%.

This spread must be considered alongside the following factors:

  • Strategy is larger, has deeper financing channels, and higher USD reserves;
  • But Strategy has approximately $6.7 billion in convertible notes and ~$15.5 billion in nominal preferred stock size, with a more complex capital structure;
  • Strive's latest full disclosure shows zero debt, but the company has a short history, is smaller, and has weaker liquidity;
  • SATA has a higher coupon and daily distribution, but its coverage is declining rapidly;
  • Both have perpetual duration, issuer call rights, and BTC tail risk.

Therefore, one cannot conclude SATA is definitely superior to STRC based solely on "Strive has zero debt," nor can one conclude STRC is a better deal based solely on its higher yield. A 61bp gap is already narrow; the actual choice depends on which risk an investor fears more: complex debt structure or the financing and liquidity risk of a small issuer.

6.2 When Might Relative Value Arise for SATA?

Focus on four types of misalignment:

  1. Price falls, fundamentals unchanged: If SATA falls while BTC coverage, cash, and ATM conditions do not worsen further, rising yield may create value;
  2. Coverage continues to worsen, price remains static: If SATA share count grows much faster than BTC, yet the market still trades it near par, risk may be underestimated;
  3. SATA vs. STRC spread widens abnormally: Need to determine if it's a liquidity shock or a divergence in issuer fundamentals;
  4. Coupon adjustment diverges from market price: A board decision to increase the coupon may support the price but also increases future cash burden.

7. Conclusion

SATA's innovation is real. It transformed a traditionally monthly/quarterly paying perpetual preferred stock into a listed instrument generating cash flow every business day; it also allows investors in traditional brokerage accounts to access a high-yield security linked to a BTC balance sheet without directly holding the cryptocurrency.

However, price and asset changes in late June corrected several overly optimistic judgments:

  • SATA is not a BTC-collateralized bond; it is a corporate-level cumulative perpetual preferred stock;
  • Daily distribution did not create low volatility; principal price can erase most of a year's dividends in a few days;
  • BTC quantity growth did not prevent coverage from falling from 2.44x to 1.52x;
  • ~940bp was the stated spread; the current market spread has widened to ~1,117bp;
  • The cash buffer is strong, but the dividend burden and financing cost have risen simultaneously;
  • SATA's structural advantages remain, but the market has already repriced it from a "near-par income product" to a "deeply discounted high-risk perpetual credit."

What SATA does is: slice off a layer of tradable, cumulative, perpetual preferred equity from a BTC treasury company's balance sheet and let the market reprice this layer daily.

A mature asset class not only has a spot price but also develops financing rates, seniority tiers, credit spreads, maturities, and default pathways.

However: Cash flow frequency can be engineered, but risk does not disappear; it merely transforms from coin price volatility into coverage ratios, financing costs, perpetual duration, and corporate governance risks.


Cryptos en tendance

Questions liées

QWhat is SATA and what are its key characteristics as described in the article?

ASATA is a perpetual, cumulative preferred equity security issued by Strive, with a stated amount of $100 per share. It pays a high annual dividend (currently 13%), and recently switched from monthly to daily distributions. Legally, it represents a claim on Strive's corporate credit and Bitcoin balance sheet risk, not a direct lien on specific Bitcoin. It ranks senior to common stock but junior to creditors and has no maturity date, though dividends are cumulative if deferred.

QWhy did SATA's price fall significantly in late June, despite the introduction of daily dividends?

ASATA's price fell because its fundamental risk profile worsened. The primary reason was the compression of its Bitcoin coverage ratio, which dropped from 2.44x in mid-May to 1.52x by late June. This was due to SATA shares outstanding growing faster (57.9%) than the company's Bitcoin holdings (32.4%), combined with a decline in Bitcoin's price. The market re-priced SATA as a high-risk perpetual credit instrument rather than a stable income product close to its par value.

QAccording to the article, what are the main risks for SATA investors?

AThe main risks are: 1) A reflexive negative feedback loop where SATA trading below par makes new ATM (At-The-Market) share issuance dilutive and increases the dividend burden. 2) Cash flow and financing channel risk if capital markets become unwilling to fund the company. 3) Dividend rate governance and cash cost stickiness, where a falling price may force the company to raise dividends, increasing its cash burden. 4) The structural fact that SATA is preferred stock, not a bond, meaning dividend deferral does not constitute default and investors lack the same creditor rights.

QWhat is the 'pure Bitcoin coverage ratio' and what does its decline signify?

AThe 'pure Bitcoin coverage ratio' is a calculated metric comparing the total dollar value of Strive's Bitcoin holdings to the total stated amount of SATA shares outstanding. Its decline from 2.44x to 1.52x signifies that the Bitcoin assets backing each dollar of SATA's senior claim have significantly decreased. This compression directly increases the credit risk for SATA holders, as the asset cushion protecting them from Bitcoin price declines has thinned. The article calculates that this ratio would fall to 1.0x if Bitcoin's price fell to approximately $39,416.

QHow does SATA compare to the issuer's common stock (STRC) in terms of risk and yield as of the article's data?

AAs of the article's data, SATA had a static current yield of approximately 14.81%, while STRC's yield was around 15.42%. The narrow 61 basis point spread indicates the market perceives similar levels of risk. SATA offers a higher, daily dividend and a simpler capital structure (Strive has no debt), but faces risks from a rapidly declining Bitcoin coverage ratio and reliance on ATM financing. STRC, from the larger company Strategy, has deeper financing channels but a more complex capital structure with significant convertible debt and preferred stock. The choice depends on whether an investor is more concerned with a small issuer's financing risk (SATA) or a large issuer's complex leverage (STRC).

Lectures associées

Prévision du prix du BTC : Les taureurs du BTC reprennent le contrôle et Brandt soutient une percée au-dessus de 81 K$

Le Bitcoin (BTC) continue de négocier aux alentours de 80 000 $, les acheteurs défendant des niveaux techniques clés et un regain de levier sur le marché. Le trader Peter Brandt a récemment ouvert une position longue sur le BTC, marquant un changement dans sa vision technique après la formation d'un renversement 'tête et épaules'. L'analyse technique sur le graphique de 4 heures montre une structure haussière, avec le prix évoluant au-dessus des moyennes mobiles exponentielles (MME) de 20, 50, 100 et 200 périodes. Le niveau de 79 084 $ (MME 20) constitue le premier support important, suivi de 77 283 $ et 76 515 $. Une résistance immédiate se situe entre 80 000 $ et 80 500 $. Une clôture déterminante au-dessus de 81 255 $ pourrait confirmer un élan haussier renouvelé et ouvrir la voie vers 83 000 $, voire plus. L'intérêt ouvert sur les marchés dérivés du Bitcoin a significativement augmenté, atteignant 56,48 milliards de dollars, ce qui indique un retour des positions à effet de levier et pourrait soutenir de nouvelles avancées, bien qu'il accroisse aussi les risques de liquidation. Les flux sur le marché au comptant (spot) restent mitigés, avec des entrées et sorties irrégulières. Des entrées nettes durables seraient nécessaires pour conforter une éventuelle percée technique. En résumé, la perspective pour septembre dépend de la capacité des acheteurs à maintenir le prix au-dessus du support de 79 084 $ et à générer suffisamment d'élan pour franchir la résistance clé de 81 255 $. Une telle percée pourrait déclencher une nouvelle phase de hausse, tandis qu'un échec pourrait entraîner une correction vers 77 283 $. La structure technique globale reste favorable aux haussiers, mais une confirmation au-dessus de 81 255 $ est essentielle.

cryptonews.ruIl y a 6 mins

Prévision du prix du BTC : Les taureurs du BTC reprennent le contrôle et Brandt soutient une percée au-dessus de 81 K$

cryptonews.ruIl y a 6 mins

La hausse du cours du bitcoin en août. Un pic temporaire ou le début d’un nouveau cycle ?

Le marché des cryptomonnaies tente de se redresser en août après une tendance baissière prolongée depuis octobre 2025. Bitcoin a connu une croissance soutenue la semaine dernière, stimulée par des facteurs macroéconomiques et de marché. Cependant, les analystes estiment qu'il est trop tôt pour parler d'un changement de tendance, les risques baissiers persistants laissant prévoir une phase de consolidation dans un large fourchette de prix. La dynamique actuelle s'inscrit dans les cycles quadriennaux historiques de Bitcoin, traditionnellement liés au halving. De nombreux acteurs anticipent un creux de cycle cet automne, les niveaux récents pouvant signaler un fond local et une tentative de rupture de la tendance baissière. Les facteurs macroéconomiques, tels que les taux d'intérêt élevés et la rhétorique ferme de la Fed, continuent de peser sur le marché. Toutefois, une inflation en baisse pourrait inciter la Fed à assouplir sa politique, ce qui serait favorable au BTC. La géopolitique, notamment les tensions autour de l'Iran, influence également les perspectives inflationnistes et monétaires. La concurrence des actifs liés à l'IA et aux semi-conducteurs exerce une pression supplémentaire, de nombreuses sociétés de minage se reconvertissant vers ce secteur plus rentable. Cela a contribué aux sorties des ETF spot et à la baisse d'intérêt. Néanmoins, les ETF Bitcoin ont attiré plus de 3,5 milliards de dollars depuis début août, indiquant une reprise de la demande institutionnelle. D'un point de vue technique, les experts n'attendent pas une hausse explosive. Une résistance forte est identifiée autour de 86 000 $, avec une correction possible vers 74 000 $. Si ce support tient, l'objectif suivants serait 96 000 $ puis 100 000 $. Un scénario alternatif prévoit une consolidation latérale entre 60 000 $ et 85 000 $, jusqu'à un assouplissement de la Fed ou un ralentissement de l'engouement pour l'IA. Les prévisions antérieures tablaient sur une fourchette large de 62 000 $ à 100 000 $ pour l'automne, la régulation américaine étant un facteur de croissance potentiel.

cryptonews.ruIl y a 7 mins

La hausse du cours du bitcoin en août. Un pic temporaire ou le début d’un nouveau cycle ?

cryptonews.ruIl y a 7 mins

Même question électorale, deux cotes différentes : Predictions.io lance des outils gratuits de comparaison multi-plateformes

Washington, États-Unis, 28 août 2026, Chainwire – Alors que les volumes des marchés de prédiction atteignent des sommets et que les régulateurs intensifient leur surveillance, des questions identiques sur les élections de mi-mandat affichent des cotes différentes selon les plateformes. Predictions.io suit désormais plus de 9 700 marchés sur Kalshi, Polymarket et Manifold, offrant des outils gratuits pour comparer les prix et les frais. En juillet, le volume combiné de Kalshi, Polymarket et Polymarket US a atteint un record de 50,59 milliards de dollars. Durant la même période, les autorités ont renforcé leurs enquêtes sur le secteur. Pourtant, une question simple est souvent négligée : les plateformes s'accordent-elles sur la réponse ? Non. Par exemple, la probabilité d'un "raz-de-marée bleu en 2026" était de 44,5% sur Polymarket contre 36,0% sur Kalshi, soit un écart de 8,5 points. En moyenne, les écarts entre marchés comparables dépassent 4 points. Pour répondre à ce besoin de transparence, Predictions.io agrège et compare les marchés, et propose deux outils gratuits : un calculateur de frais pour voir le coût réel d'une transaction sur chaque plateforme, et un convertisseur de cotes. Le service permet ainsi aux traders et journalistes d'identifier les divergences entre les principales places de marché. Predictions.io n'opère aucun marché et reste un service de données indépendant.

TheNewsCryptoIl y a 17 mins

Même question électorale, deux cotes différentes : Predictions.io lance des outils gratuits de comparaison multi-plateformes

TheNewsCryptoIl y a 17 mins

Prévision du prix du XRP : une percée à 1,50 $ pourrait relancer les haussiers, alors qu'Evernorth se dirige vers une introduction en bourse au Nasdaq

Le prix du XRP subit une pression de vente renouvelée, évoluant autour de 1,415 $ après avoir échoué à maintenir son élan au-dessus de 1,50 $. La dynamique technique s'affaiblit à court terme, le token étant passé sous la moyenne mobile exponentielle (EMA) de 20 périodes à 1,4334 $. Cependant, la structure globale reste constructive, les prix se maintenant au-dessus des EMA de 50, 100 et 200 périodes. Les niveaux clés à surveiller sont une résistance immédiate à 1,4260 $ et un support majeur à 1,3816 $. Une percée au-dessus de 1,50 $ pourrait ouvrir la voie vers 1,5453 $, tandis qu'une rupture sous 1,3816 $ pourrait entraîner une correction plus profonde vers 1,3422 $, voire 1,2852 $. Les marchés dérivés montrent des signes de reprise d'activité, l'intérêt ouvert remontant à environ 3,48 milliards de dollars, ce qui pourrait amplifier la volatilité des prix. Parallèlement, les flux de trading spot continuent d'afficher des sorties nettes persistantes. Sur le front institutionnel, Evernorth Holdings progresse vers son introduction prévue au Nasdaq. La SEC a déclaré effective sa déclaration d'enregistrement, et un vote des actionnaires sur la fusion est prévu le 30 septembre 2026. Une approbation pourrait constituer un catalyseur significatif pour le XRP. En résumé, la perspective pour septembre dépend de la capacité des acheteurs à défendre le support à 1,3816 $ et à reconquérir le niveau de 1,50 $. Le prochain mouvement important sera déterminé par le résultat de cette bataille autour de ces niveaux techniques clés.

cryptonews.ruIl y a 26 mins

Prévision du prix du XRP : une percée à 1,50 $ pourrait relancer les haussiers, alors qu'Evernorth se dirige vers une introduction en bourse au Nasdaq

cryptonews.ruIl y a 26 mins

Une licorne de puces radar pour véhicules se précipite vers l'IPO, BYD est son plus grand client

La société de semi-conducteurs pour radars automobiles Calterah a déposé son introduction en bourse (IPO) sur le marché STAR de Shanghai, visant une valorisation d'environ 14 milliards de yuans. Spécialisée dans les puces radar millimétriques CMOS, l'entreprise a vu ses revenus passer de 206 millions à 632 millions de yuans entre 2023 et 2025, avec un taux de croissance annuel composé supérieur à 75%. Sa croissance a été largement portée par BYD, son principal client qui représente plus de 50% de ses ventes. Malgré une forte croissance des revenus, Calterah reste non rentable, cumulant des pertes nettes de 910 millions de yuans sur trois ans et trois mois. La société a un taux de marge brute élevé (environ 48%) mais est lourdement impactée par des dépenses de R&D massives (taux de dépenses de R&D de 58,55% en 2025). L'entreprise fait face à plusieurs défis clés : une dépendance excessive au client BYD, une forte concentration de sa chaîne d'approvisionnement dépendant de l'étranger (plus de 50% des achats), et un manque de diversification produit. Ses puces radar millimétriques représentent 99,93% de son chiffre d'affaires, tandis que sa seconde offre, la puce UWB, n'en est qu'à ses débuts commerciaux. Les fonds levés lors de l'IPO (3,489 milliards de yuans) seront principalement destinés à consolider ses activités principales en radar millimétrique et à développer la puce UWB. Pour justifier sa valorisation, Calterah devra réduire sa dépendance à BYD, diversifier sa clientèle, sécuriser sa chaîne d'approvisionnement et réussir le lancement commercial de sa seconde gamme de produits.

marsbitIl y a 34 mins

Une licorne de puces radar pour véhicules se précipite vers l'IPO, BYD est son plus grand client

marsbitIl y a 34 mins

Trading

Spot

Articles tendance

Comment acheter DATA

Bienvenue sur HTX.com ! Nous vous permettons d'acheter DATA Network (DATA) de manière simple et pratique. Suivez notre guide étape par étape pour commencer votre parcours crypto.Étape 1 : Création de votre compte HTXUtilisez votre adresse e-mail ou votre numéro de téléphone pour ouvrir un compte sur HTX gratuitement. L'inscription se fait en toute simplicité et débloque toutes les fonctionnalités.Créer mon compteÉtape 2 : Choix du mode de paiement (rubrique Acheter des cryptosCarte de crédit/débit : utilisez votre carte Visa ou Mastercard pour acheter instantanément DATA Network (DATA).Solde :utilisez les fonds du solde de votre compte HTX pour trader en toute simplicité.Prestataire tiers :pour accroître la commodité d'utilisation, nous avons ajouté des modes de paiement populaires tels que Google Pay et Apple Pay.P2P :tradez directement avec d'autres utilisateurs sur HTX.OTC (de gré à gré) : nous offrons des services personnalisés et des taux de change compétitifs aux traders.Étape 3 : stockage de vos DATA Network (DATA)Après avoir acheté vos DATA Network (DATA), stockez-les sur votre compte HTX. Vous pouvez également les envoyer ailleurs via un transfert sur la blockchain ou les utiliser pour trader d'autres cryptos.Étape 4 : tradez des DATA Network (DATA)Tradez facilement DATA Network (DATA) sur le marché Spot de HTX. Il vous suffit d'accéder à votre compte, de sélectionner la paire de trading, d'exécuter vos trades et de les suivre en temps réel. Nous offrons une expérience conviviale aux débutants comme aux traders chevronnés.

608 vues totalesPublié le 2026.07.01Mis à jour le 2026.07.01

Comment acheter DATA

Discussions

Bienvenue dans la Communauté HTX. Ici, vous pouvez vous tenir informé(e) des derniers développements de la plateforme et accéder à des analyses de marché professionnelles. Les opinions des utilisateurs sur le prix de DATA (DATA) sont présentées ci-dessous.

活动图片