Bitcoin Price Remains Within A Narrow Range, What’s Next For The Bears?

newsbtcPublié le 2022-10-22Dernière mise à jour le 2022-10-22

Résumé

Bitcoin price has been moving within a restricted range for over a week now. The coin had attempted to move north over the past few days. However, it has not...

Bitcoin price has been moving within a restricted range for over a week now. The coin had attempted to move north over the past few days. However, it has not managed to trade near the $20,000 mark.
“”

The movement of the Bitcoin price has mainly remained sandwiched between $18,000 and $20,000, respectively.
“”

Over the last 24 hours, BTC slipped by 0.4%, confirming that there has not been significant price movement.
“”

In the past week, BTC depreciated by 1.1%. Overall market strength has been choppy, which is why market movers have remained dull on their respective price charts.
“”

The technical outlook of Bitcoin continued to side with the bears. Buying strength has remained low as a result of a slowdown in demand for Bitcoin.
“”

According to its one-day chart, over the next trading sessions, Bitcoin is set to retrace further and trade close to the $18,900 price mark.
“”

This support level marks a crucial price level for the coin as it will determine the next move of Bitcoin depending on the demand for the coin.
“”

Bitcoin Price Analysis: One-Day Chart
Bitcoin Price

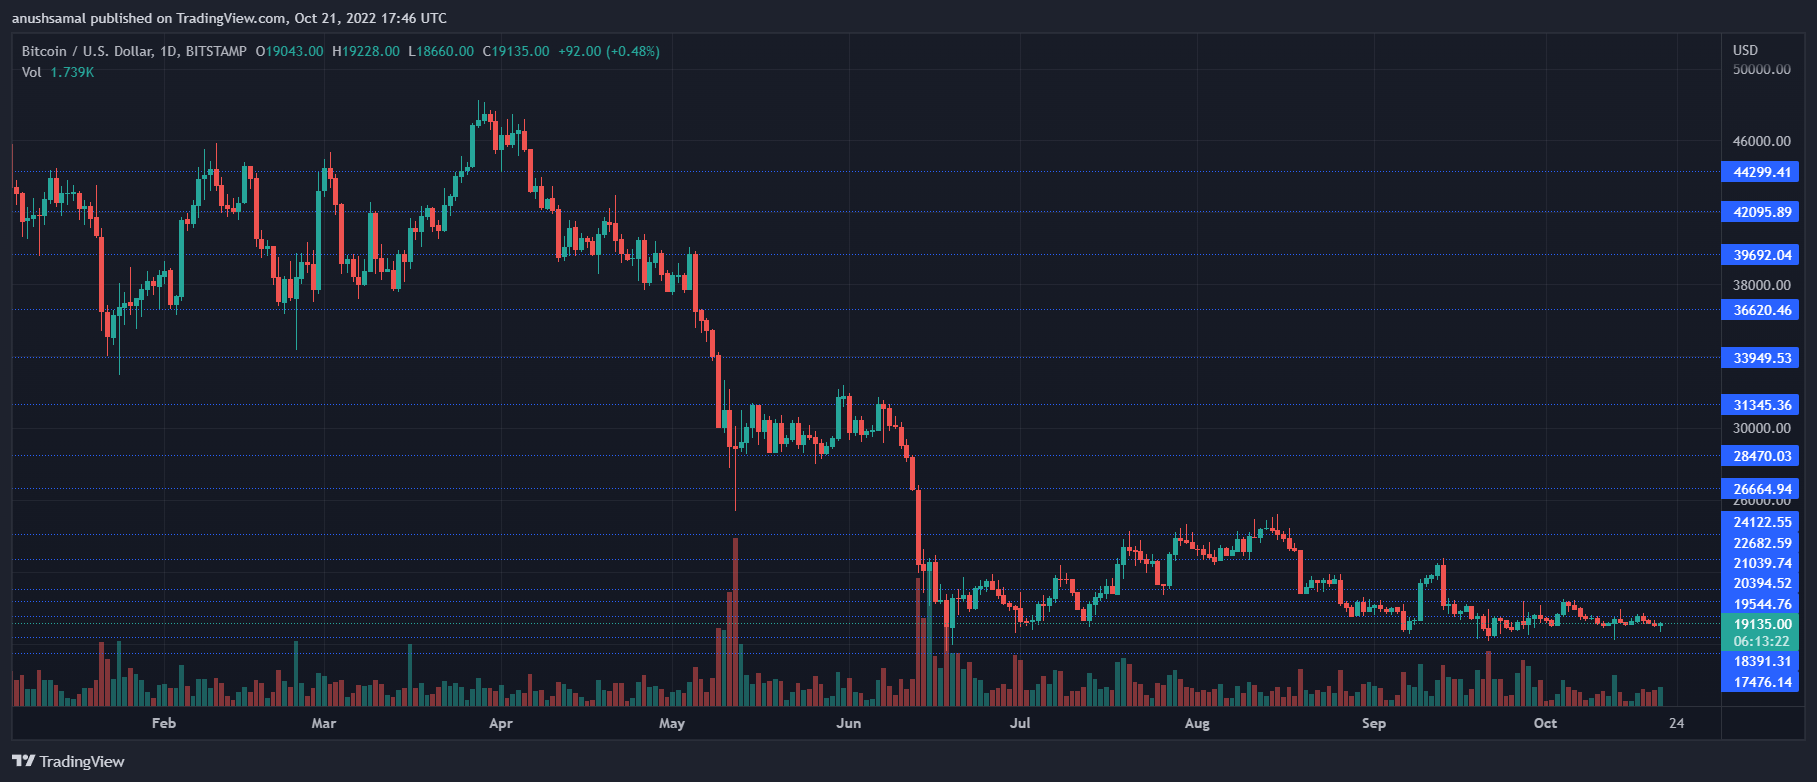
Bitcoin was priced at $19,100 on the one-day chart | Source: BTCUSD on TradingView

“”

BTC was trading at $19,100 at the time of writing. The cryptocurrency has moved up and down within the range of $19,400 and $19,000.
“”

Continual movement in a similar pattern will strengthen the bears even further. Overhead resistance for the coin was at $19,600, moving past which BTC will again have a tough time crossing past $20,000.

“”

The bulls will only take over from the $20,000 price mark. On the other hand, the nearest support would be $18,900. This is a crucial support line for the coin.
“”

A fall from there will cause BTC to move to $18,300 and then to $17,400. The amount of Bitcoin traded in the last session turned green, which could indicate a small rise in buyers.
""

Technical Analysis
Bitcoin Price

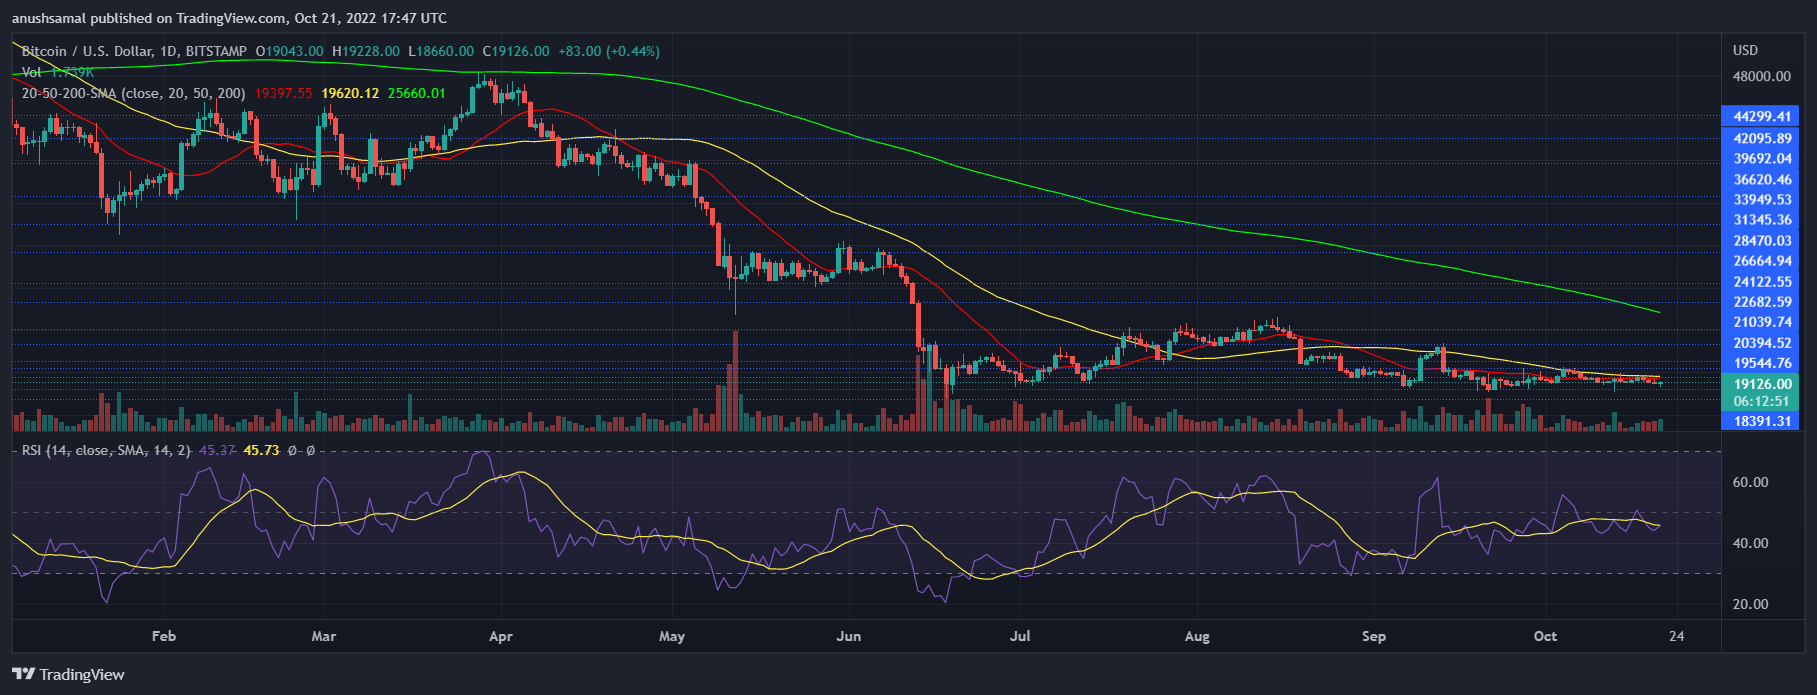
Bitcoin registered a small uptick in buying strength on the one-day chart | Source: BTCUSD on TradingView

""

Demand for the coin has seen a slight increase over the last 24 hours. For most of this month, Bitcoin’s demand has remained low, and sellers have taken over the market.
""

The Relative Strength Index was below the half-line, and that meant a lower number of buyers as compared to sellers on the one-day chart.
""

Bitcoin price was below the 20-SMA line, which also was in accordance with fewer buyers as sellers were driving the price momentum in the market.
Bitcoin Price

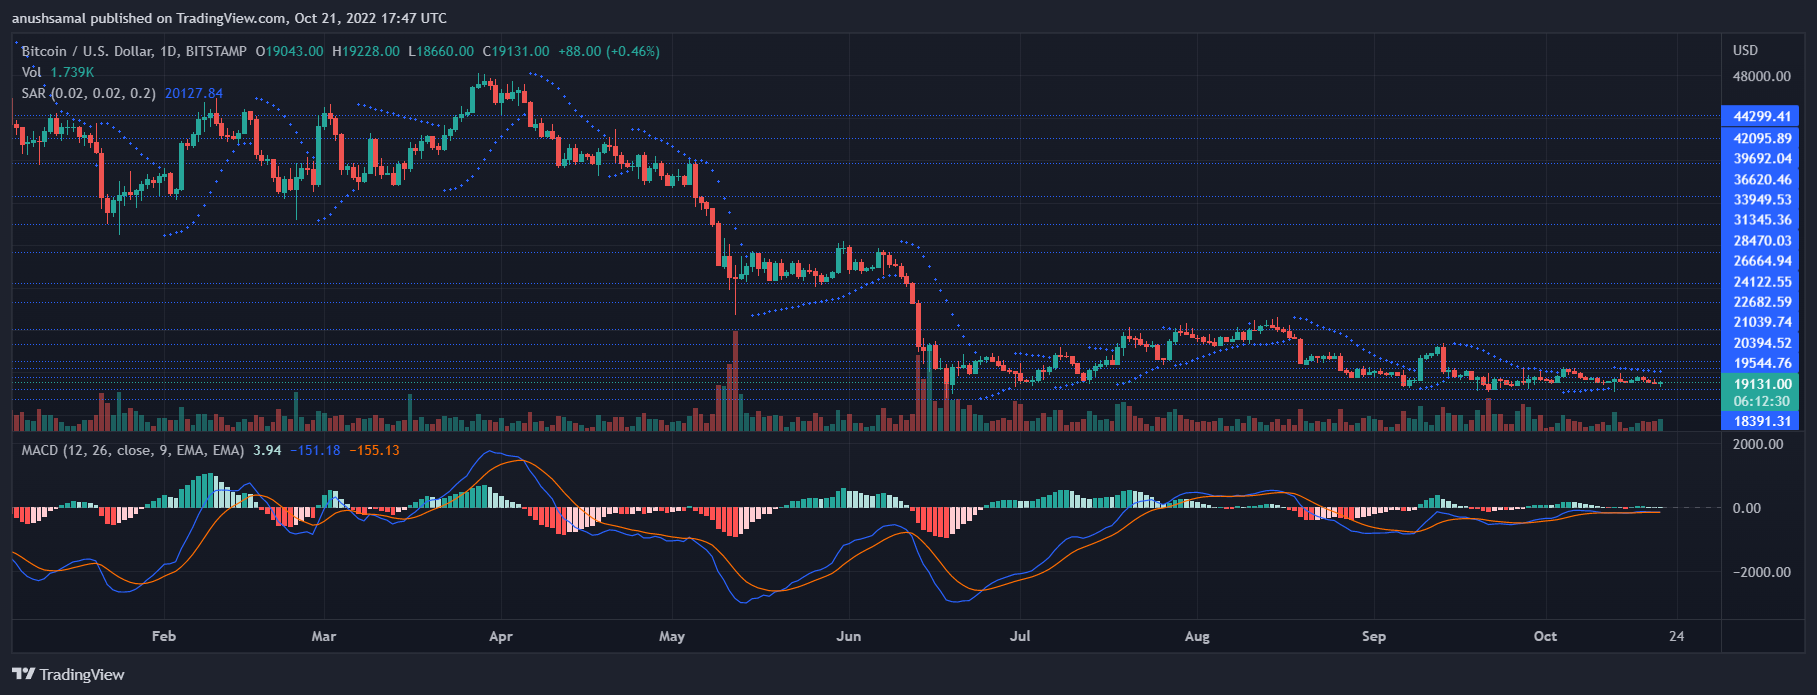
Bitcoin depicted buy signal on the one-day chart | Source: BTCUSD on TradingView

""

However, BTC still continued to display buy signal on the chart. However, those were declining and would soon be replaced by sell signal.
""

The Moving Average Convergence Divergence shows the price momentum and direction of the asset. MACD still displayed green signal bars, which were buy signal for the coin.
""

The Parabolic SAR also indicates the price direction of the asset. The Parabolic SAR was above the candlesticks, which meant that the price was bearish for the asset.
""

The indicator indicated that the price of Bitcoin was in a downward trend, which could be reversed if demand returned to the chart.

Lectures associées

Une atmosphère prudente prévaut sur le marché, l'indice de peur et de gourmandise des cryptomonnaies reste à 35 ! Voici les détails

L'indice de peur et de cupidité des cryptomonnaies, un indicateur clé mesurant le sentiment des investisseurs, reste à un niveau de 35 points, signalant une atmosphère de prudence persistante sur les marchés. Calculé par CoinMarketCap, l'indice est inchangé par rapport au jour précédent, indiquant une faible appétence pour le risque. Un niveau de 35 se situe dans la zone « peur », ce qui montre que les investisseurs restent circonspects en raison des incertitudes et que la confiance n'est pas encore pleinement rétablie. L'indice, qui va de 0 (peur excessive) à 100 (cupidité excessive), intègre plusieurs données de marché : la dynamique des prix des 10 principales cryptomonnaies, la volatilité, le ratio put/call sur les dérivés, le taux de réserve des stablecoins (SSR) et les recherches des utilisateurs. Les principaux facteurs freinant la prise de risque sont l'incertitude macroéconomique mondiale, les attentes concernant la politique monétaire des banques centrales et la volatilité des actifs cryptographiques. La stabilité de l'indice sur plusieurs jours suggère également que le marché peine à trouver une nouvelle direction. Les analystes soulignent que cet indice ne constitue pas une recommandation d'investissement, mais reste un outil utile pour comprendre la psychologie de marché. Historiquement, des niveaux très bas ont parfois présenté des opportunités d'achat, tandis que des niveaux très élevés augmentaient le risque de prise de bénéfices.

cryptonews.ruIl y a 5 mins

Une atmosphère prudente prévaut sur le marché, l'indice de peur et de gourmandise des cryptomonnaies reste à 35 ! Voici les détails

cryptonews.ruIl y a 5 mins

Or et Bitcoin divergent en 2026 : négociez les deux paris refuges depuis un seul compte WEEX

Durant la dernière décennie, Bitcoin était considéré comme l'"or numérique", partageant avec l'or le rôle de protection contre l'effritement des monnaies fiduciaires. En 2026, cette thèse s'est brisée. Alors que l'or a atteint des sommets historiques, dépassant 4 000 USD l'once, Bitcoin a chuté d'environ 20% sur l'année. Le test décisif est survenu fin février 2026 lors d'un conflit géopolitique : l'or a grimpé de 5,2% quand Bitcoin a chuté de 12%. La corrélation entre les deux actifs est tombée à -0,88, son niveau le plus bas depuis longtemps. L'or a réaffirmé son statut traditionnel de valeur refuge, porté par l'achat des banques centrales et l'incertitude monétaire. Bitcoin, quant à lui, se comporte désormais comme un actif à haute volatilité (bêta élevé), suivant l'appétit pour le risque plutôt que de s'y opposer. Cette divergence offre une opportunité de diversification réelle : détenir les deux actifs n'est plus un pari redondant, mais une stratégie pour couvrir des humeurs de marché distinctes. La plateforme WEEX permet aux traders d'accéder aux deux côtés de cette divergence depuis un seul compte en USDT, que ce soit pour trader l'or (XAU/USDT), le Bitcoin au spot, ou ses contrats perpétuels à effet de levier. L'ère de "l'or numérique" est révolue, laissant place à deux instruments distincts pour des objectifs de trading différents.

TheNewsCryptoIl y a 24 mins

Or et Bitcoin divergent en 2026 : négociez les deux paris refuges depuis un seul compte WEEX

TheNewsCryptoIl y a 24 mins

Trading

Spot
活动图片