Chainlink Price Forecast for 2026-2032: Strong Bullish Sentiment Favors Buying LINK?

cryptonews.ruPublié le 2026-08-21Dernière mise à jour le 2026-08-21

Résumé

**Chainlink (LINK) Price Forecast and Analysis: 2026-2032** This article presents a detailed forecast for Chainlink (LINK) prices from 2026 to 2032, alongside a technical and fundamental analysis. As of August 20, 2026, LINK is trading at approximately $10.69, showing a strong bullish trend with prices above key moving averages. Technical indicators, however, signal overbought conditions (RSI ~80), suggesting a potential for consolidation or a pullback. Key resistance lies at $10.88-$11.00, while support is seen at $10.40 and $10.20. The long-term price forecast is optimistic: - **2026:** Average price $11.38, ranging from $7.00 to $17.00. - **2027-2032:** Predict a steady climb, with the average price reaching $35.45 by 2032 and a potential high near $52.95. Fundamentally, Chainlink is highlighted as a crucial player in the blockchain ecosystem due to its decentralized oracle network, recent integrations across multiple blockchains, and strategic partnerships like Wyoming's adoption of Chainlink CCIP for its stablecoin. The analysis concludes that while LINK appears to be a promising long-term investment based on its utility and adoption, traders should monitor key technical levels for informed decision-making amidst current overbought signals.

Chainlink has become a prominent player in the cryptocurrency market. It provides a secure, decentralized oracle network that connects smart contracts with real-world data, impacting the current price.

As the adoption of decentralized finance (DeFi) and blockchain technology grows, Chainlink's innovative solutions are attracting significant attention from both investors and traditional financial institutions.

Chainlink continues to expand its presence and capabilities within the blockchain ecosystem, showcasing its robust integration abilities and facilitating enterprise adoption across various sectors through its cross-chain interoperability protocol.

Recent updates highlight 14 new integrations of 5 Chainlink services across 10 different blockchain platforms, demonstrating its versatility in working with multiple blockchains, including prominent ones like Arbitrum, Avalanche, and Ethereum.

These integrations broaden Chainlink's network capabilities and solidify its position as a critical player in ensuring the compatibility and functionality of decentralized applications.

Understanding Chainlink's potential price fluctuations based on the presented information is crucial for making an investment decision. This involves analyzing various factors, including market trends, technological advancements, partnerships, and overall market sentiment.

This Chainlink price forecast aims to provide insight into its future dynamics by analyzing technical aspects and fundamental factors that could influence its value.

Overview

Cryptocurrency Chainlink
Token LINK
Price $10.68
Market Capitalization $7,984 billion
Trading Volume (24h) $485,442 million
Circulating Supply 748.1 million LINK
All-Time High $52.88, May 9, 2021
All-Time Low $0.1263, September 23, 2017
24h High $10.86
24h Low $10.37

Chainlink Price Forecast: Technical Analysis

Metric Value
Price Volatility (30-day variation) 5.43% (High)
50-day SMA $8.41
14-day RSI 80.77 (Overbought)
Sentiment Neutral
Fear & Greed Index 62 (Greed)
Green Days 17/30 (57%)
200-day SMA $8.78

Chainlink Price Analysis

  • $LINK retains a strong bullish trend on both timeframes, with the daily MACD confirming accelerating upward momentum.
  • The next major resistance is the $10.88-$11.00 range, but the 4-hour Relative Strength Index (RSI) around 80 warns that the rally is overheating.
  • Holding above $10.40 allows buyers to maintain control, while losing $10.20 would increase the risk of a deeper correction.

Daily Chainlink Price Chart

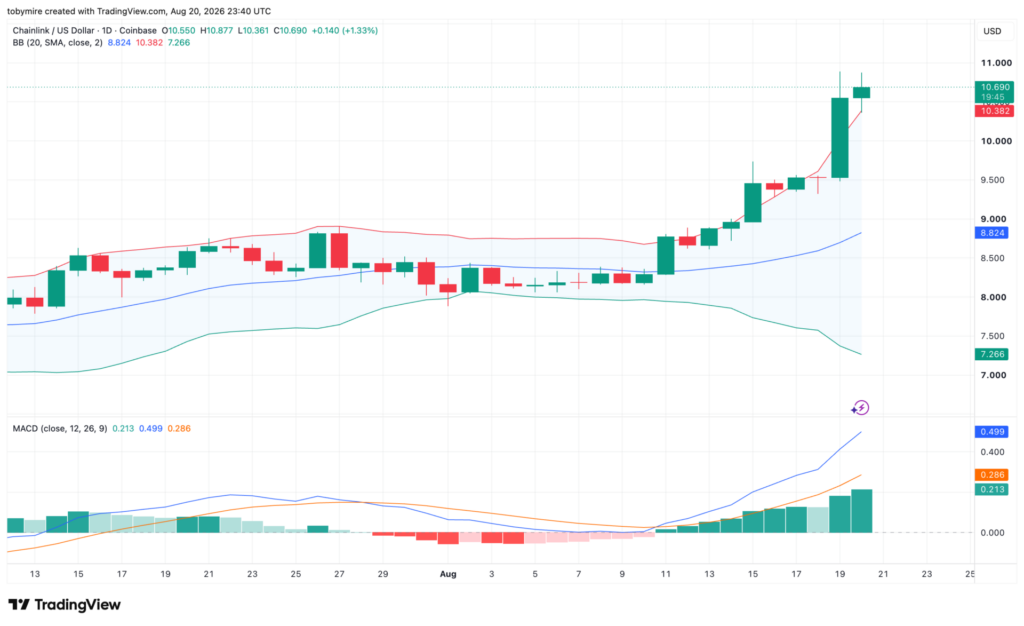
As of August 20, $LINK is trading around $10.69 after gaining 1.33% in the current daily session, continuing the powerful breakout that lifted the price from around $8.20 in early August. The token is now trading above the upper Bollinger Band at $10.38 and approximately 21% above the midline at $8.82, highlighting exceptionally strong bullish momentum but also an increasingly overextended market.
$LINK/$USDT : TradingView

The daily MACD strongly supports the rally, with the MACD line at 0.499, significantly above the signal line at 0.286, and the histogram at a positive 0.213. This indicates momentum is still accelerating, not showing a confirmed reversal. The nearest test is in the $10.88-$11.00 area; a confident breakout could continue the advance, while failure to overcome this level might trigger profit-taking around $10.38 and potentially $10.00.

4-Hour Chainlink Price Chart

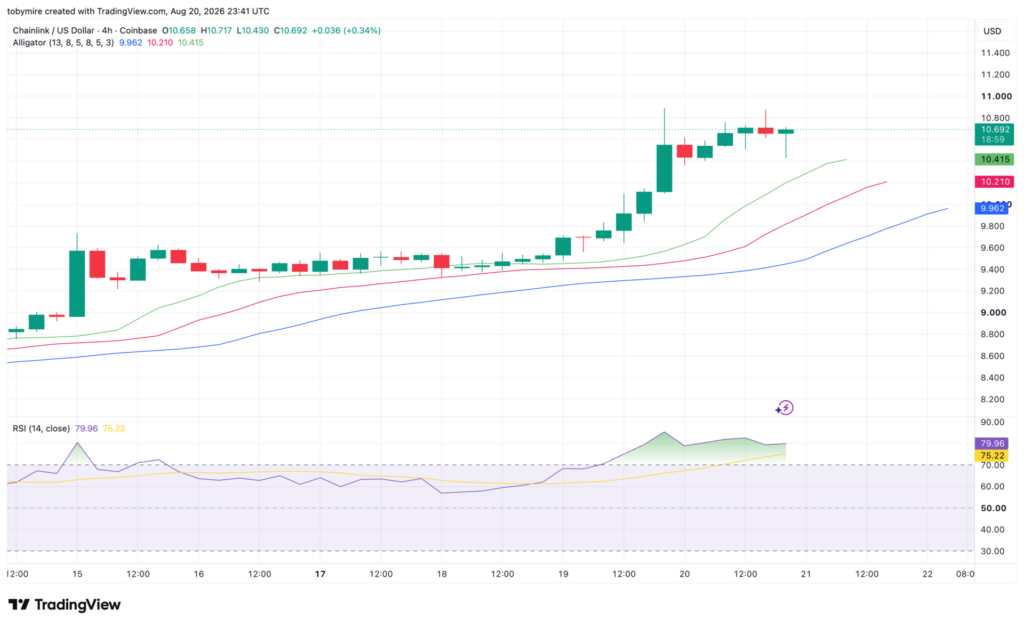
The 4-hour market structure remains firmly bullish, with $LINK at $10.69 and confidently above all three Alligator moving averages at $10.42, $10.21, and $9.96. Their bullish alignment confirms the short-term trend still favors buyers, though after the rapid climb, the price has begun consolidating in the $10.60-$10.70 range.
$LINK/$USDT : TradingView

The main warning sign comes from the RSI, which reached 79.96 and is firmly in overbought territory. This doesn't mean a guaranteed reversal but increases the likelihood of consolidation or a pullback before another sustained upward move. Holding the $10.40 level will keep the bullish trend intact, while a break below $10.20 would indicate a more substantial loss of momentum.

Chainlink Technical Indicators: Levels & Actions

Daily Simple Moving Average (SMA)

Period Value Action
SMA 3 $9.89 BUY
SMA 5 $9.72 BUY
SMA 10 $9.23 BUY
SMA 21 $8.70 BUY
SMA 50 $8.41 BUY
SMA 100 $8.47 BUY
SMA 200 $8.78 BUY

Daily Exponential Moving Average (EMA)

Period Value Action
EMA 3 $10.03 BUY
EMA 5 $9.77 BUY
EMA 10 $9.37 BUY
EMA 21 $8.95 BUY
EMA 50 $8.60 BUY
EMA 100 $8.66 BUY
EMA 200 $9.72 BUY

What to Expect from Chainlink?

The trend remains bullish, but $LINK is in overbought territory after a sharp climb. A breakout above $11 could continue the rise, while a rejection from this level would make a short-term decline to $10.40-$10.00 increasingly likely.

Is Chainlink a Good Investment?

Chainlink remains a key player in the blockchain ecosystem, as growing demand for its decentralized oracle services and strategic partnerships support its long-term adoption.

Moderate selling pressure persists, but the network's ongoing utility and practical applications indicate sustainable growth potential in the long run. Traders and investors should closely monitor key support and resistance levels to make informed decisions and manage risks effectively.

Will Chainlink Reach $50?

According to long-term industry expert forecasts, Chainlink ($LINK) is expected to approach $50 by 2032.

Does Chainlink Have a Promising Long-Term Future?

Chainlink shows signs of stabilization and recovery potential, pointing to a bullish trend and a promising long-term future for the token in the blockchain industry.

Latest Chainlink News

The Wyoming Stable Token Commission has migrated its Frontier (FRNT) stablecoin from the LayerZero Stargate bridge to Chainlink CCIP, making CCIP the exclusive infrastructure for all cross-chain FRNT transfers. The Commission stated the migration followed thorough security review, with future bridging to be conducted via Transporter.

NEWS: The Wyoming Stable Token Commission (@wyostable) is sunsetting its legacy bridge and moving the Frontier (FRNT) stablecoin to Chainlink CCIP.

As a leader in digital asset policy, Wyoming is raising the security bar by choosing Chainlink as its exclusive cross-chain infrastructure. https://t.co/7KZILREyaZ pic.twitter.com/Rn2UU7Whx4

— Chainlink (@chainlink) August 18, 2026

Chainlink Price Forecast for August 2026

In August 2026, the minimum forecasted price is $7.19, with the average around $9.16. The peak price of $LINK is expected to reach $11.51.

Chainlink Price Forecast Potential Low Average Price Potential High
August 2026 $7.19 $9.16 $11.51

Chainlink Price ($LINK) Forecast for 2026

$LINK's market price is expected to reach a high of $17.00 in 2026. However, traders can expect a low price of $7.00, influenced by overall market capitalization and external data sources. The average Chainlink price is forecast to be $11.38.

Chainlink Price Forecast Potential Low Average Price Potential High
Chainlink Price Forecast 2026 $7.00 $11.38 $17.00

Chainlink Price Forecast for 2027-2032

Year Minimum ($) Average Price ($) Maximum ($)
2027 8.01 13.02 19.46
2028 8.40 13.66 20.41
2029 11.74 19.11 28.53
2030 15.10 24.57 36.68
2031 18.44 30.01 44.80
2032 21.78 35.45 52.95

Chainlink Price Forecast for 2027

In 2027, Chainlink's price is expected to reach a high of $19.46, a low of $8.01, and an average price of $13.02.

Chainlink Price Forecast for 2028

In 2028, the average price of $LINK is expected to be $13.66; the minimum and maximum trading prices, based on historical performance, are forecast to be $8.40 and $20.41, respectively.

Chainlink Price Forecast for 2029

The forecasted Chainlink price for 2029 is a maximum of $28.53. The minimum price will reach $11.74, with an average of $19.11.

Chainlink Price Forecast for 2030

According to the Chainlink price forecast for 2030, the price of $LINK will range from $15.10 to $36.68, with an average price of $24.57.

Chainlink Price Forecast for 2031

According to Chainlink forecasts, in 2031, the maximum price of $LINK will reach $44.80, the minimum $18.44, and the average $30.01.

Chainlink Price Forecast for 2032

The Chainlink forecast rises even higher, up to 2032. According to the forecast, the price of $LINK will range from $21.78 to $52.95, with an average price of $35.45.
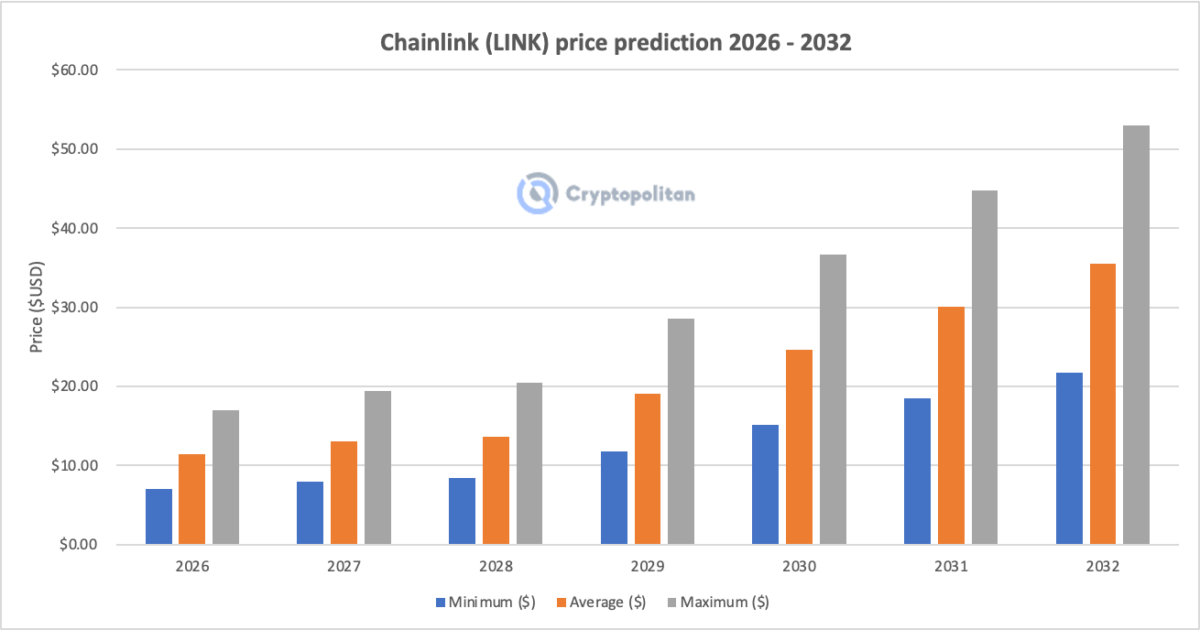
Chainlink Price Forecast 2026-2032 | Source: Cryptopolitan

Chainlink Market Price Forecast: Analyst $LINK Price Forecast

Firm Name 2026 2027
CoinCodex $12.69 $25.54
DigitalCoinPrice $8.30 $8.14

Chainlink Price Forecast from Cryptopolitan

According to our Chainlink price forecast, the coin's market value could reach a maximum of $15 by the end of 2026. In 2028, $LINK's value could soar to a maximum price of $30.

Historical Chainlink Market Sentiment
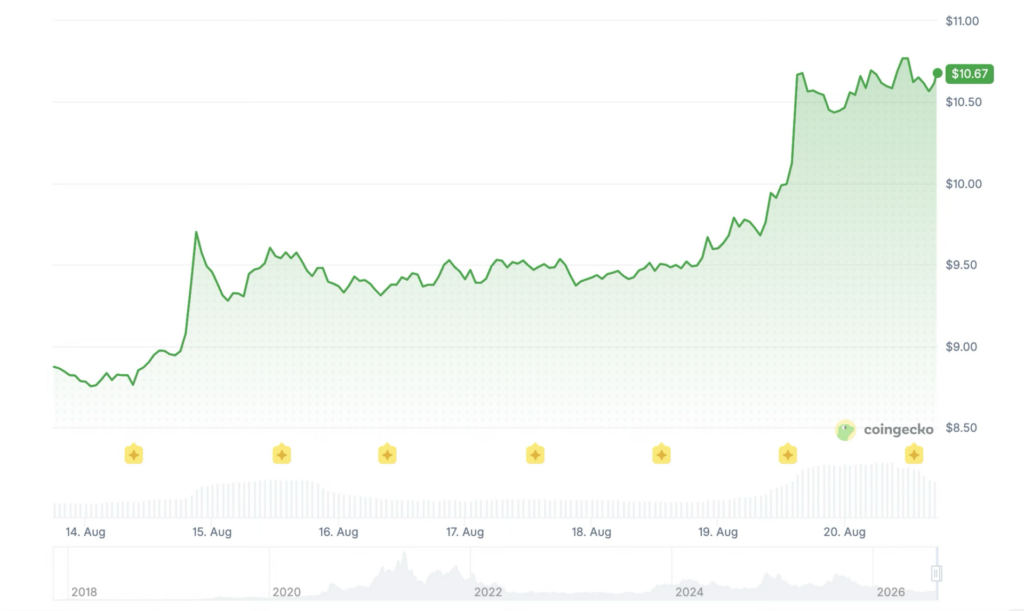
Chainlink Price History : Coingecko
  • Chainlink launched at around $0.20 and remained below $1 throughout 2018 before surpassing $3 by late 2019 due to the expansion of its oracle network usage.
  • In 2020, $LINK made a major breakout, climbing from roughly $2 to $20 during the DeFi boom, then reached its all-time high around $52 in May 2021 before sharply declining with the broader market.
  • In 2022 and 2023, $LINK mostly traded in the $6-$25 range as bearish sentiment dominated crypto markets. Recovery began in 2024, with the coin rising to $30.94 in December after fluctuating between $10 and $18 for most of the year.
  • In 2025, $LINK peaked at $22.90 in January, traded mostly in the $13-$16 range for the year, briefly rose above $23 in September, and ended the year around $14.67.
  • In 2026, Chainlink remained under pressure, trading between $13.6-$14.2 in January, dropping to $7.40 in February, and fluctuating between $8.29-$10.05 in March. In April, $LINK's average price was around $9, and in May, around $9.55.
  • In June, $LINK weakened further, trading roughly between $7.00-$8.30. In July, it saw a slight recovery, trading between $7.10-$8.90 with an average price around $8.09.
  • In August, $LINK traded roughly between $8.13-$10.63, continuing its recovery from early-month lows. As of August 20, Chainlink is trading around $10.63, having risen approximately 0.75% in the past 24 hours, with movement above $10 indicating notable improvement compared to the range observed earlier in August.
end-content

Cryptos en tendance

Questions liées

QAccording to the technical analysis, what is the current RSI (14-day) level for Chainlink and what does it indicate about the market?

AThe current 14-day RSI for Chainlink is 80.77, which is in the overbought territory. This indicates a high likelihood of a consolidation or price correction in the near term, as the market may be overheated after a strong rally.

QWhat is the key resistance level mentioned for Chainlink's price on the daily chart, and what is the critical support level to watch?

AThe key resistance level on the daily chart is the $10.88-$11.00 range. A clear breakout above this could extend the rally. The critical support level is $10.40. Holding above this keeps buyers in control, while a drop below $10.20 increases the risk of a deeper correction.

QWhat was the major news update related to Chainlink's CCIP protocol mentioned in the article?

AThe Wyoming Stable Token Commission migrated its stable token, Frontier (FRNT), from the LayerZero Stargate bridge to the Chainlink Cross-Chain Interoperability Protocol (CCIP). This makes CCIP the exclusive infrastructure for all FRNT cross-chain transfers, following a thorough security review, with future bridging to be handled via Transporter.

QWhat is the long-term price forecast for Chainlink (LINK) for the year 2032 according to the provided table?

AAccording to the long-term price forecast table, the predicted price range for Chainlink (LINK) in 2032 is a low of $21.78, an average price of $35.45, and a potential high of $52.95.

QBased on the article's analysis, is Chainlink considered a good long-term investment and why?

AYes, the article suggests Chainlink is considered a promising long-term investment. It remains a key player in the blockchain ecosystem due to growing demand for its decentralized oracle services and strategic partnerships, which support long-term adoption. Its practical utility indicates sustained growth potential, though investors should monitor key support and resistance levels to manage risk effectively.

Lectures associées

Pourquoi le Trésor américain intensifie ses rachats de dette à long terme, et pourquoi l'or et le Bitcoin montent-ils ?

Le Trésor américain a annoncé un doublement du programme de rachat de ses obligations à long terme à partir du 9 septembre, une mesure visant à soutenir la liquidité du marché. Cette décision, intervenue dans un contexte de hausse continue des rendements obligataires et d'affaiblissement du dollar, a ravivé les craintes d'une dépréciation de la devise américaine, servant de catalyseur principal à une forte hausse du bitcoin et de l'or. Le bitcoin a connu une progression particulièrement marquée, avec des gains quotidiens d'environ 6% pendant trois séances consécutives. L'or a également bénéficié de la faiblesse du dollar, franchissant sa moyenne mobile sur 200 jours. Les analystes expliquent que l'annonce du Trésor a relancé le "trade de dépréciation monétaire", poussant les investisseurs vers des actifs considérés comme des valeurs refuges face à l'érosion anticipée du pouvoir d'achat du dollar. Cependant, le marché obligataire est resté sceptique, les rendements des obligations à 10 et 30 ans étant rapidement revenus à leurs niveaux d'avant l'annonce. Cette réaction met en doute l'efficacité réelle de l'opération pour soulager la pression sur les taux à long terme. Des facteurs supplémentaires, comme une réunion à la Maison Blanche sur la régulation des cryptomonnaies et des rachats forcés de positions vendeuses sur le bitcoin, ont aussi contribué à la hausse. En définitive, bien que l'intervention du Trésor ait provoqué un mouvement de fuite vers les actifs tangibles, elle ne semble pas avoir modifié les dynamiques fondamentales du marché obligataire, où persistent les inquiétudes concernant le déficit budgétaire, l'inflation et le fardeau de la dette publique américaine.

华尔街日报Il y a 2 h

Pourquoi le Trésor américain intensifie ses rachats de dette à long terme, et pourquoi l'or et le Bitcoin montent-ils ?

华尔街日报Il y a 2 h

Le mystérieux grand modèle « Ox Alpha » fait le buzz, gratuit pour un temps limité

Le monde des grands modèles de langage (LLM) est en effervescence avec l'apparition d'Ox Alpha, un modèle anonyme surnommé « Niu Lai » par les internautes chinois. Proposé gratuitement et temporairement sur OpenRouter, il dispose d'un contexte de 1 million de tokens et prend en charge texte, images et vidéos. Son évaluation sur des tâches d'ingénierie logicielle réelles (benchmark DeepSWE) montre des performances impressionnantes, avec un taux de réussite initial de 80% sur un sous-ensemble de tests, rivalisant ainsi avec les meilleurs modèles de codage actuels. Bien que d'autres tests aient rapporté un score d'environ 63%, son fort potentiel est établi. Son origine fait l'objet de vives spéculations. Plusieurs indices techniques pointent vers une version non publiée de GLM-5.3 (probablement GLM-5.3 Flash ou sa variante multimodale) développée par Zhipu AI : alignement parfait du comptage de tokens visuels et textuels avec GLM-5V-Turbo/GLM-5.3, comportements de refus et style de réponse similaires. L'entreprise n'a cependant pas confirmé. Parallèlement, un autre modèle anonyme nommé « korrine » apparaît sur Code Arena, suscitant des hypothèses le liant à Kimi, Qwen ou MiMo. Cette tendance au test anonyme (« sous couverture ») permet aux développeurs d'évaluer objectivement les capacités des modèles, sans biais de marque, et de les soumettre à des tests de stress en conditions réelles avant un lancement officiel, tout en générant du buzz marketing. La performance d'Ox Alpha, s'il s'agit bien d'un modèle « Flash » (version allégée), laisse entrevoir un potentiel encore plus élevé pour les versions complètes à venir.

marsbitIl y a 4 h

Le mystérieux grand modèle « Ox Alpha » fait le buzz, gratuit pour un temps limité

marsbitIl y a 4 h

Bitwise CIO Matt : Si vous avez actuellement une configuration crypto de 0 %, cela équivaut à être activement baissier sur le marché

Matt Hougan, CIO de Bitwise, analyse la dynamique actuelle du marché cryptographique malgré une baisse de 50% depuis les sommets. Il souligne l'engagement persistant de Wall Street, citant le lancement de fonds tokenisés par BlackRock malgré les retards réglementaires comme le CLARITY Act. Hougan estime que ce projet de loi restera dans un état d'incertitude, mais que l'industrie avancera sans lui, soutenue par les grandes institutions financières. Il observe un changement de comportement du Bitcoin, désormais résistant aux mauvaises nouvelles, signe pour lui de la fin d'un marché baissier. Concernant l'investissement, il explique que le DCA (moyenne par coût) est une assurance comportementale, mais qu'une entrée immédiate est justifiée pour les rendements absolus, anticipant une reprise. Hougan note que les grandes plateformes de gestion de patrimoine (Wells Fargo, UBS) considèrent désormais la crypto comme une classe d'actifs à part entière, se focalisant sur le long terme. Il met en avant les opportunités de la gestion d'actifs on-chain et du thème de la tokenisation d'actifs réels (RWA), bénéfiques pour Ethereum, Solana et Chainlink. Son conseil principal : une allocation de 5% en crypto est un "repas gratuit", améliorant significativement les rendements sans augmenter la volatilité globale du portefeuille. À l'inverse, une allocation de 0% n'est pas une position neutre, mais un pari actif très baissier sur l'avenir de cette classe d'actifs.

marsbitIl y a 4 h

Bitwise CIO Matt : Si vous avez actuellement une configuration crypto de 0 %, cela équivaut à être activement baissier sur le marché

marsbitIl y a 4 h

À l'instant, le premier match de tennis humain-machine au monde s'est déroulé, un robot a effectué un sauvetage limite, laissant Zheng Jie stupéfaite

Le premier match de tennis humain-robot au monde a eu lieu lors des deuxièmes Jeux mondiaux des robots humanoïdes, diffusé en direct par la télévision centrale de Chine. Le robot humanoïde "Galaxy Star仔" de Galaxy General Robotics a affronté la championne de tennis Zheng Jie en simple, après avoir participé à un double mixte. Le robot a démontré des capacités remarquables : déplacement agile, échanges fluides, service à plus de 100 km/h, et récupération de balles difficiles. Il a même réussi à se relever rapidement après une chute. Cette performance représente un point de rupture dans l'intelligence incarnée, testant en temps réel les limites de la perception, de la prise de décision, du contrôle moteur et de l'adaptation dans un environnement physique dynamique et imprévisible, bien plus complexe que les jeux de stratégie comme les échecs ou le Go. Cette réussite s'appuie sur le modèle d'intelligence incarnée "Galaxy AstraBrain", qui intègre dans une même architecture les fonctions de décision de haut niveau ("cerveau") et de contrôle moteur fin ("cervelet"), éliminant ainsi les délais de communication. Le robot a été entraîné en deux étapes : d'abord par apprentissage à partir de données imparfaites de joueurs humains, puis par un entraînement intensif en simulation où plusieurs agents s'affrontaient, permettant l'émergence autonome de compétences comme le sauvetage extrême ou la technique pour se relever. Cet événement "AstraTennis" marque le passage de l'IA d'un monde numérique à la maîtrise du monde physique, symbolisant les avancées de la Chine dans l'ère de la symbiose carbone-silicium.

marsbitIl y a 5 h

À l'instant, le premier match de tennis humain-machine au monde s'est déroulé, un robot a effectué un sauvetage limite, laissant Zheng Jie stupéfaite

marsbitIl y a 5 h

Soudain, DeepSeek annonce des tarifs creux le week-end, travailler le samedi et dimanche deviendrait plus avantageux ?

DeepSeek a annoncé une modification de sa tarification par période de pointe et creuse pour ses API, effective à partir du 23 août. Désormais, les week-ends (samedi et dimanche) seront entièrement facturés au tarif creux, sans distinction d'heure. Cette décision, généralement bien accueillie par les développeurs qui peuvent ainsi réduire leurs coûts en exécutant des tâches batch le week-end, suscite également des inquiétudes parmi les salariés. En effet, certaines industries, comme celle des mini-séries, ont déjà commencé à ajuster les horaires de travail pour profiter des périodes de calcul AI moins chères. Des cas sont rapportés où des entreprises modifient les plannings, voire imposent du travail le week-end, pour optimiser les dépenses en tokens. Les raisons de ce changement tarifaire font débat. Une hypothèse avance que les prix de pointe correspondent aux périodes d'entraînement des modèles par DeepSeek, libérant la capacité de calcul le week-end. D'autres remettent en cause cette logique, arguant que l'entraînement des modèles est hautement automatisé. Alors que la nouvelle grille tarifaire est en vigueur, la question des impacts à long terme sur l'organisation du travail et des potentielles économies réelles, compte tenu des coûts de coordination supplémentaires, reste ouverte.

marsbitIl y a 5 h

Soudain, DeepSeek annonce des tarifs creux le week-end, travailler le samedi et dimanche deviendrait plus avantageux ?

marsbitIl y a 5 h

Trading

Spot

Articles tendance

Comment acheter LINK

Bienvenue sur HTX.com ! Nous vous permettons d'acheter ChainLink (LINK) de manière simple et pratique. Suivez notre guide étape par étape pour commencer votre parcours crypto.Étape 1 : Création de votre compte HTXUtilisez votre adresse e-mail ou votre numéro de téléphone pour ouvrir un compte sur HTX gratuitement. L'inscription se fait en toute simplicité et débloque toutes les fonctionnalités.Créer mon compteÉtape 2 : Choix du mode de paiement (rubrique Acheter des cryptosCarte de crédit/débit : utilisez votre carte Visa ou Mastercard pour acheter instantanément ChainLink (LINK).Solde :utilisez les fonds du solde de votre compte HTX pour trader en toute simplicité.Prestataire tiers :pour accroître la commodité d'utilisation, nous avons ajouté des modes de paiement populaires tels que Google Pay et Apple Pay.P2P :tradez directement avec d'autres utilisateurs sur HTX.OTC (de gré à gré) : nous offrons des services personnalisés et des taux de change compétitifs aux traders.Étape 3 : stockage de vos ChainLink (LINK)Après avoir acheté vos ChainLink (LINK), stockez-les sur votre compte HTX. Vous pouvez également les envoyer ailleurs via un transfert sur la blockchain ou les utiliser pour trader d'autres cryptos.Étape 4 : tradez des ChainLink (LINK)Tradez facilement ChainLink (LINK) sur le marché Spot de HTX. Il vous suffit d'accéder à votre compte, de sélectionner la paire de trading, d'exécuter vos trades et de les suivre en temps réel. Nous offrons une expérience conviviale aux débutants comme aux traders chevronnés.

1.2k vues totalesPublié le 2024.12.13Mis à jour le 2026.06.02

Comment acheter LINK

Discussions

Bienvenue dans la Communauté HTX. Ici, vous pouvez vous tenir informé(e) des derniers développements de la plateforme et accéder à des analyses de marché professionnelles. Les opinions des utilisateurs sur le prix de LINK (LINK) sont présentées ci-dessous.

活动图片