Chainlink Price Forecast: Standard Chartered Sets $200 Target for LINK, Oracles Secure $33.43 Trillion

cryptonews.ruPublié le 2026-08-11Dernière mise à jour le 2026-08-11

Résumé

Chainlink (LINK) price is testing a key descending trend line at $8.41, with a close above the 100-day EMA at $8.51 signaling a potential technical breakout. Standard Chartered initiated coverage with a long-term $200 price target by 2030, citing projected growth in tokenized assets and DeFi, and set nearer-term targets of $13 by end-2026, $41 (2027), $82 (2028), and $133 (2029). The bank's thesis hinges on LINK capturing fees from data feeds and cross-chain transfers as major institutions like Swift and JPMorgan adopt its services. Fundamentally, Chainlink oracles have secured over $33.43 trillion in total transaction value, dominating the oracle market on three of the top four blockchains (Ethereum, BNB Chain, Base). Its Cross-Chain Interoperability Protocol (CCIP) volume also saw significant quarterly growth. Key technical levels are identified: resistance at $8.51 (100-day EMA) and $9.55 (200-day EMA), with support at $8.27 (20-day EMA) and the SuperTrend at $7.80. The bullish scenario targets a move to $9.55, while a bearish breakdown could see a test of the $7.80 support. The conclusion emphasizes that while fundamentals are strong, a daily close above $8.51 is needed to confirm a breakout.

The Chainlink price forecast now points to $200 by 2030 after Standard Chartered initiated coverage of $LINK, targeting $13 by the end of this year. $LINK is trading at $8.41 today, pressing against the same descending trendline that has capped every recovery attempt since January, with the 100-day EMA at $8.51, a level needed to break for this to turn into a genuine technical breakout.

Chainlink Price Analysis: Will the $LINK Price Rise?
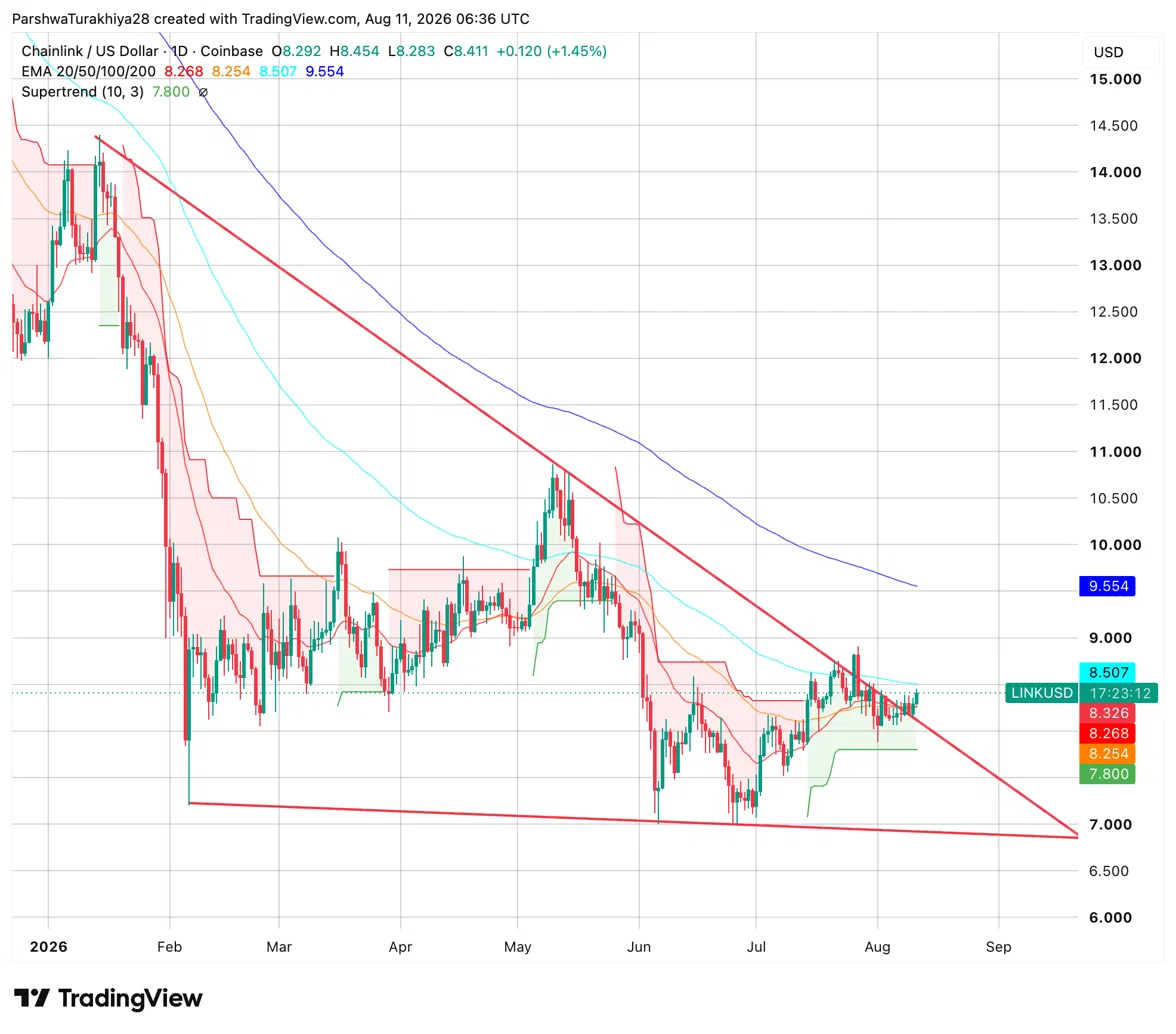
$LINK Price Action (Source: TradingView)

The daily chart shows how $LINK is reaching the upper boundary of the descending trendline, which has capped every significant recovery attempt since January 2026. Today's session opened at $8.29, rose to $8.45, and is holding at $8.41, testing the trendline directly for the first time in weeks. All four EMAs are tightly concentrated just above the current price in the $8.25–$9.55 range, creating a dense resistance zone that needs to be overcome on a breakout.

The 20-day EMA at $8.27 and the 50-day at $8.25 have been reclaimed and now serve as the first support in any pullback. The 100-day level at $8.51 is the immediate ceiling above the trend, followed by the 200-day at $9.55 as the next major target. The Supertrend at $7.80 remains bullish below the price, keeping the short-term trend in favor of buyers. A confirmed daily close above the trendline and the 100-day EMA at $8.51 would be the first significant technical breakout for $LINK all year.

$LINK Support and Resistance Levels, August 11, 2026

Type Price Level
Resistance $8.51 100-day EMA, Nearest Ceiling
Resistance $9.55 200-day EMA, Next Major Target
Resistance $13 Standard Chartered's End-2026 Target
Support $8.27 20-day EMA
Support $8.25 50-day EMA
Support $7.80 Supertrend, Bullish Level Below Price

Chainlink News: Standard Chartered Sets $200 Target by 2030

Standard Chartered has initiated coverage of Chainlink with a target price of $200 by the end of 2030, roughly 25 times current levels. Geoff Kendrick, the bank's Global Head of Digital Assets Research, mapped a phased path: $13 by end-2026, $41 by 2027, $82 by 2028, $133 by 2029, and $200 by 2030.

The core argument is simple. Tokenized assets on-chain are expected to reach $4 trillion by end-2028, and DeFi assets are forecast to grow 37x to $2.7 trillion by 2030. Since Chainlink earns fees each time data is relayed or assets are moved cross-chain, Kendrick expects those fees to rise roughly 25x over the same period, with the token price tracking that fee growth.

A client list lends weight. Swift, DTCC, Euroclear, JPMorgan, Mastercard, UBS, Fidelity, and S&P Global are all current users of Chainlink. As more tokenized funds and bonds come on-chain, these institutions will require more data-relaying services, making them a growing source of recurring income for the network.

On the interoperability side, over $7 billion in token value migrated from legacy bridges to Chainlink's CCIP after a $292 million exploit in April, and CCIP quarterly volume reached $4.9 billion in Q2, up 353% year-over-year.

Standard Chartered $LINK Price Targets Target ($)
End of 2026 $13
End of 2027 $41
End of 2028 $82
End of 2029 $133
End of 2030 $200

Chainlink News: $33.43 Trillion Secured and Dominating Three of Top Four Chains

Chainlink has now secured $33.43 TRILLION in transaction value.

@chainlink's renowned oracles have now enabled $33.43 trillion in total transaction value.

Just four months ago, in April 2026, that figure stood at $30.06 trillion, meaning that...

... $LINK's oracles have... pic.twitter.com/OvLxyW2TMu

— BSCN (@BSCNews) August 11, 2026

Chainlink's oracles have now secured a total transaction value of $33.43 trillion, up from $30.06 trillion in April 2026, meaning over $3 trillion in transactions have passed through Chainlink's infrastructure in just four months. BSCNews noted this milestone as a signal of accelerating real-world usage, not speculative growth.

3 of the top 4 chains are dominated by chainlink👇https://t.co/Cr9vFGqNfj

— bielzin (@bielzinn) August 11, 2026

Meanwhile, analyst Bielzin shared data on oracle market share across top chains on X. Chainlink secures 49.16% of oracle-dependent value on Ethereum, 43.02% on $BNB Chain, and 98.91% on Base. Solana is the exception, where Pyth Network holds 46.23%. Three of the four leading chains are effectively dominated by Chainlink, which is the infrastructure argument underpinning Standard Chartered's fee-based valuation model.

Chain Leading Oracle Market Share
Ethereum Chainlink 49.16%
$BNB Chain Chainlink 43.02%
Base Chainlink 98.91%
Solana Pyth Network 46.23%

$LINK Price Forecast: Upside Targets and Downside Risk

Bull Case, Target: $9.55 (200-day EMA)

$LINK closes daily above the descending trendline and the 100-day EMA at $8.51, confirming the first significant technical breakout of 2026. Standard Chartered's $13 year-end target draws new institutional attention alongside the $33.43 trillion TVS milestone, and continued CCIP volume growth at the current pace adds an earnings catalyst. Maintaining the Supertrend's bullish stance keeps momentum towards the 200-day EMA at $9.55 as the next stop, aligning with the $13 year-end target that implies further upside potential.

Bear Risk, Risk Level: $7.80 (Supertrend)

The descending trendline rejects the price once again, and $LINK loses the 20-day EMA at $8.27 on a daily close. Standard Chartered's coverage brings less price follow-through than UNI's did in June, and the tight EMA cluster above proves too heavy to clear without a broader altcoin catalyst. Price retreats to the Supertrend at $7.80 and risks testing the trendline's lower boundary near $7.00 if that level fails.

Conclusion

The $LINK setup is unusual in that the fundamental story—a $200 target with real fee-paying clients like Swift and JPMorgan—is perhaps stronger than the technical one right now. The chart still has to play its part: a daily close above the trendline and the 100-day EMA at $8.51 will be the first real confirmation of a breakout this year.

Until that happens, Standard Chartered's phased targets and the $33.43 trillion secured value are the fundamental backdrop, not proof a move is starting. Clear $8.51 and $9.55 are in range; lose $7.80, and $LINK likely spends more time testing the lower boundary of its range before any of this materializes.


FAQ: Chainlink Price Forecast

end-content

Cryptos en tendance

Questions liées

QWhat is Standard Chartered's price target for Chainlink ($LINK) by the end of 2030, and what is their initial target for the end of 2026?

AStandard Chartered's price target for Chainlink ($LINK) by the end of 2030 is $200. Their initial target for the end of 2026 is $13.

QAccording to the technical analysis, what two key levels must $LINK's price close above to confirm its first significant technical breakout of the year in 2026?

AAccording to the technical analysis, $LINK's price must close above the descending trend line and the 100-day Exponential Moving Average (EMA) at $8.51 to confirm its first significant technical breakout of 2026.

QAs of August 11, 2026, what is the total transaction value secured by Chainlink's oracles, and how does this figure compare to the value from April 2026?

AAs of August 11, 2026, Chainlink's oracles have secured a total transaction value of $33.43 trillion. This figure represents an increase from $30.06 trillion in April 2026, meaning over $3 trillion in transactions passed through its infrastructure in four months.

QWhat is Jeff Kendrick's primary argument for Standard Chartered's long-term price target on Chainlink, citing expected growth in two specific sectors?

AJeff Kendrick's primary argument is based on expected growth in tokenized assets on-chain, projected to reach $4 trillion by the end of 2028, and DeFi assets, forecasted to grow 37x to $2.7 trillion by 2030. As Chainlink earns fees from data transfers and cross-chain asset movements, he expects these fees to grow approximately 25x, with the token price tracking that growth.

QAccording to the market share analysis cited in the article, on which of the top four blockchains does Chainlink NOT have the leading oracle market share, and which project does?

AAccording to the market share analysis, Chainlink does NOT have the leading oracle market share on Solana. On Solana, the Pyth Network holds the leading market share at 46.23%.

Lectures associées

BIT Recherche : MicroStrategy passe du plus grand acheteur au vendeur, comment les 75 milliards de dollars de pression de vente potentielle affecteront-ils le Bitcoin ?

L'entreprise Strategy (anciennement MicroStrategy), autrefois l'un des acheteurs les plus agressifs de Bitcoin avec une politique de « ne jamais vendre », a commencé à vendre ses actifs en Bitcoin. Ces ventes visent à renforcer ses réserves en dollars, payer des dividendes et intérêts sur actions privilégiées, et racheter ses titres de crédit numériques (Digital Credit Securities). Cette inversion de rôle, d'acheteur structurel à vendeur, constitue une pression à la baisse pour le marché du Bitcoin à court terme. Les estimations indiquent que Strategy pourrait devoir vendre environ 4,5 milliards de dollars de Bitcoin dans les deux à quatre prochains mois, principalement pour réduire le volume de ses titres de crédit numériques. Au-delà de cette société, la pression de vente potentielle pourrait être plus large. Parmi 109 entreprises détenant des réserves de Bitcoin, 28 ont une capitalisation boursière inférieure à la valeur de leur portefeuille Bitcoin (ratio mNAV < 1.0). Pour ces sociétés, vendre une partie de leur Bitcoin et racheter leurs actions pourrait être un moyen de réduire cette décote et de créer de la valeur. Le potentiel de vente combiné de l'ensemble de ces entreprises réservistes pourrait atteindre environ 7,5 milliards de dollars. Cette évolution remet en question le modèle économique antérieur de ces sociétés, qui reposait sur une prime de leur action par rapport à la valeur liquidative de leurs actifs en Bitcoin (NAV). Avec la disparition, voire l'inversion de cette prime, leur capacité à lever des fonds pour acheter davantage de Bitcoin est compromise. Elles pourraient devoir se tourner vers des stratégies génératrices de revenus réels, comme la vente d'options couvertes ou le prêt de BTC. Malgré ces pressions de vente à court terme qui pourraient limiter les rebonds, l'analyse suggère que le Bitcoin est toujours en phase de consolidation basse, avec un creux de cycle possible d'ici la fin du mois ou le mois prochain. Les facteurs clés à surveiller seront l'épuisement des ventes de Strategy, le retour éventuel des achats via les ETF Bitcoin, et la capacité des entreprises réservistes à ajuster leur stratégie pour résorber la décote de leur NAV.

marsbitIl y a 42 mins

BIT Recherche : MicroStrategy passe du plus grand acheteur au vendeur, comment les 75 milliards de dollars de pression de vente potentielle affecteront-ils le Bitcoin ?

marsbitIl y a 42 mins

Elon Musk construit Terafab : la plus grande usine de puces pour l'IA, les robots et les centres de données spatiaux

Elon Musk lance Terafab, une méga-usine de puces pour l'IA, les robots et les data centers spatiaux. SpaceX et Tesla ont lancé le projet Terafab, une usine de semi-conducteurs de plus de 9,3 millions de m² au Texas. La première phase nécessitera 16,8 milliards de dollars d'investissements pour produire des équipements de calcul dépassant 1 térawatt par an, destinés aux robots Optimus, aux véhicules autonomes Cybercab et aux data centers orbitaux. Le gouverneur du Texas, Greg Abbott, a confirmé le projet, promettant 3 000 emplois et un financement de 30 millions de dollars. Elon Musk a souligné l'importance stratégique de regrouper sous un même toit la conception de logique, la production de mémoire et l'assemblage de puces. Il a décrit le complexe comme potentiellement "le plus grand et le plus précieux bâtiment sur Terre", avec une capacité de production allouée à 25% pour la robotique Tesla et 75% pour les systèmes d'IA spatiaux de SpaceX. Intel est le partenaire technologique clé, fournissant son procédé de fabrication 14A. Ce choix vise à diversifier la chaîne d'approvisionnement face à la domination de TSMC. Le projet s'inscrit dans le cadre de l'initiative "Pax Silica" des États-Unis, visant à sécuriser les chaînes d'approvisionnement en semi-conducteurs. D'un point de vue analytique, la réalisation d'un projet de cette envergure reste un défi, comme le montre les retards rencontrés par des projets similaires (ex: Intel en Ohio). Le succès de Terafab dépendra de nombreux facteurs externes et ne sera pas confirmé avant la fin de la décennie.

cryptonews.ruIl y a 1 h

Elon Musk construit Terafab : la plus grande usine de puces pour l'IA, les robots et les centres de données spatiaux

cryptonews.ruIl y a 1 h

La faillite du "Dieu de l'IA" entraîne des pertes de 15 milliards de dollars pour Jane Street en juillet, sa première perte mensuelle depuis dix ans

"Jane Street, l'un des géants du trading proprietary les plus secrets et rentables de Wall Street, a subi une perte rare d'environ 15 milliards de dollars au mois de juillet, sa première perte mensuelle depuis environ dix ans. Cette perte est principalement liée à deux facteurs : des investissements dans le fonds spéculatif axé sur l'IA, Situational Awareness, qui a fait face à des appels de marge et a dû liquider massivement ses positions, ainsi que des pertes sur des positions longues sur des actions non liées à l'IA en Asie. Il s'agit essentiellement d'un revers brutal pour des stratégies de trading qui avaient très bien performé au deuxième trimestre, notamment sur les actions technologiques, semiconducteurs et IA, avant un renversement soudain du marché en juillet. Malgré ce choc, Jane Street maintient une rentabilité globale solide, avec un revenu net de trading dépassant 400 milliards de dollars depuis le début de l'année. La société a réagi en réduisant activement son exposition au risque, fermant une partie des positions problématiques et abaissant le niveau de risque sur d'autres stratégies. Parallèlement, Jane Street procède à une importante restructuration de sa dette, d'environ 14,6 milliards de dollars, pour transférer une partie de son financement du marché public vers des investisseurs privés, acceptant des coûts plus élevés pour plus de confidentialité. L'incident met en lumière les risques de la chaîne du prime brokerage moderne, où des fonds très endettés partageant des expositions similaires (comme à l'IA) et des sources de financement communes peuvent amplifier les crises via des ventes forcées. Pour Jane Street, cet épisode représente un ajustement significatif mais ciblé de sa prise de risque, plutôt qu'une remise en cause de son modèle central."

marsbitIl y a 2 h

La faillite du "Dieu de l'IA" entraîne des pertes de 15 milliards de dollars pour Jane Street en juillet, sa première perte mensuelle depuis dix ans

marsbitIl y a 2 h

Trading

Spot

Articles tendance

Comment acheter LINK

Bienvenue sur HTX.com ! Nous vous permettons d'acheter ChainLink (LINK) de manière simple et pratique. Suivez notre guide étape par étape pour commencer votre parcours crypto.Étape 1 : Création de votre compte HTXUtilisez votre adresse e-mail ou votre numéro de téléphone pour ouvrir un compte sur HTX gratuitement. L'inscription se fait en toute simplicité et débloque toutes les fonctionnalités.Créer mon compteÉtape 2 : Choix du mode de paiement (rubrique Acheter des cryptosCarte de crédit/débit : utilisez votre carte Visa ou Mastercard pour acheter instantanément ChainLink (LINK).Solde :utilisez les fonds du solde de votre compte HTX pour trader en toute simplicité.Prestataire tiers :pour accroître la commodité d'utilisation, nous avons ajouté des modes de paiement populaires tels que Google Pay et Apple Pay.P2P :tradez directement avec d'autres utilisateurs sur HTX.OTC (de gré à gré) : nous offrons des services personnalisés et des taux de change compétitifs aux traders.Étape 3 : stockage de vos ChainLink (LINK)Après avoir acheté vos ChainLink (LINK), stockez-les sur votre compte HTX. Vous pouvez également les envoyer ailleurs via un transfert sur la blockchain ou les utiliser pour trader d'autres cryptos.Étape 4 : tradez des ChainLink (LINK)Tradez facilement ChainLink (LINK) sur le marché Spot de HTX. Il vous suffit d'accéder à votre compte, de sélectionner la paire de trading, d'exécuter vos trades et de les suivre en temps réel. Nous offrons une expérience conviviale aux débutants comme aux traders chevronnés.

1.2k vues totalesPublié le 2024.12.13Mis à jour le 2026.06.02

Comment acheter LINK

Discussions

Bienvenue dans la Communauté HTX. Ici, vous pouvez vous tenir informé(e) des derniers développements de la plateforme et accéder à des analyses de marché professionnelles. Les opinions des utilisateurs sur le prix de LINK (LINK) sont présentées ci-dessous.

活动图片