Ethena rallies 14.5% in a day, but THIS will limit further gains

ambcryptoPublié le 2026-04-09Dernière mise à jour le 2026-04-09

Résumé

Ethena (ENA) rallied 14.6% in 24 hours, extending gains from earlier in the week, partly driven by a broader crypto market boost following former President Trump's ceasefire announcement. The project's plan to diversify its USDe stablecoin reserves into non-crypto assets has also contributed to positive momentum, aiming to address declining yields and supply since the October 2025 market downturn. Despite the recent surge, ENA's overall trend remains bearish. Technical analysis on the 1-day chart shows lower highs, with the RSI below 50 and declining OBV, indicating sustained selling pressure. The price has struggled to break the key $0.095-$0.10 resistance zone, where a cluster of short liquidations is located. The 4-hour chart structure is also bearish, and a break above $0.095 is needed to shift momentum bullishly. Traders are advised to consider taking profits near current levels, as the relief rally may be over, and a downward move could follow. The resistance band remains a significant barrier to further gains.

Ethena [ENA] has rallied 14.6% over the past 24 hours, extending the gains it made on Monday, the 6th of April. The crypto market saw a bullish boost from the short liquidations that followed President Trump’s ceasefire announcement.

Ethena plans to diversify its USDe reserve assets into non-crypto assets, which is why ENA has been rallying even before the announcement. The crypto rout since October 2025 saw declining USDe supply and yield.

The protocol’s founder, Gary Young, had said that Ethena was poorly positioned since that crash. Including non-crypto reserve assets will boost its falling yield and aid market performance.

ENA’s trend remains bearishly poised
Source: ENA/USDT on TradingView

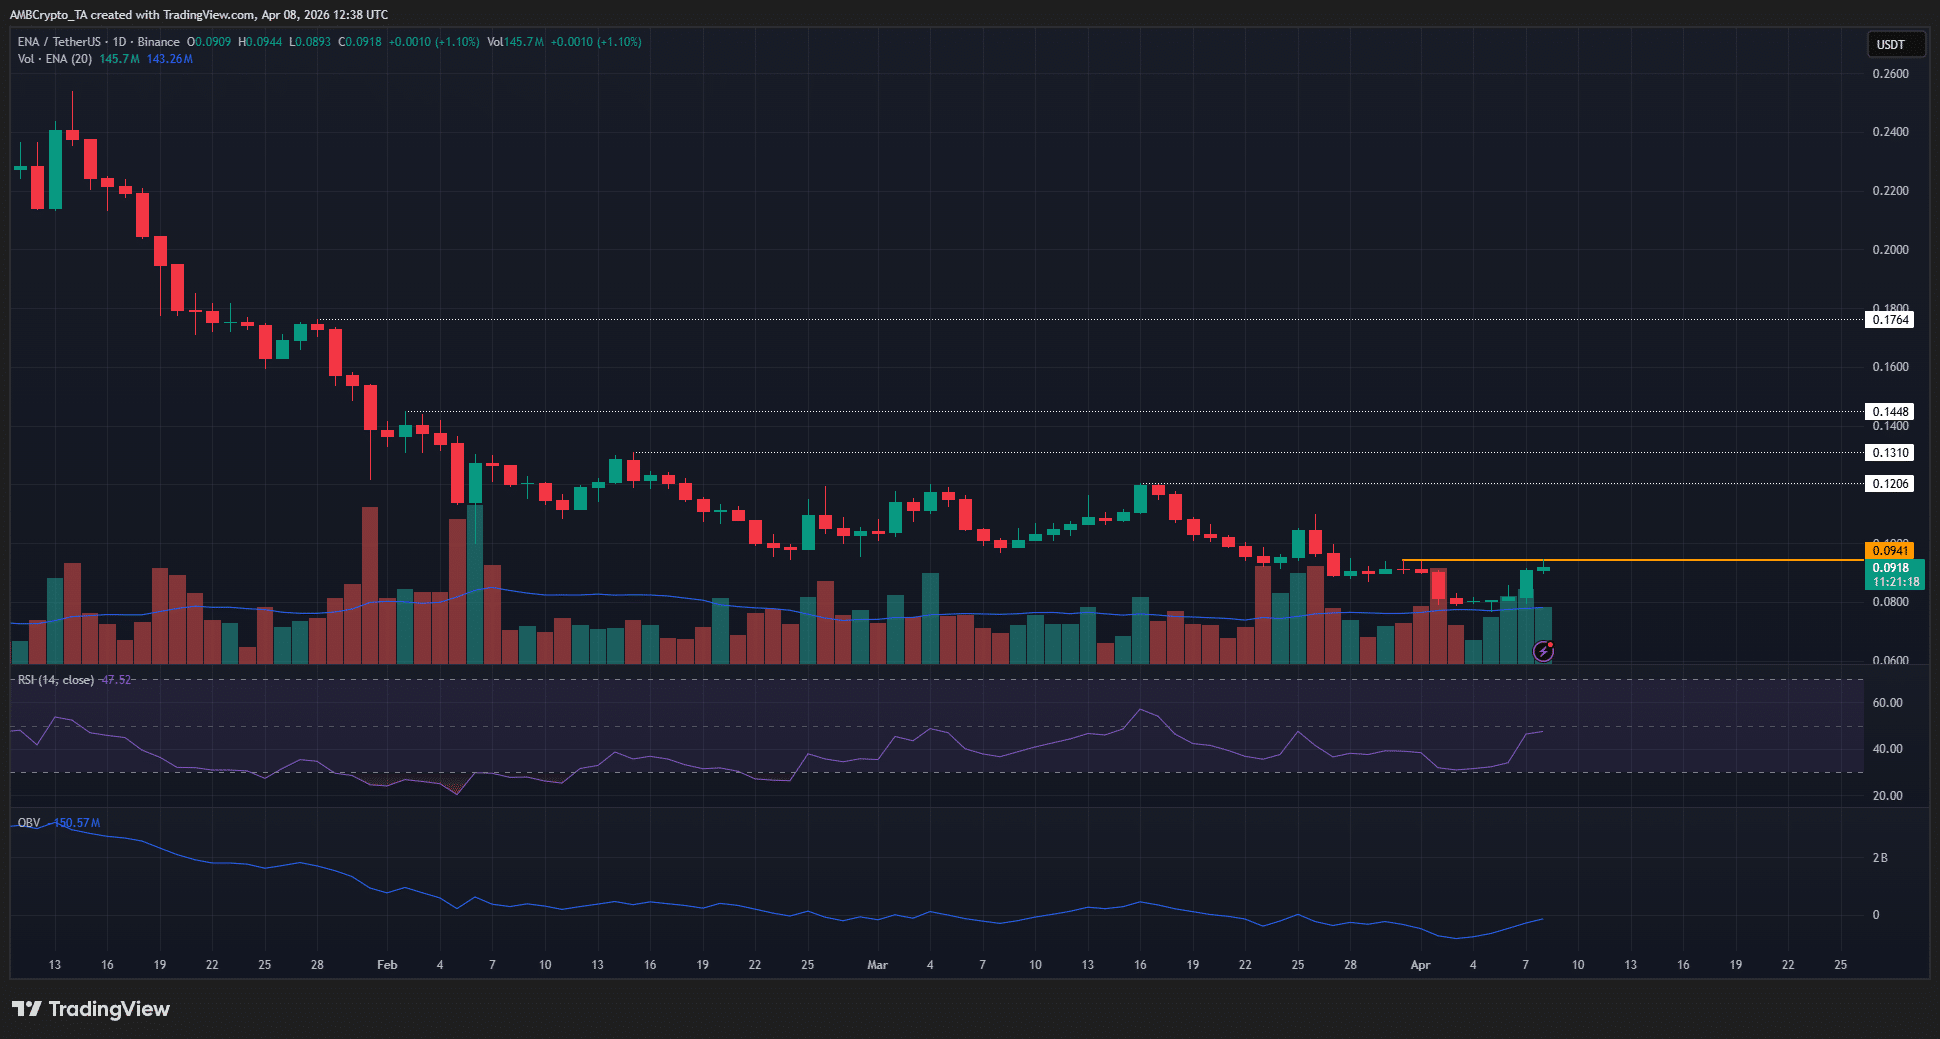
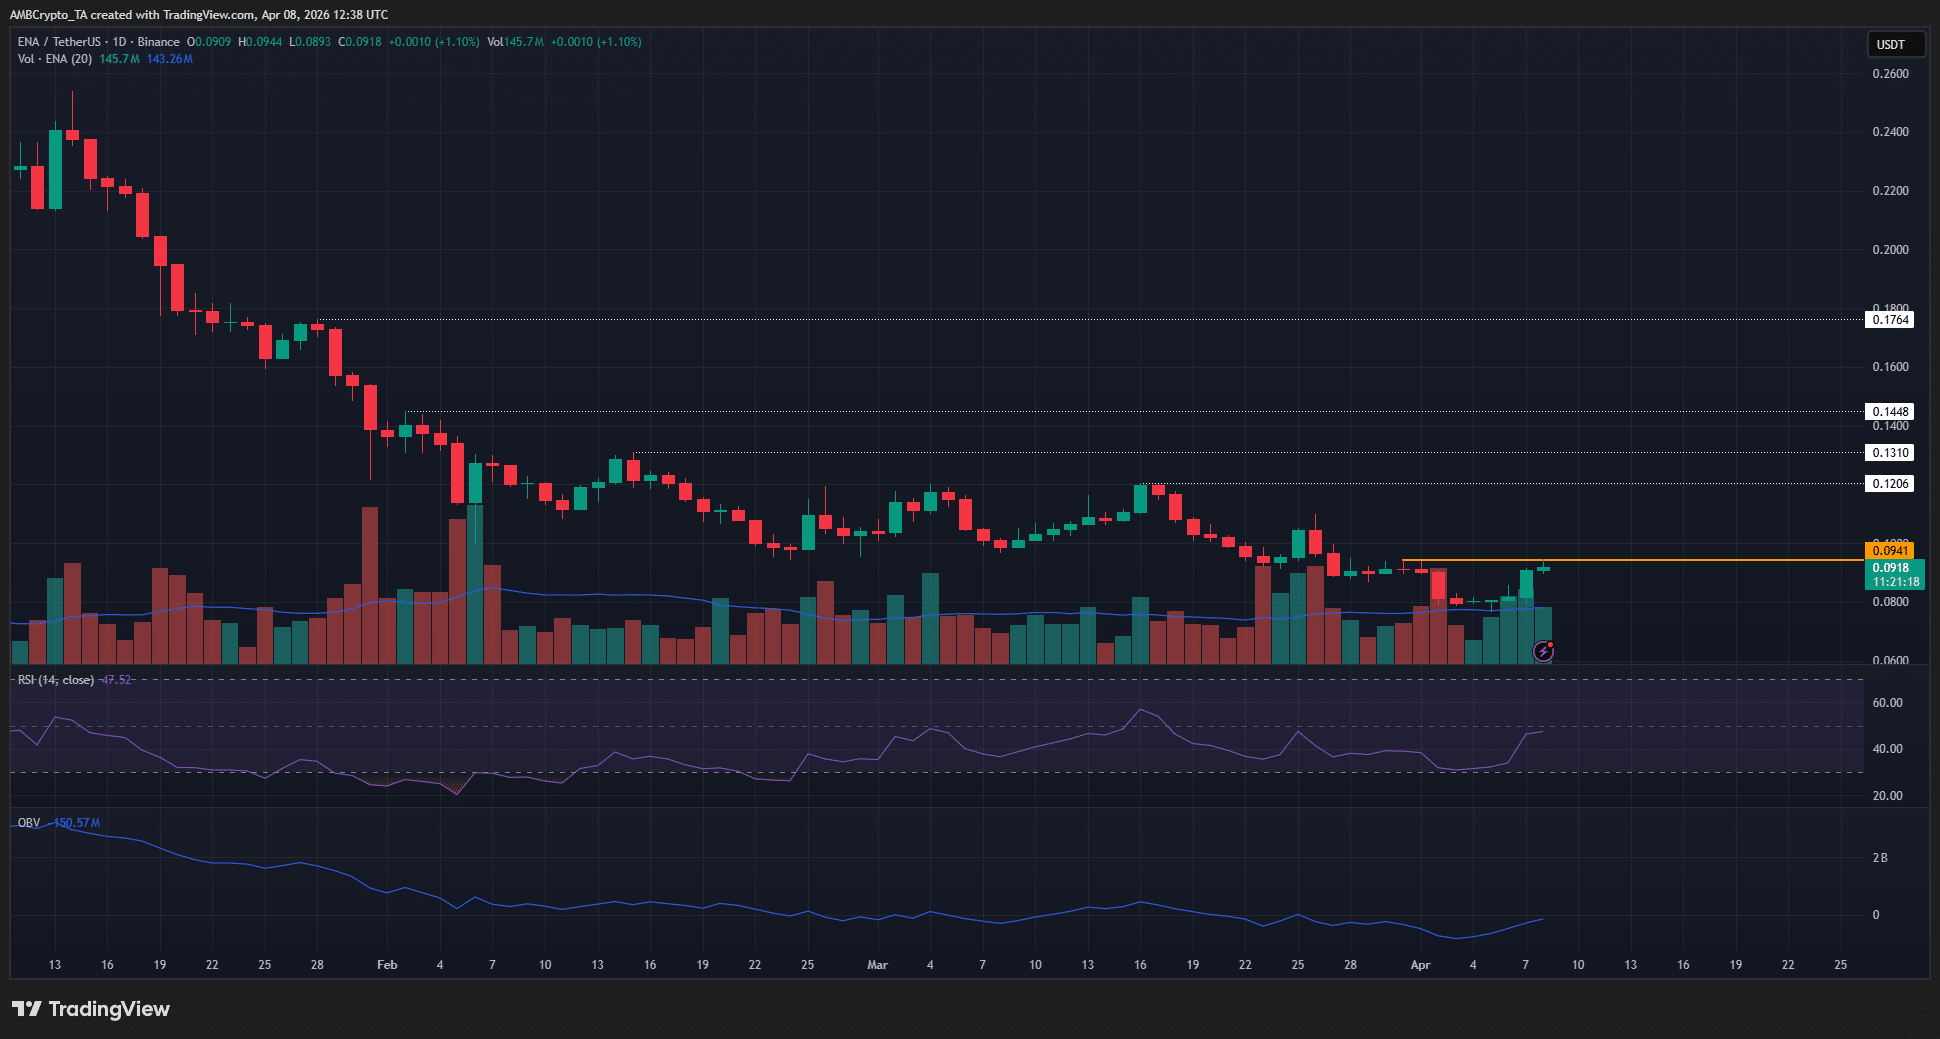
The lower highs on the 1-day timeframe, highlighted in white, showed that Ethena continued to labor under a bearish trend. The RSI was below neutral 50, and the OBV was in a slump, too.

This showed that the trend, selling pressure, and market structure were all in favor of the sellers. Even the rally in recent days, though it was high-volume, was unable to convincingly smash past the $0.094 local highs.

This was a complication for ENA bulls. Or, in a way, some pessimistic participants would say it makes the picture clearer. The sweep of the $0.095-$0.10 local highs means that the Ethena relief rally is over.

A new leg downward can commence from these liquidity pockets.

Traders’ call to action – Sell
Source: CoinGlass

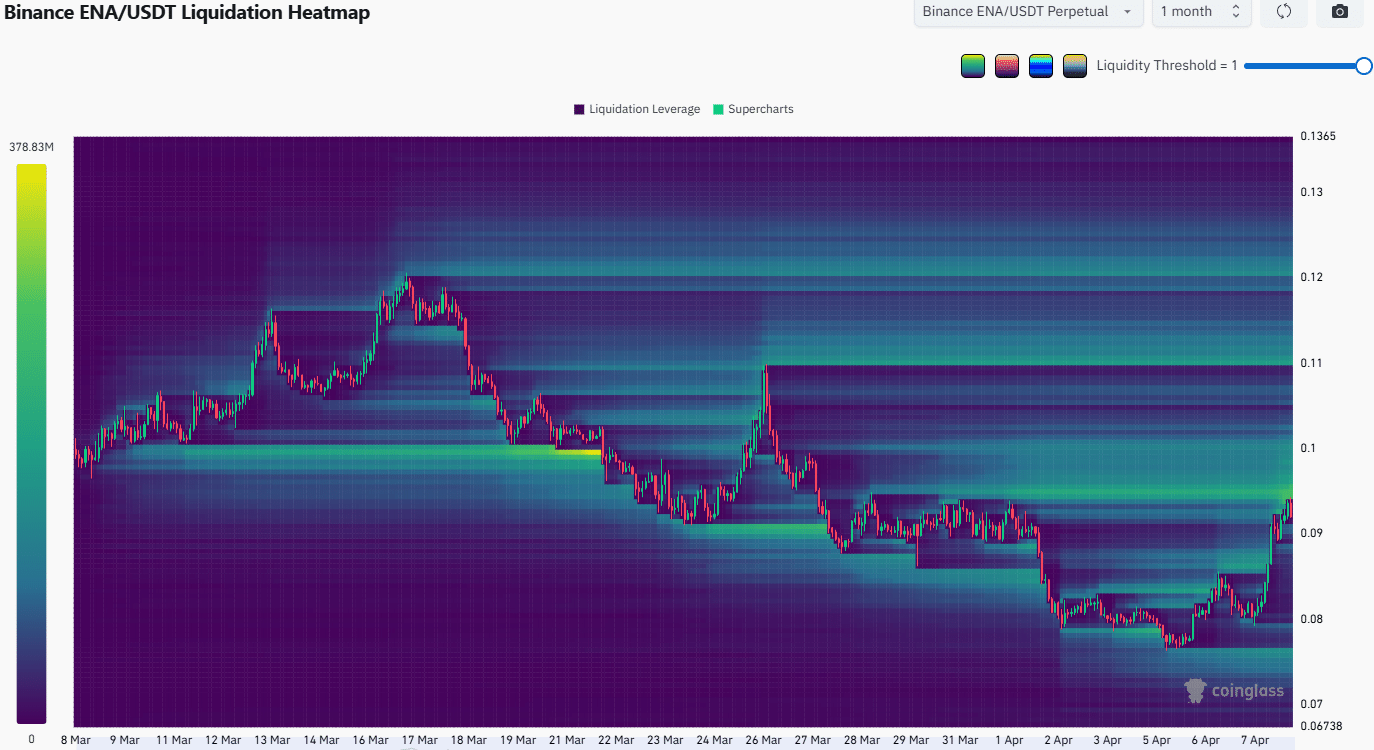
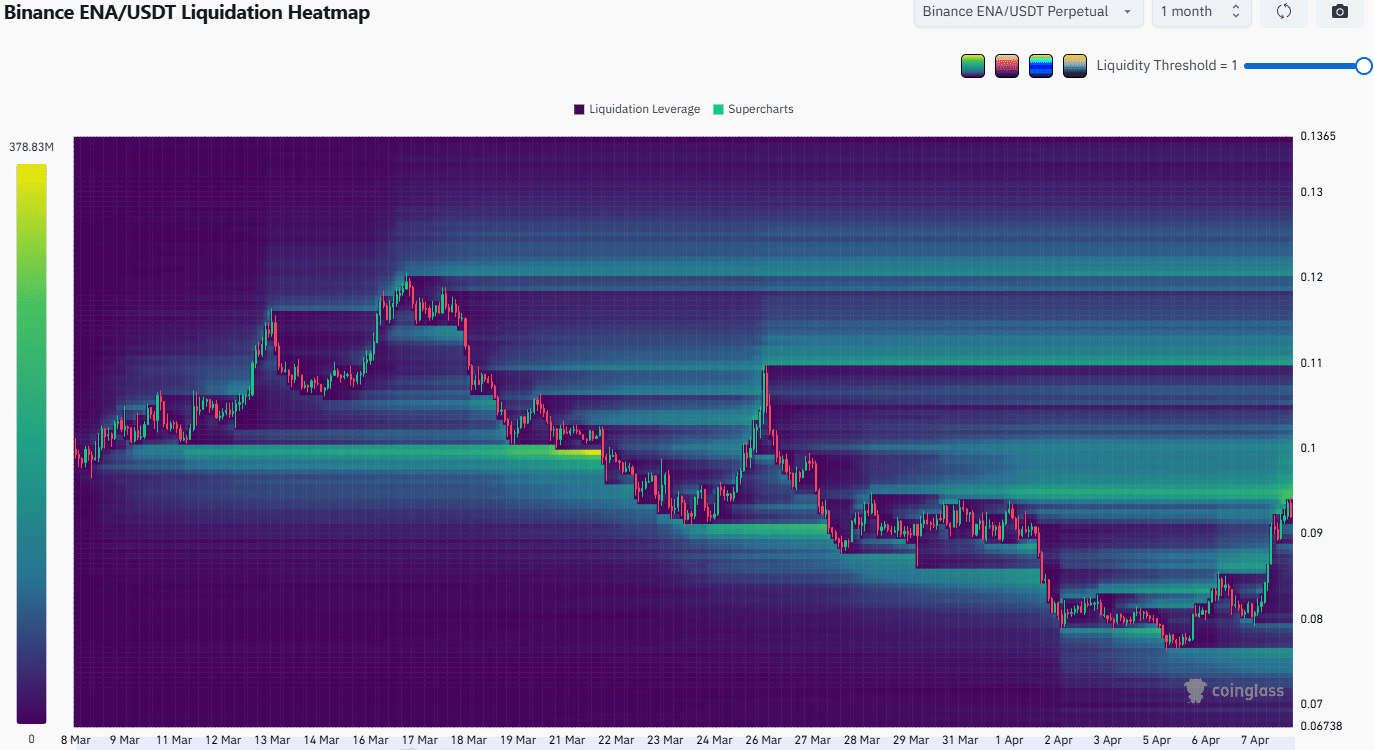
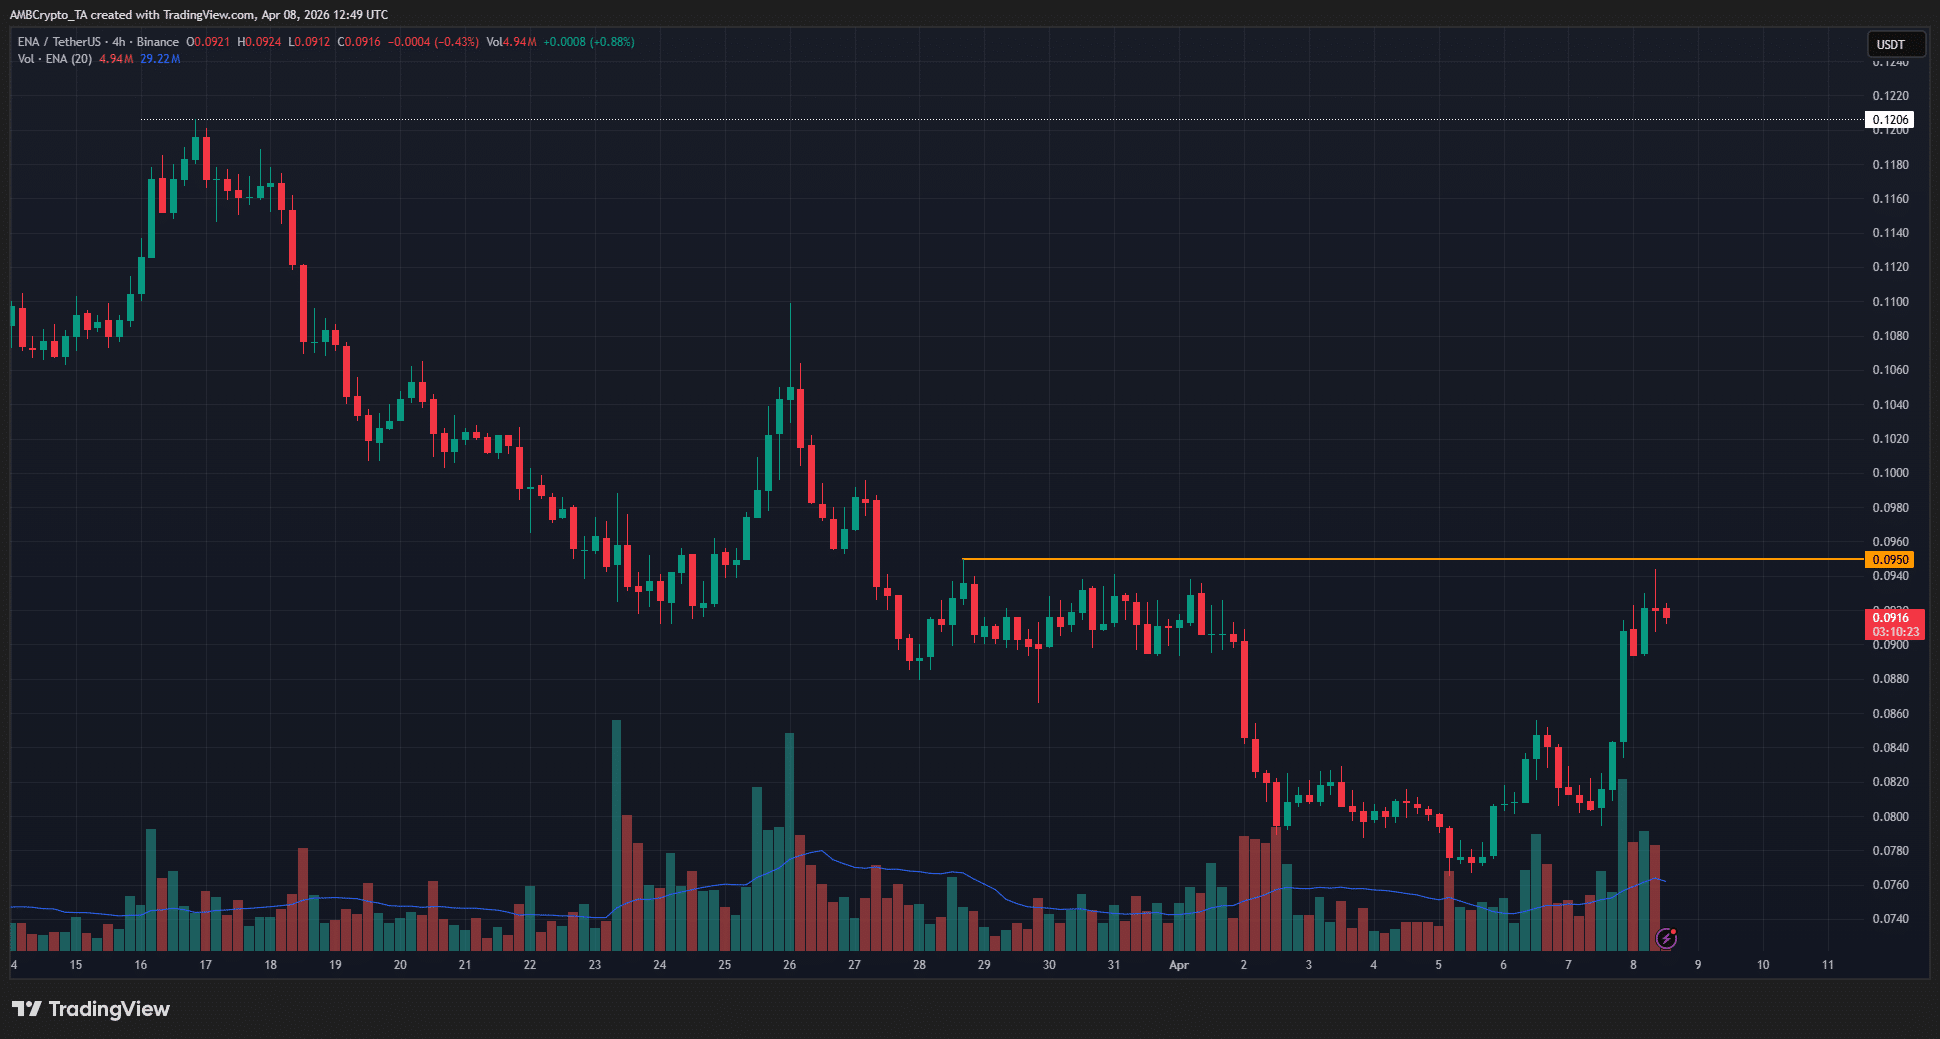
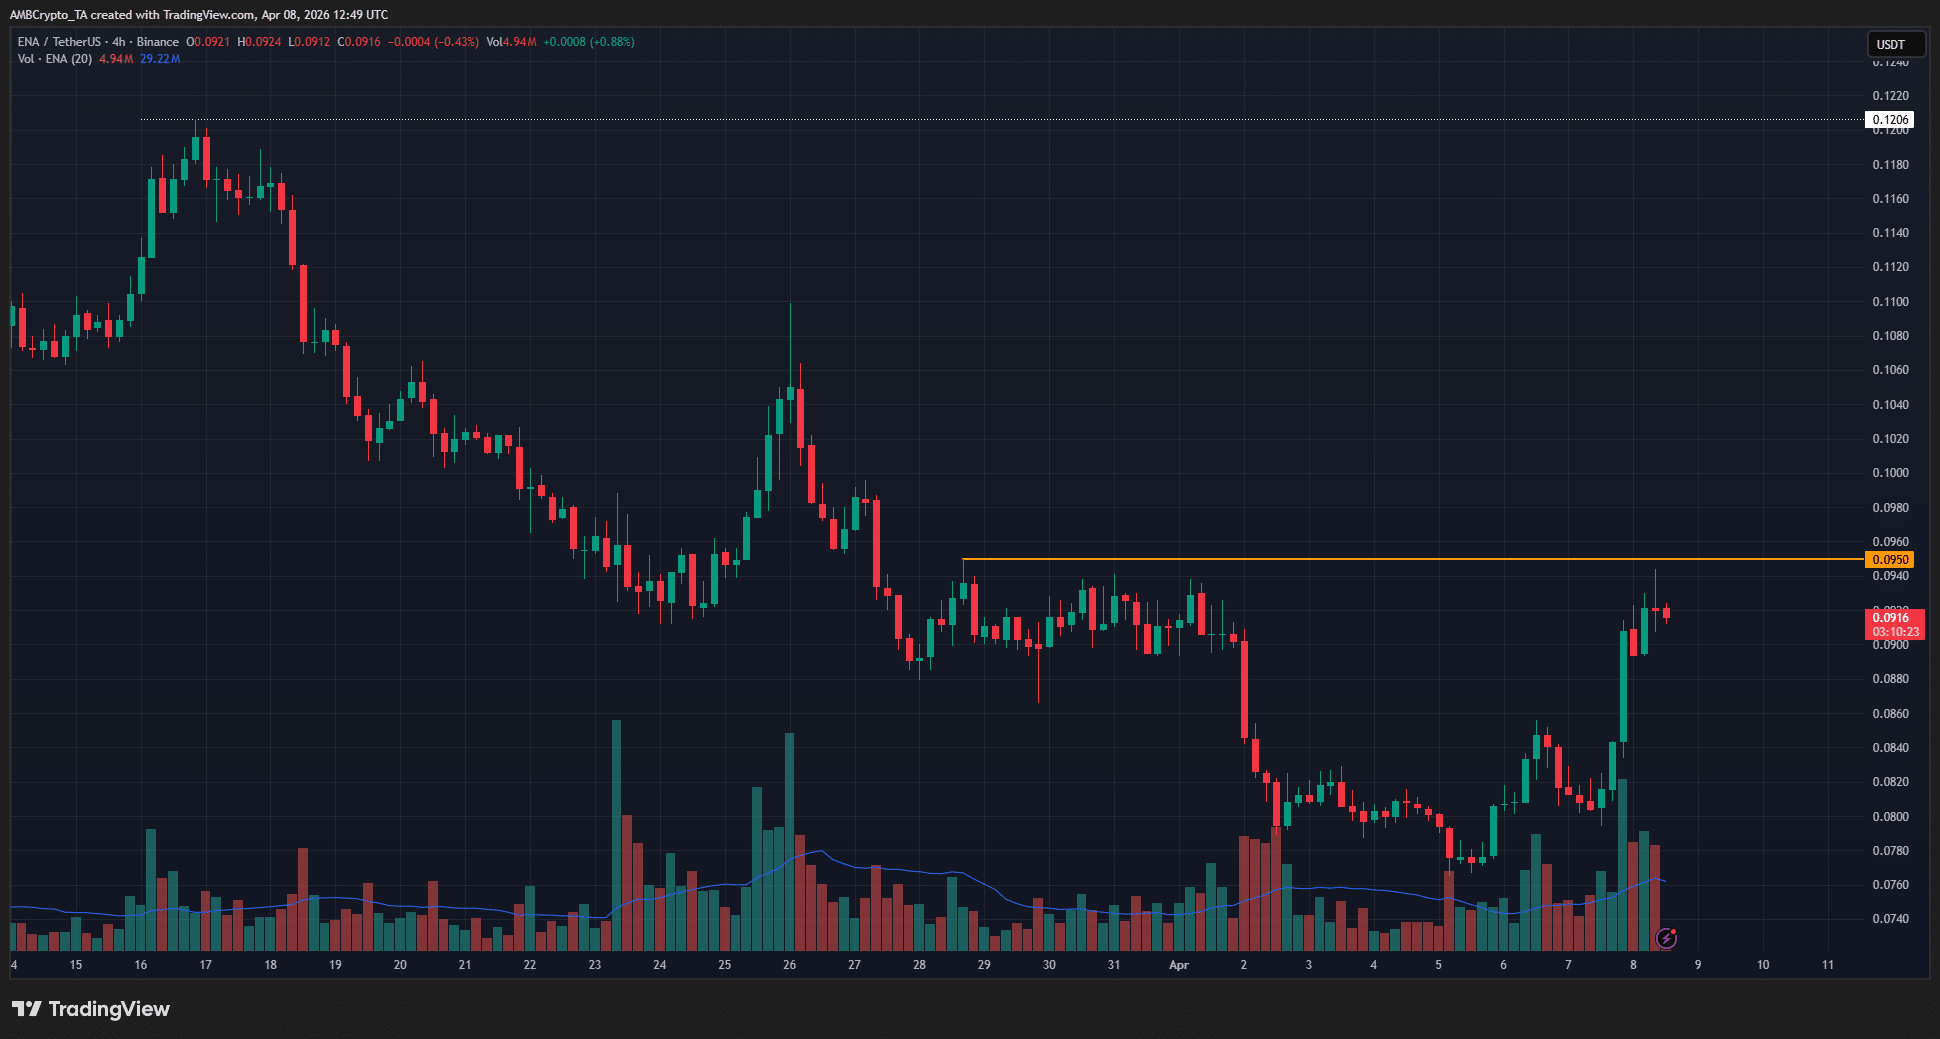
The past month’s liquidation heatmap showed a cluster of short liquidations from $0.094 to $0.10. This was the same band of resistance that the price has struggled to clear in the past 12 hours of trading.
Source: ENA/USDT on TradingView

The 4-hour timeframe’s structure remained bearish. The $0.095 level must be beaten for the swing structure to shift bullishly. A breakout and retest as support can inform bulls that the momentum might continue.

Until then, traders can maintain a bearish bias and look to take profits from the bounce.


Final Summary

  • Ethena has racked up sizeable gains since the start of the week and was aided by the ceasefire announcement and crypto market bounce.
  • The $0.095-$0.10 resistance level remained in place, and traders should be prepared to take profits in this area as the swing structure remained bearish.


Questions liées

QWhat was the main reason behind Ethena's 14.6% price rally in the past 24 hours?

AThe rally was primarily driven by a bullish boost from short liquidations following President Trump's ceasefire announcement, as well as Ethena's plan to diversify its USDe reserve assets into non-crypto assets.

QWhy is Ethena planning to diversify its USDe reserve assets into non-crypto assets?

AThe diversification aims to boost Ethena's falling yield and improve market performance, as the crypto rout since October 2025 led to declining USDe supply and yield, leaving the protocol poorly positioned.

QWhat key resistance level is ENA struggling to break, according to the technical analysis?

AENA is struggling to break the $0.095-$0.10 resistance level, which has been a significant barrier despite recent high-volume rallies.

QWhat do the RSI and OBV indicators suggest about ENA's market trend?

AThe RSI is below the neutral 50 level, and the OBV is in a slump, indicating that the trend, selling pressure, and market structure are all in favor of sellers.

QWhat trading bias does the article recommend for ENA based on its current market structure?

AThe article recommends maintaining a bearish bias and taking profits from the bounce, as the swing structure remains bearish unless ENA convincingly breaks and holds above $0.095.

Lectures associées

Interview avec un cadre de Robinhood : Les mèmes + les actions tokenisées sont une stratégie d'acquisition de clientèle en «haltère», toutes les lignes de produits génèrent des revenus à neuf chiffres

**Résumé :** L'interview de Johann Kerbrat, responsable des activités crypto et internationales de Robinhood, dévoile la stratégie de la plateforme trois semaines après le lancement de sa blockchain, "Robinhood Chain". Cette dernière, basée sur la technologie Arbitrum, enregistre déjà plus de 1,05 milliard de transactions et un volume hebdomadaire de 30 milliards de dollars sur ses DEX. La stratégie, qualifiée de "haltère", combine deux axes : les tokens memes (pour attirer la communauté DeFi et les market makers) et les actifs tokenisés du monde réel (RWA), comme les actions américaines, accessibles dans plus de 120 pays. L'objectif principal est d'amener les 27 millions de comptes financés de Robinhood sur la blockchain en simplifiant radicalement l'expérience utilisateur de la DeFi, par exemple en offrant des rendements via l'application principale sans que l'utilisateur n'ait à gérer un portefeuille privé. Kerbrat souligne une volonté de "fusion" entre la finance centralisée (CeFi) et décentralisée (DeFi). Il minimise la concurrence avec d'autres blockchains comme Base, estimant que l'enjeu est d'"agrandir le gâteau" en démocratisant l'accès aux actifs numériques plutôt que de se disputer des parts de marché. L'accent est mis sur le développement de produits financiers robustes (prêts, trading spot, contrats perpétuels) et sur l'expansion future vers d'autres classes d'actifs tokenisés (actions internationales, marchés privés). La priorité actuelle est l'adoption et l'expérience utilisateur, pas l'optimisation des revenus de la blockchain elle-même.

marsbitIl y a 8 mins

Interview avec un cadre de Robinhood : Les mèmes + les actions tokenisées sont une stratégie d'acquisition de clientèle en «haltère», toutes les lignes de produits génèrent des revenus à neuf chiffres

marsbitIl y a 8 mins

Rapport T3 de Fidelity : BTC, ETH et SOL continuent de former un fond. Jusqu'où ira ce marché baissier crypto ?

Rapport Q3 de Fidelity : BTC, ETH et SOL continuent de chercher un plancher. Jusqu'où ira ce marché baissier ? Le rapport signaux de Fidelity pour le Q3 2026 indique que le marché crypto est en phase de consolidation. Le NUPL pondéré (Net Unrealized Profit/Loss) est tombé à -0.01, signalant que le marché dans son ensemble est légèrement en perte latente. Seul le Bitcoin (BTC) reste en profit, compensant partiellement les pertes d'Ethereum (ETH) et de Solana (SOL). La dominance du BTC a atteint 68%, reflétant une aversion au risque et une concentration des capitaux sur l'actif le plus liquide. Les performances sur un an sont négatives : BTC -45%, ETH -37%, SOL -53%. Plusieurs indicateurs approchent des zones de capitulation historiques. Les flux nets des ETF spot sont largement sortants, avec un record de sorties en juin. Pour le Bitcoin, le NUPL à 0.09 et le "Yardstick" (ratio capitalisation/hashrate) proche de ses plus bas historiques sont considérés comme des signaux positifs à long terme, suggérant une sous-évaluation relative. Cependant, l'impulsion des prix (signal dynamique) reste négative. Ethereum affiche un NUPL profondément négatif à -0.43 (signal positif pour les rendements futurs historiques), mais son activité réseau et ses frais sont en baisse. Les transferts de stablecoins sur ETH dépassent la moyenne historique, montrant une utilité réelle. Solana présente le NUPL le plus faible à -0.72. Malgré la baisse des prix, ses indicateurs d'utilisation fondamentaux restent résilients, avec une activité sur chaîne stable et des transferts de stablecoins en croissance. En se basant sur les cycles de fond de 2018 et 2022 (~300 jours), la correction actuelle de 203 jours pourrait être aux deux tiers de son parcours. Octobre 2026 est un horizon temporel à surveiller, mais ne constitue pas une prédiction de point bas. Le rapport conclut que le marché est dans une phase de recherche de plancher, avec une préférence marquée pour le Bitcoin, et que des conditions de valorisation attractives pourraient émerger pour les investisseurs à long terme.

marsbitIl y a 15 mins

Rapport T3 de Fidelity : BTC, ETH et SOL continuent de former un fond. Jusqu'où ira ce marché baissier crypto ?

marsbitIl y a 15 mins

Trading

Spot
活动图片