[Key interpretation] BTC long-term investors fled with an overall profit of 20%, and eth leverage rebounded

Huobi ResearchPublié le 2022-08-09Dernière mise à jour le 2022-08-10

Résumé

The BTC financing interest rate rebounded and continued to accumulate the energy for changing the price.

1. BTC rose slightly, not exceeding expectations

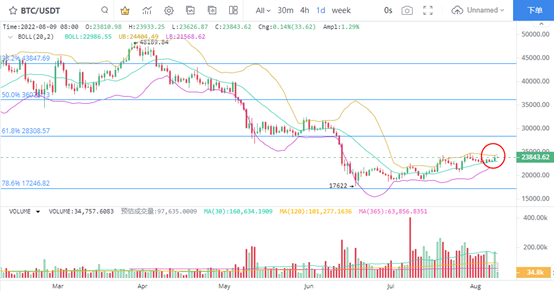
In the daily K-line chart, the BTC price hit a short-term high of US $24000 in one trading day. During the short-term rebound of the price, the increase did not exceed expectations. The reason is that during the two trading days of BTC volume reduction, the trading heat continued to decrease, and the best time point for changing orders was reached.

Considering the increasing differences between long and short contracts in BTC contracts, the number of short contracts increased. At the same time, investors with medium - and long-term currency holdings have expanded their trading profits, and the selling pressure has emerged. The adjustment of expectations is also worthy of attention.

2. Long term investors gain profits on the chain

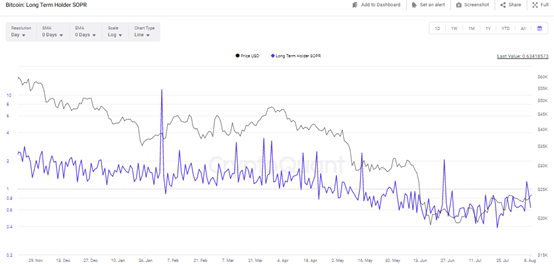
The profit space of BTC's on-line transfer has significantly increased, especially the profit space of the main transfer of medium and long-term currency holding has increased, which means the increase of high selling transactions. On August 6, the SOPR proportion of medium - and long-term currency holders rebounded to 1.20, which means that the main force transferred to BTC when the overall profit was 20%. In the adjustment stage, the main profit transfer shows that the selling pressure increases slightly, and the impact of long cashing income on the price is negative.

3. Investors' BTC transaction financing cost increased

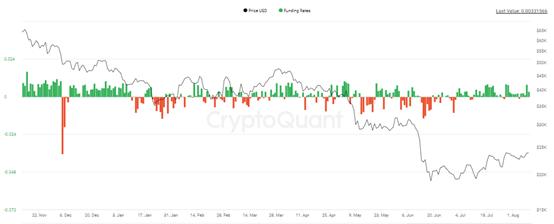
Recently, the overall financing cost of BTC has continued to rebound significantly. Numerically, the financing cost of BTC has not only remained above 0, but also reached 1.0077, indicating that the buying attraction of BTC has increased in the rebound stage. At present, the investor's financing to buy BTC is not strong, which makes the next price performance opportunities less. Nevertheless, the current market performance is still stable. With the purchase price maintained at the current level, the opportunity for BTC to rebound still exists.

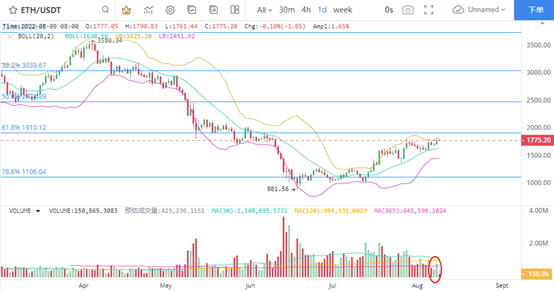
4. Eth trading volume continues to be depressed

The daily K-line trend of eth is relatively stable, and the price contraction rebounds to around us $1910 corresponding to 61.8% of Fibonacci. The price signs face selling pressure and the room for increase is limited. Next, ETH may maintain weak consolidation in the short term, and the price does not send a radical pull signal on the rise, so the performance of the rise needs to be treated with caution.

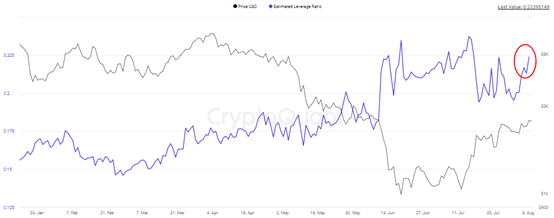
5. Eth estimated leverage rebound

Eth estimated that the leverage ratio rebounded slightly. Numerically, the leverage ratio has reached a short-term high of 0.223, indicating that investors' bets on market changes have increased significantly. Looking back at the performance of the estimated leverage ratio, ETH continues to show strong volatility expectations. At the same time, it is noted that eth faces great breakthrough pressure in terms of price, and short-term trading opportunities in the range of US $1800 to US $1900 can be properly paid attention to.

Lectures associées

Les modèles du monde évoluent de la prédiction vers la planification : HWM et le défi du contrôle à long terme

Le modèle mondial évolue de la prédiction vers la planification, avec HWM (modèle mondial hiérarchique) abordant le défi du contrôle à long terme. Alors que des modèles comme V-JEPA 2 se concentrent sur l'apprentissage de représentations et la prédiction future via l'entraînement sur de vastes données vidéo, ils peinent dans les tâches de contrôle multi-étapes en raison de l'accumulation d'erreurs de prédiction et de l'explosion de l'espace de recherche d'actions. HWM introduit une structure de planification hiérarchique à deux niveaux. Un niveau supérieur planifie le cheminement par étapes sur une échelle de temps longue, tandis qu'un niveau inférieur exécute les actions locales sur une échelle courte. Cette approche décompose les longues tâches en segments plus courts, réduisant ainsi la complexité de la planification et contenant la propagation des erreurs. Les résultats expérimentaux sont significatifs : Dans une tâche de saisie et placement en monde réel, HWM atteint un taux de réussite de 70%, contre 0% pour un modèle monocouche. Il réduit également considérablement le coût computationnel de la planification. Ce progrès s'inscrit dans une convergence plus large avec V-JEPA (représentation du monde) et WAV (vérification et correction des prédictions). L'objectif est de transformer la capacité prédictive en un système exécutable, vérifiable et capable de planification à long terme, une avancée cruciale pour les robots et les agents IA devant gérer des tâches complexes et séquentielles.

marsbitIl y a 20 mins

Les modèles du monde évoluent de la prédiction vers la planification : HWM et le défi du contrôle à long terme

marsbitIl y a 20 mins

Décomposition de la Stratégie de Trading Bitcoin : Prédictions de Célébrités et Modèles Classiques Tous Défaillants, Seuls Ces Quatre Indicateurs Restent

L'auteur, non-traiteur professionnel, a analysé toutes les méthodes de prédiction du prix du Bitcoin (BTC) de 2017 à 2025 et a constaté que les prédictions de célébrités et les modèles classiques (comme Stock-to-Flow) sont devenus inefficaces. Seuls quatre indicateurs se sont révélés fiables pour décrire l'état du marché plutôt que de prédire l'avenir. Les indicateurs retenus sont : 1. **MVRV Z-Score** : Identifie les creux de cycle (zones vertes) avec une grande précision historique, bien que son utilité pour les sommets ait diminué depuis 2024. 2. **SOPR (28-day MA)** : Indique que les détenteurs vendent à perte (valeur < 1.0), un signal stable pour les creux du marché. 3. **Flux nets des ETF Bitcoin** : Un nouvel indicateur crucial depuis 2024 pour suivre le comportement des institutions. 4. **Liquidité macroéconomique** : La politique de la Fed et la croissance de M2 pour déterminer la direction générale du marché. La stratégie consiste à attendre une **résonance** d'au moins trois de ces signaux avant d'agir, évitant ainsi les faux signaux. Un système automatisé surveille ces données et envoie une alerte uniquement lorsque les conditions sont remplies. **Signal actuel (15 avril 2026)** : Une triple résonance des indicateurs on-chain (Peur extrême, MVRV en zone verte, SOPR < 1.0) signale une opportunité d'achat historique, similaire aux creux de 2018, 2020 et 2022. Seul le flux des ETF n'est pas encore favorable. L'essentiel est de se baser sur un cadre objectif plutôt que sur des prédictions. Ceci n'est pas un conseil financier.

marsbitIl y a 2 h

Décomposition de la Stratégie de Trading Bitcoin : Prédictions de Célébrités et Modèles Classiques Tous Défaillants, Seuls Ces Quatre Indicateurs Restent

marsbitIl y a 2 h

Trading

Spot
Futures
活动图片