[Key interpretation] BTC whale seems to have completed the purchase, and the ETH address number indicates an abnormal signal

Huobi ResearchPublié le 2022-08-08Dernière mise à jour le 2022-08-09

Résumé

At the critical moment of BTC, the disc changes upward, and the important pressure level has been given.

1. BTC short line retraction, urgent need to pull up the variable disk once

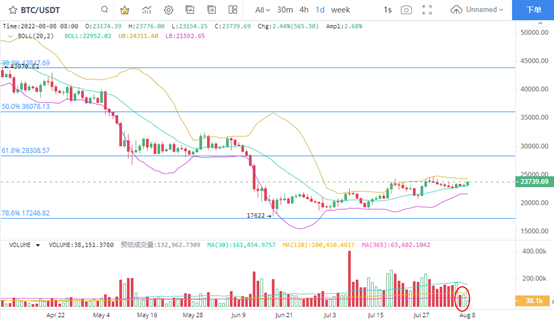
In the daily K-line chart, the BTC short-term contraction for two consecutive trading days indicates that the price can not maintain the current change of hands. If BTC fails to change its position in the short term and the price increase is limited, more selling pressure will suppress the price increase. At present, BTC needs to pull up the market once, so as to undertake the market entry energy of recent investors. In the past month, BTC's spot trading volume has remained at a high level. Meanwhile, more turnover orders have been accumulated in the chain trading volume, which means that BTC has strong shock demand. If the current price trend can be maintained, it is expected that there will be a continuous performance opportunity on the increase.
2. The transaction volume on the chain remained stable

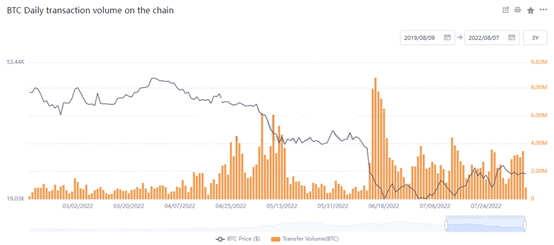
BTC's online trading volume is very strong. The online trading volume in the recent five trading days is very stable, which is the most stable interpretation of the average online trading volume after June 20. That is to say, BTC's online trading volume is very active at present, and investors' transfer frequency is very high, which means that the support for the price is still effective. Judging from the transfer direction, it is relatively difficult to judge the trading intention of investors. However, judging from the activity, BTC can still maintain the current fluctuation rhythm.
3. The number of large value transactions continued to decline

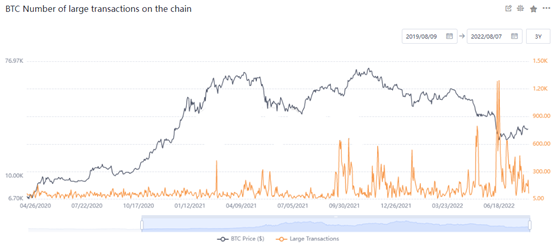
The number of large value transactions of BTC continued to retreat, and the current value has dropped to 64 on August 7, indicating that the price may continue to fluctuate and strengthen in the short term. The decrease in the number of major large transactions means that the dominant power of the giant whale traders to the market is weakened, and BTC is in a stage of having to change its market. Judging from the number of large transactions of BTC, the current number of large transactions is near the low level of the year. Looking back at the performance of large-scale transactions in the past year, it is more likely that the market will continue the current trend after the number of large-scale transactions decreases.

At present, the short-term trend of BTC price is in a rebound state, and there is no change in the medium and long-term callback trend. In terms of rebound pressure level, focus on the selling performance of US $28308 corresponding to 61.8% of Fibonacci.
4. Eth trading volume continues to be depressed

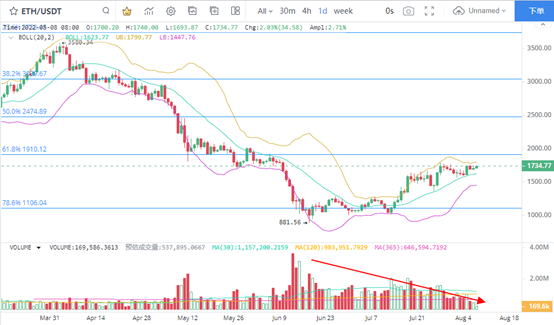
The shrinking trend of the trading volume of eth is relatively clear, and the trading volume has been at the low level in the past three months, indicating that the trading boom caused by the accelerated decline of eth has been cooling down. Based on this judgment, ETH clearly needs to pull up the bulls under the key pressure level of 61.9% Fibonacci corresponding to US $1910, so as to further confirm the strong price. In terms of operation, it is clear that the opportunities for buying eth at a low price are significantly reduced, the market uncertainty is enhanced, and the trading level is aware of risks.
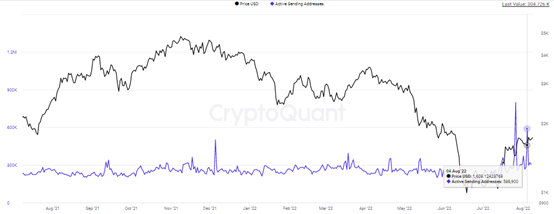
5. The activity of eth sending address is strong

The number of addresses sending eth shows signs of activity. Through judging the activity on July 26 and August 4, the number of active addresses on the two trading days can reach 799000 and 599000 respectively. The number of active addresses corresponding to the same period can reach 934000 and 734000 as a whole.. In other words, the number of active addresses is more than the number of addresses that send eth, and the activity increases sharply. Although the trading intention of sending eth is unknown, more eth addresses may be sold. In terms of trading, we can pay attention to the risk of price pullback in the near future.

Lectures associées

La prospérité du stockage, combien de temps va-t-elle durer ?

Le secteur des semi-conducteurs, en particulier la mémoire, connaît une expansion exceptionnelle depuis 2024. Les expéditions mensuelles de mémoire sont passées d'environ 5,6 milliards de dollars en 2016 à 63,3 milliards en mai 2026, soit une multiplication par plus de 11 en dix ans. Le taux de croissance annuel atteint désormais 285%, un sommet historique. Cette explosion est principalement tirée par les mémoires DRAM et NAND, dont les prix ont été multipliés par environ 10 depuis début 2025. La cause fondamentale est un investissement massif des hyperscalers (Amazon, Google, Microsoft, Meta) dans les centres de données IA, créant une demande largement supérieure à l'offre. Les fabricants priorisent la production de mémoires haut de gamme (HBM) pour l'IA, entraînant une pénurie et une flambée des prix pour les mémoires destinées aux produits grand public (PC, smartphones). Les prévisions du marché mondial des semi-conducteurs, qui tablait sur 1 200 milliards de dollars d'ici 2032, ont été largement dépassées, avec une attente de plus de 1 500 milliards dès 2026. Cette croissance est fortement déséquilibrée, portée quasi exclusivement par la mémoire et les circuits logiques (incluant les GPU) liés à l'IA. Cependant, l'histoire du marché de la mémoire montre que les périodes de croissance positive n'ont jamais excédé cinq années consécutives. Selon ce cycle, la prospérité actuelle, qui a démarré en 2023, pourrait atteindre son pic vers 2027-2028 avant un retournement. Un principe immuable de ce secteur est que plus le pic est haut, plus la chute qui suit est sévère. La croissance actuelle, sans précédent, laisse donc présager une future récession potentiellement très profonde. Les fabricants et investisseurs, dont les actions et profits atteignent des sommets, sont invités à se préparer dès maintenant à ce prochain ralentissement.

链捕手Il y a 2 h

La prospérité du stockage, combien de temps va-t-elle durer ?

链捕手Il y a 2 h

L'Ethereum chute à 1 700 $ – Une poussée de 153 millions $ des baleines permettra-t-elle à l'ETH de rebondir ?

Après avoir échoué à maintenir le seuil des 1 800 $, Ethereum (ETH) évolue autour de 1 700 $, affichant une légère hausse quotidienne de 0,68% pour atteindre 1 748 $. Cette période de consolidation du marché a suscité une accumulation agressive de la part des baleines, qui ont retiré des plateformes d'échange un total de 87 083 ETH, d'une valeur de 153,8 millions de dollars, pour les transférer vers des portefeuilles privés ou les staker. Cette activité a contribué à réduire l'offre disponible sur les exchanges, le taux d'approvisionnement sur les plateformes (Exchange Supply Ratio) retombant à son niveau de 2016, ce qui historiquement précède des mouvements de prix à la hausse. Cependant, cette forte demande institutionnelle ne s'est pas encore traduite par une reprise significative du cours. Les indicateurs techniques, comme l'Indice de Momentum Stochastique (SMI), signalent une faiblesse persistante avec un croisement baissier. La tendance actuelle laisse entrevoir un risque de correction vers les 1 710 $, le support critique se situant à 1 681 $. Pour qu'une reprise haussière s'amorce, Ethereum devra franchir et consolider la résistance clé à 1 847 $, qui pourrait alors dynamiser son élan ascendant. En résumé, malgré une accumulation massive par les baleines, la structure du marché de l'ETH reste fragile et le risque d'une nouvelle baisse persiste avant une éventuelle reprise.

ambcryptoIl y a 3 h

L'Ethereum chute à 1 700 $ – Une poussée de 153 millions $ des baleines permettra-t-elle à l'ETH de rebondir ?

ambcryptoIl y a 3 h

Trading

Spot
活动图片