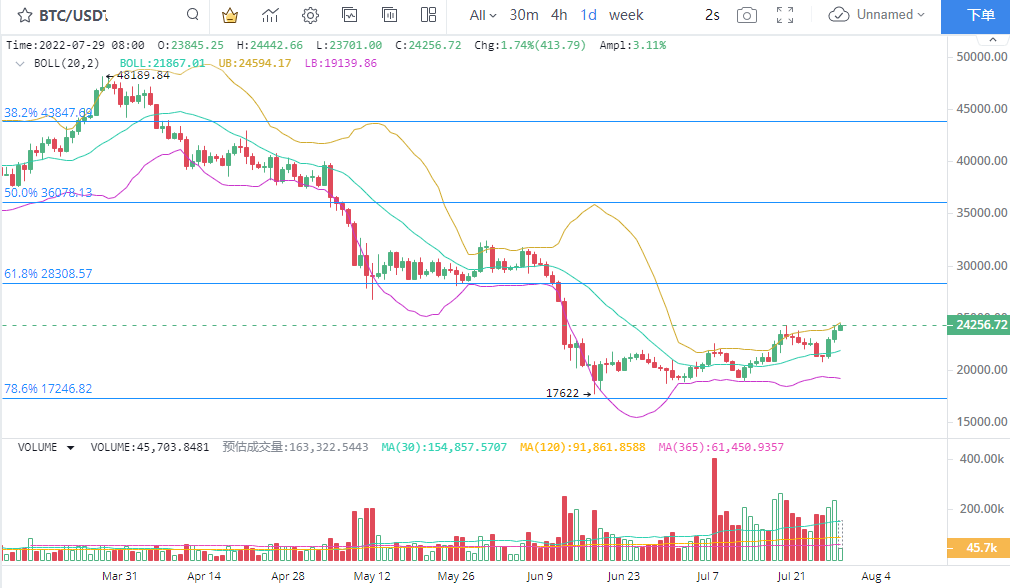
1. BTC triple positive rebound
Trading volume remained high, pushing BTC higher for three consecutive trading days. From the perspective of trading volume performance, the current volume can still support the strong performance of BTC, and the short-term rebound space needs to pay attention to the performance of pressure level. The important price platform is around us $28308, which is the corresponding point of 61.8% in Fibonacci. Considering the increase of BTC activity, there is room for further upward movement in the short term in terms of amplitude. Next, we can pay attention to the performance of volume and price. In the case of large-scale operation, the risk of holding currency is low.
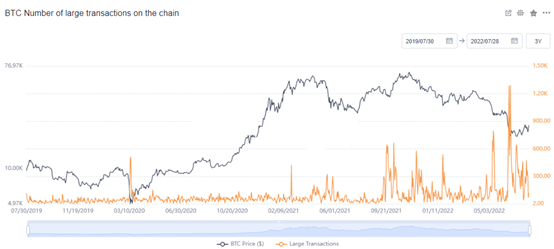
2. Large amount transactions are active on the BTC chain
Large transactions on the chain cannot directly prompt the trading direction of the main force, but the high number of transfers on the chain means that the main force has changed hands relatively fully. Based on the fact that the trading volume of BTC in the exchange also maintained a relatively high level, it is judged that BTC is in a relatively active stage. During the month, large value transactions on the BTC chain were particularly frequent, and the peak value was high, which means that there is a possibility of a large number of successful BTC turnover in the near future. Therefore, the current price rebound of BTC may be caused by the new main force. Next, the market development may still be limited to the range, focusing on selling pressure below the pressure level of $28000.
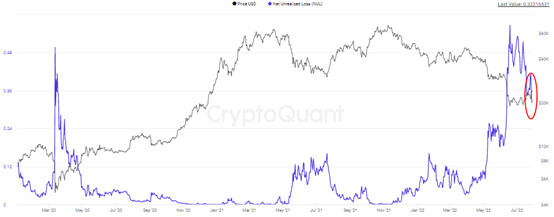
3. Decrease in unrecognized losses of BTC
The number of unrecognized losses of BTC has decreased significantly and at a faster rate, which is relatively consistent with the rebound rhythm of BTC. On June 28, the nul index fell to around 0.322, indicating a decline from the year's high of 0.566. Under normal circumstances, the proportion of unrecognized losses of BTC will be less than 0.12. Before the unconfirmed loss drops to 0.12, the existence of loss will always affect the expectation of price rebound. Importantly, BTC kept approaching the cost price of more investors in the rebound stage, which was one of the sources of selling pressure.
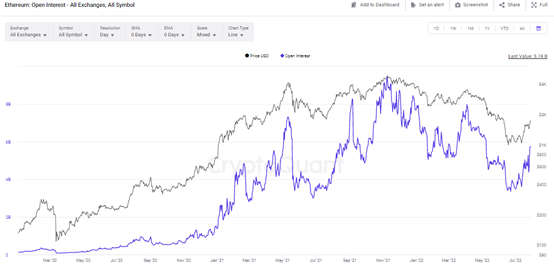
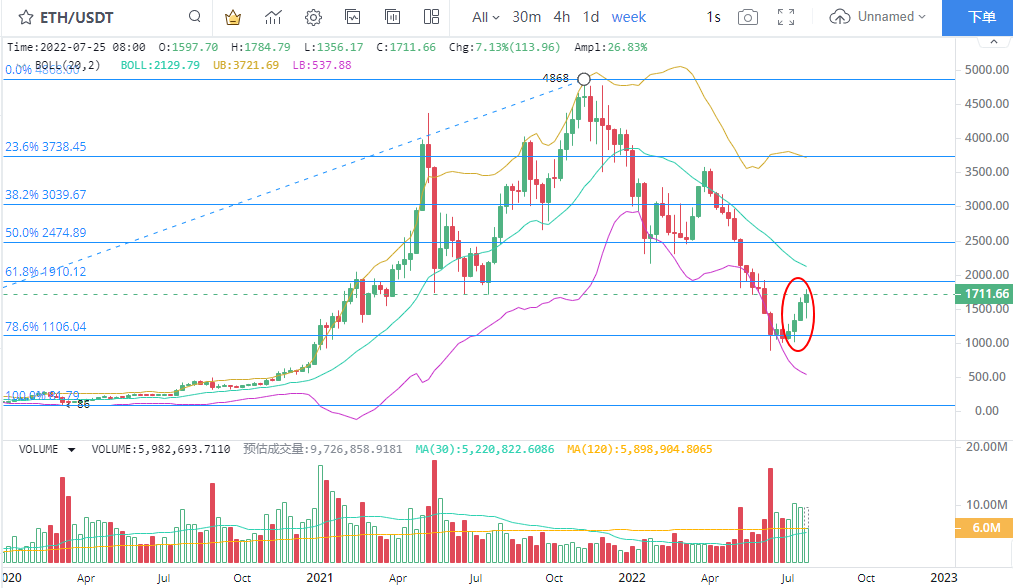
4. Eth reconfirmed the rebound expectation
The technical rebound of eth has turned into a weekly range fluctuation, the maximum increase in price has doubled, and is about to hit the pressure level of $1910. In terms of weekly K-line, ETH accumulated a large trading volume, which made this price increase easily exceed expectations. Recently, the number of eth active addresses has rebounded, and the address activity of sending eth is very high. Therefore, ETH is still a technical rebound. Therefore, we should pay attention to price adjustment factors while making profits by holding money.
5. Eth positions rebounded
Eth rebounded faster. Compared with the price trend, its contract position has more room for rapid growth. At present, the contract sprint has rebounded to near the one-year average. This shows that investors are relatively sensitive to market changes. The rapid growth rate of contract positions makes it easy for eth to prompt bullish trading signals.