BTC Medium-Term Trend Weakens, Short-Term Volatility Fails to Mask Directional Risks | Guest Analysis

marsbitPublié le 2025-12-22Dernière mise à jour le 2025-12-22

Résumé

This analysis by Odaily's guest analyst Conaldo examines Bitcoin's (BTC) current market stance, highlighting a weakening medium-term trend and short-term consolidation with directional risks. The core view is that BTC is in a corrective phase after breaking its long-term bullish trend line (since late 2022) and is now constrained by both this and a descending trend line from the October 2025 high. Until a significant volume-backed breakout occurs above these key levels, any price rises should be considered rebounds within a bearish structure. Last week's prediction of a shift to a consolidation pattern was accurate, with price oscillating in the $87.5K–$89K zone. The analyst successfully executed four short-term trades based on a quant model, yielding a 2.14% return. Technical analysis using weekly and daily charts (incorporating momentum and sentiment quant models) indicates BTC remains in a bearish market on both timeframes, with weak buying momentum and neutral sentiment, suggesting continued consolidation and downside risk. For the upcoming week (Dec 22–28), the market is expected to see wide-range fluctuations. The key area to watch is $89.5K–$91K. A breakdown could lead to deeper correction, while holding could allow for a limited rebound. Specific short-term trading plans (A and B) are outlined for both scenarios, involving 30% short positions with precise entry, stop-loss, and take-profit levels. Key macro events this week include reduced holiday liquidity, potent...

Odaily Guest Market Analyst Conaldo, Master of Financial Statistics from Columbia University, USA, focused on quantitative trading of US stocks during university and gradually expanded to digital assets such as Bitcoin, building a systematic quantitative trading model and risk control system through practical experience; possesses keen data insight into market fluctuations and is committed to continuous development in the professional trading field, pursuing stable returns; will delve into BTC technical, macro, and capital changes weekly, review and demonstrate practical strategies, and preview major upcoming events for reference.

Core Summary:

• From a macro technical perspective (see Figure 3 below): In the Bitcoin daily chart, the upward trend line representing the long-term bull market (since the end of 2022) and the downward trend line defining the recent correction (since the October 2025 high) are about to converge. The market is currently in a period of repair and volatility after breaking the long-term trend. Bitcoin's price is under dual pressure. Unless the price breaks through this dual pressure with strong volume, all upward movements can only be considered rebounds within a bearish pattern. The effective breakthrough of these two key trend lines will serve as the ultimate basis for judging the market's medium-term direction.

• Core View Validation: The core judgment proposed last week that "the market will most likely transition into a volatile adjustment pattern" was highly consistent with the actual market movement. The bulls and bears repeatedly contested the $87,500~$89,000 area, and the mid-week adjustment low of $84,456 had a relative error rate of about 1.18% compared to the predicted support area upper limit of $83,500.

• Strategy Execution Results Validation: Last week's trading strictly followed the established strategy, successfully completing four operations, achieving a cumulative return of 2.14%.

The following will review the market prediction, strategy execution, and specific trading process in detail.

I. Bitcoin Market Review Last Week (12.15~12.21)

1. Last Week's Trend Prediction and Operation Strategy Review:

Last week's forward-looking analysis clearly stated: The market will most likely transition into a volatile adjustment pattern. Among them, the $87,500~$89,000 area was defined as the key observation area. The outcome of the battle between bulls and bears here would directly determine the market's short-term direction choice. Special attention was needed: if this area was effectively broken below, it would directly affect the subsequent intensity and depth of the coin price adjustment. Below is the strategy review and analysis.

1. Market Trend Prediction Review:

• Core Pressure Level: First pressure looking at the $92,500~$94,500 area; second pressure looking at the $96,500~$98,500 area.

• Core Support Level: First support looking at the $87,500~$89,000 area; second support looking at the $80,000~$83,500 area.

2. Operation Strategy Review:

• Medium-term Strategy: Maintain a medium-term position (short) of about 65%.

• Short-term Strategy: To cope with the market trend, we initially drafted two short-term operation plans, A/B. Based on the actual evolution of the market, we ultimately executed Plan B as the core strategy.

• Opening Position: If the coin price falls below the $87,500~$89,000 area and is confirmed, establish a 30% short position.

• Risk Control: Stop loss set above $89,000.

• Closing Position: When the coin price falls to the $80,000~$83,500 area and shows resistance, close all short positions to take profits.

2. Last week, four short-term operations were successfully completed according to the plan (Figure 1), achieving a cumulative return of 2.14%. Specific transaction details and review are as follows:

Bitcoin 30-minute K-line chart: (Momentum Quantitative Model + Spread Trading Model)
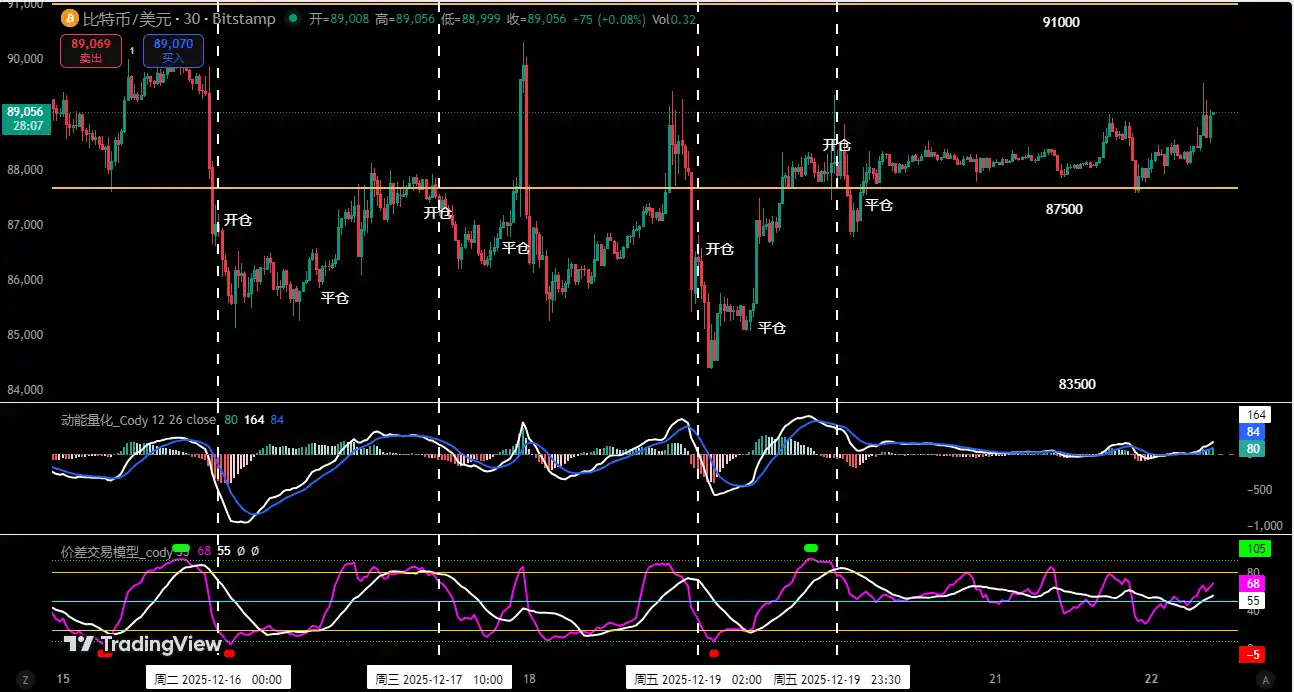
Figure 1

1. Transaction Details Summary:

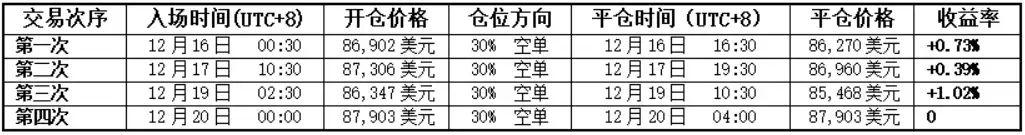
2. Short-term Trading Review:

• First Transaction (Profit 0.73%): We strictly adhered to the idea of "effectively breaking through key points and going short with the trend." When the trigger condition was met, the spread trading model simultaneously issued a top signal. Based on this, we decisively established a 30% short position and finally took profits when the price fell near the previous low area.

• Second and Third Transactions (Cumulative Profit 1.41%): Based on the operation mode of "going short upon encountering resistance at the core pressure area during a rebound." When the coin price hit the $87,500~$89,000 area and encountered resistance, combined with resonance signals from both models, these two transactions were successfully completed.

• Fourth Transaction (Profit 0): The logic for opening the position was consistent with the previous two transactions. It must be emphasized that in this transaction, we strictly executed the principle of "immediately moving the stop loss to the opening cost price when the floating profit reaches 1%", resulting in the position being closed at breakeven.

II. Quantitative Technical Analysis: Based on Multi-Model and Multi-Dimensional Operations

Combining last week's market performance, the author will conduct an in-depth analysis of the evolution of Bitcoin's internal structure using multi-dimensional analysis models.

Bitcoin Weekly K-line Chart: (Momentum Quantitative Model + Sentiment Quantitative Model)
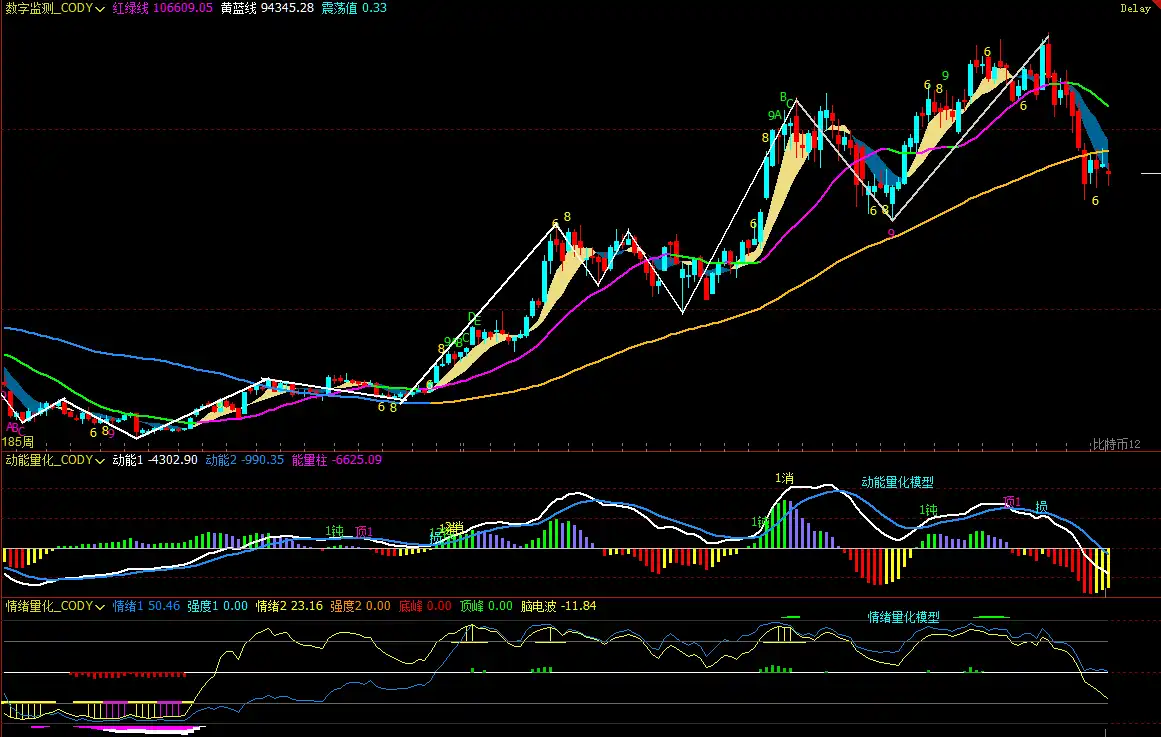
Figure 2

1. As shown in (Figure 2), analysis from the weekly chart:

Momentum Quantitative Model: After last week's adjustment, the two momentum indicator lines continue to operate below the zero axis. Although the rebound in the previous weeks prevented the negative momentum bars from expanding significantly, the current market structure remains weak, and we need to be vigilant about the risk of further release of adjustment pressure.

Momentum Quantitative Model Indicates: Coin price decline index: High

• Sentiment Quantitative Model: Blue sentiment line value 50.46, strength zero; yellow sentiment line value 23.16, strength zero, peak value is 0.

Sentiment Quantitative Model Indicates: Coin price pressure and support index: Neutral

• Digital Monitoring Model: The chart shows that the coin price has been below the bull-bear (yellow-blue line) dividing line for 5 weeks, increasing the probability of an effective break. Short-term bottom digital signals (above 9) have not yet appeared.

The above data indicates: Bitcoin is in a downward trend, entering a bear market on the weekly level, beware of adjustment risks.

Bitcoin Daily K-line Chart:
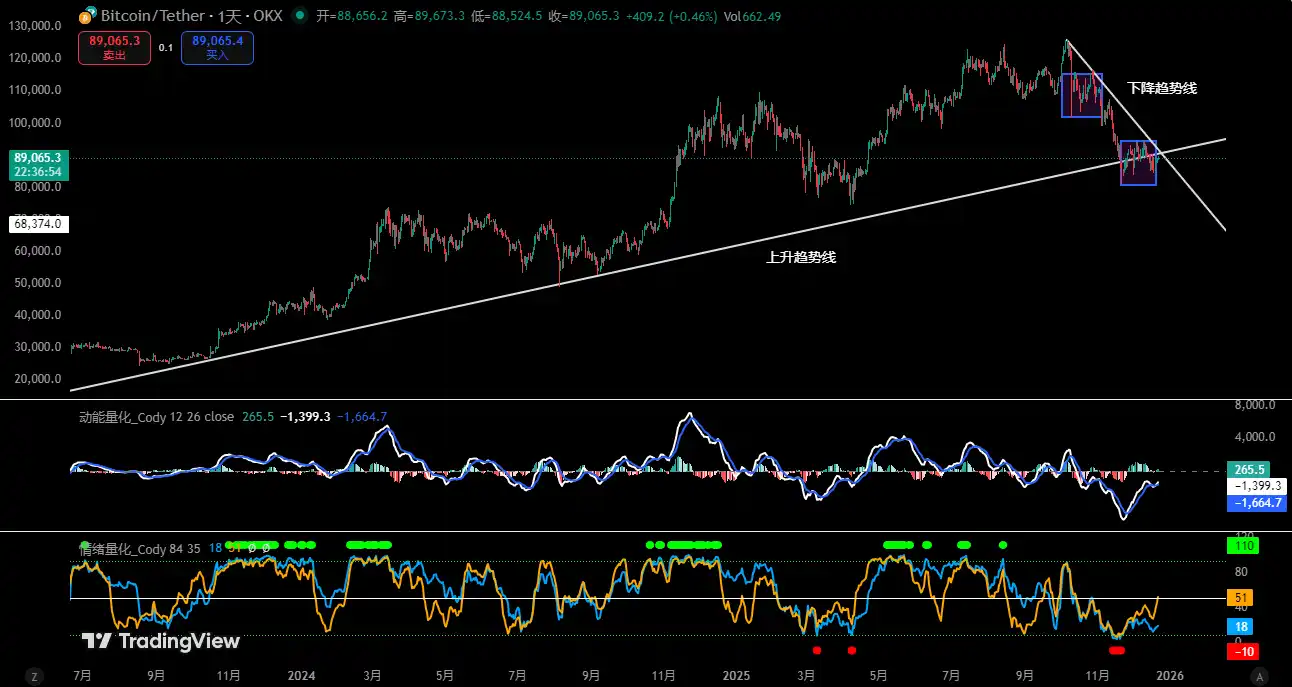
Figure 3

2. As shown in (Figure 3), analysis from the daily chart:

• Momentum Quantitative Model: In last week's行情, the two momentum lines experienced a repeated crossover process of "golden cross—dead cross—golden cross" below the zero axis. Trading volume did not放大, and the positive momentum bars did not grow significantly.

Momentum Quantitative Model Indicates: Fierce battle between bulls and bears for market control, weak buying momentum.

• Sentiment Quantitative Model: After last week's daily close, blue sentiment line value 17, strength zero; yellow sentiment line value 45, strength zero.

Sentiment Quantitative Model Indicates: Pressure and support index: Neutral

The above data suggests: The daily level is in a bear market, short-term market movements will still be反复.

III. This Week's Market Prediction (12.22~12.28)

1. The market is expected to mainly present a wide-range volatile pattern this week. The core observation interval is $89,500~$91,000. The outcome of the battle for this area will determine the short-term direction:

If effectively broken below: It will mean the adjustment intensity strengthens, and the expected adjustment range will expand, and the周期 will also延长.

If effectively held above: The market is expected to continue its volatile rebound, but the rebound space is expected to be relatively limited.

2. Core Pressure Levels:

• First Pressure Area: $89,500~$91,000 area

• Second Pressure Area: $93,000~$94,500 area

• Important Pressure Area: Around $97,000

3. Core Support Levels:

• First Support Level: $86,500~$87,500 area

• Second Support Level: $83,500~$84,500 area

• Important Support Level: Around $80,000.

IV. This Week's Operation Strategy (Excluding Sudden News Impact)(12.22~12.28)

1. Medium-term Strategy: Maintain a medium-term position (short) of about 65%.

2. Short-term Strategy: Use 30% of the position, set stop loss points, and look for "spread" opportunities based on support and pressure levels. (Using 30-minute as the operation cycle).

3. Focus on observing the battle between bulls and bears for the $89,500~$91,000 area and its outcome. To cope with the market行情, we have drafted two short-term operation plans, A/B:

Plan A: If this area is effectively held above:

• Opening Position: If the coin price rebounds to the $93,000~$94,500 area and encounters resistance, establish a 30% short position.

• Risk Control: Short stop loss set above $96,000.

• Closing Position: When the coin price falls to the $89,500~$91,000 area and shows resistance, close all short positions to take profits.

Plan B: If this area is effectively broken below:

• Opening Position: If the coin price falls below this area and is confirmed, establish a 30% short position.

• Risk Control: Stop loss set above $92,000.

• Closing Position: When the coin price falls to the $83,500~$84,500 area and shows resistance, consider partially or fully closing the position to take profits.

V. Special Notes

1. When opening a position: Immediately set the initial stop loss level.

2. When profit reaches 1%: Move the stop loss to the opening cost price (breakeven point) to ensure principal safety.

3. When profit reaches 2%: Move the stop loss to the position of 1% profit.

4. Continuous Tracking: Thereafter, for every additional 1% profit the coin price makes, move the stop loss同步 by 1%, dynamically protecting and locking in existing profits.

(Note: The above 1% profit trigger threshold can be flexibly adjusted by investors according to their own risk preferences and标的 volatility.)

VI. This Week's Macro Outlook and Key Events (12.22~12.28|Christmas Week)

1. Christmas Holiday Compresses Trading Hours, Liquidity Significantly Decreases

US stocks will close early on Wednesday and be closed all day Thursday this week. The holiday factor combined with year-end settlement results in overall lower market liquidity. Prices are more easily driven by sentiment and one-sided funds. Be wary of "false breakouts" and amplified short-term fluctuations under low trading volume.

2. Fed Chair Nomination Expectations Heat Up, Policy Continuity Becomes Market Focus

The market is watching whether Trump will announce the next Fed Chair nominee during the Christmas holiday. Currently, Kevin Hassett is seen as the明显领先 probability nominee, and his policy stance is considered偏向 "predictable gradual adjustment."

(If the nomination is announced, it will help stabilize interest rate expectations and risk appetite in the short term; if an unexpected candidate emerges, it may cause阶段性波动 in interest rates and the US dollar.)

3. US Q3 Data Finale, Verifying the "Soft Landing" Narrative

The revised US Q3 GDP, personal consumption expenditure, and core PCE data released on Tuesday will be used to confirm whether economic resilience and the inflation path are consistent with previous judgments.

(If the revisions are温和, the market will more easily maintain pricing for next year's interest rate cut path; if there are significant upward revisions, it may重新抬升 long-term rates.)

4. Employment Data as a Marginal Observation Indicator at Year-End

The initial jobless claims released on Wednesday, while not having trend significance, remain an auxiliary signal for observing whether the labor market is loosening around the holidays.

(Currently more偏向 "stable rather than deteriorating", the impact on the market is expected to be limited.)

5. BOJ Dynamics Provide Global Liquidity Reference

BOJ Governor Ueda's speech and the November unemployment rate data will continue to affect the market's judgment on the pace of Japan's monetary policy normalization.

(If yen volatility放大, it may cause emotional disturbance to global risk assets, especially US stocks and the crypto market.)

Financial markets are changing rapidly, all market analysis and trading strategies need to be adjusted dynamically. All views, analysis models, and operation strategies involved in this article are derived from personal technical analysis and are for personal trading log purposes only. They do not constitute any investment advice or operational basis. The market has risks, investment needs to be cautious, DYOR.

Cryptos en tendance

Questions liées

QWhat is the core technical perspective on Bitcoin's medium-term trend according to the analyst's daily chart analysis?

AThe analyst states that from a macro technical perspective, Bitcoin is in a period of repair and consolidation after breaking its long-term uptrend. The price is under dual pressure from the long-term bull market trendline (since late 2022) and the recent downtrend line (since the October 2025 high). All upward moves are considered rebounds within a bearish structure until the price breaks through this dual resistance with strong volume, using the effective break of these key trendlines as the final basis for judging the market's medium-term directional choice.

QWhat was the outcome of the trading strategy execution for the previous week (Dec 15-21)?

AThe trading strategy was strictly followed, resulting in four successful short-term operations with a cumulative realized return of 2.14%.

QBased on the weekly chart analysis (Figure 2), what do the momentum and sentiment quantitative models indicate about Bitcoin's market structure?

AThe momentum quantitative model shows both momentum indicator lines continue to run below the zero axis, indicating the market structure is still weak with a high risk of further adjustment pressure release. The sentiment quantitative model shows neutral pressure and support indices, with the blue sentiment line at 50.46 and the yellow at 23.16, both with zero intensity. This data suggests Bitcoin is in a downward trend on the weekly level, having entered a bear market, warranting caution against adjustment risks.

QWhat are the two short-term operation plans (A and B) proposed for the current week (Dec 22-28) and what triggers each?

APlan A is triggered if the price effectively holds above the 89,500-91,000 USD region: open a 30% short position if the price rebounds to the 93,000-94,500 USD region and meets resistance, with a stop-loss above 96,000 USD, and close the position for profit when the price falls to the 89,500-91,000 USD region and finds support. Plan B is triggered if the 89,500-91,000 USD region is effectively broken: open a 30% short position upon confirmation of the break, with a stop-loss above 92,000 USD, and close all or part of the position for profit when the price falls to the 83,500-84,500 USD region and shows resistance.

QWhat are the key macro events and their potential impacts highlighted for the Christmas week (Dec 22-28)?

AKey events include: 1) Reduced trading hours and significantly lower liquidity due to the Christmas holiday, increasing the potential for 'false breakouts' and amplified short-term volatility. 2) Increased expectations for the Fed Chair nomination, where the appointment of Kevin Hassett could stabilize rate expectations, while an unexpected pick might cause volatility. 3) The release of final US Q3 GDP, PCE, and core PCE data to confirm the 'soft landing' narrative; significant upward revisions could push long-term rates higher. 4) Jobless claims data as a marginal indicator, expected to have limited impact. 5) BOJ dynamics providing global liquidity cues, where amplified Yen volatility could cause sentiment disturbances in risk assets like crypto.

Lectures associées

Démystification des baleines du marché des prédictions de la Coupe du Monde : l'argent intelligent perd sur la pelouse, 'acheter non' surpasse 'acheter oui'

L’analyse des transactions importantes sur Polymarket lors de 20 matchs de la Coupe du Monde 2026 révèle que l'argent "intelligent" n'est pas infaillible. Les gros paris (montants > 5 000 $) avant match, totalisant 89,5 millions de dollars, n'ont affiché qu'un taux de réussite pondéré de 48,5%. Globalement, ces positions ont enregistré une perte estimée de -2%. Le principal risque pour les paris sur les favoris a été le match nul (8 sur 20 matchs), comme l'ont montré Belgique-Égypte, Pays-Bas-Japon et Espagne-Cap-Vert. Les marchés sont plus efficaces lorsque l'écart de niveau est flagrant (ex. : Allemagne). Fait marquant, acheter les parts "NON" (par exemple, "l'équipe favorite ne gagnera pas") a largement surperformé les parts "OUI", avec un taux de réussite de 62,4% contre 37,5%. Cette stratégie, qui profite d'une surévaluation des favoris, a généré des gains substantiels, comme les 6,77 millions de dollars de profit de *mintblade* sur Iran-Nouvelle-Zélande. Cependant, d'autres portefeuilles ont subi des pertes massives sur un seul match, illustrant la volatilité extrême de ces marchés de prédiction. L'étude souligne que ces plateformes reflètent moins une prédiction exacte que les biais collectifs et l'émotion du marché. La vraie valeur réside dans l'identification des écarts de prix, rappelant qu'aucun capital, aussi "intelligent" soit-il, n'est à l'abri de l'incertitude sportive.

marsbitIl y a 10 mins

Démystification des baleines du marché des prédictions de la Coupe du Monde : l'argent intelligent perd sur la pelouse, 'acheter non' surpasse 'acheter oui'

marsbitIl y a 10 mins

La troisième start-up de Bezos ne parvient toujours pas à échapper à Musk

Après sept mois de retours en tant que PDG et fondateur de la startup d'IA Prometheus, Jeff Bezos évoque son retour à la tête d'une entreprise, un rôle qu'il ne pensait plus endosser depuis son départ d'Amazon en 2021. Prometheus, dont le nom évoque le titan qui offrit le feu aux humains, vise à développer une IA "ingénieur généraliste" capable de participer à la conception, simulation, test et fabrication de produits physiques complexes, comme des moteurs à réaction ou des dispositifs médicaux. Fondée il y a moins d'un an et forte d'environ 150 employés, la société a atteint une valorisation stupéfiante de 41 milliards de dollars après un tour de financement de 12 milliards. Bezos la considère comme sa troisième grande aventure entrepreneuriale, synthétisant les leçons de plateforme d'Amazon et les défis d'ingénierie physique de Blue Origin. Le lancement survient dans un contexte où son rival de longue date, Elon Musk, domine le secteur spatial avec SpaceX — dont l'introduction en bourse historique a propulsé la valorisation au-delà de celle d'Amazon — et pousse également l'IA dans le monde physique via Tesla et xAI. Alors que Blue Origin a récemment subi un revers avec l'explosion d'un test de sa fusée New Glenn, Bezos semble chercher un nouvel avantage compétitif dans la "mer bleue" de l'IA industrielle, un domaine encore ouvert où Prometheus ambitionne de devenir la plateforme de référence pour l'ingénierie à l'ère de l'intelligence artificielle.

marsbitIl y a 14 mins

La troisième start-up de Bezos ne parvient toujours pas à échapper à Musk

marsbitIl y a 14 mins

Cursor abandonne le socle Kimi pour son nouveau modèle 1,5T, échange d’actions à 60 milliards de dollars contre Cursor, le premier coup de couteau de Musk vise Microsoft GitHub

Aujourd'hui, lors de la conférence Compile, Cursor a annoncé le développement d'un nouveau modèle de plus de 1,5T de paramètres. Contrairement à ses précédentes versions qui s'appuyaient sur des modèles existants comme Kimi, ce nouveau modèle sera pré-entraîné à partir de zéro sur un énorme parc de plus de 100 000 GPU. Cette capacité de calcul massive, 10 à 20 fois supérieure à avant, est rendue possible grâce au récent accord d'acquisition par SpaceX. La transaction, prévue pour le troisième trimestre 2026, valoriserait Cursor à 60 milliards de dollars en actions SpaceX. Cursor présente ce modèle comme étant de la même ampleur que les modèles de niveau AGI d'OpenAI, et souligne qu'il ne sera pas seulement performant en écriture de code, mais aussi en compréhension et exécution de tâches plus générales (planification, test, utilisation d'outils), visant à devenir un assistant IA "utile" pour tous. Parallèlement, Cursor a dévoilé Origin, une plateforme de gestion de code Git conçue spécifiquement pour l'ère des agents IA. Origin vise à répondre aux limites des plateformes comme GitHub, conçues pour des développeurs humains, en permettant à des milliers d'agents IA de cloner, de fusionner et de soumettre du code simultanément, avec des fonctionnalités comme la résolution automatique des conflits de fusion. Ces annonces marquent une nouvelle étape stratégique pour Cursor, qui, avec le soutien financier et technique de SpaceX, ambitionne de dépasser son rôle d'éditeur de code assisté par IA pour construire un écosystème complet de "fabrique de logiciels" pilotée par l'intelligence artificielle, en concurrence directe avec des acteurs majeurs comme GitHub (Microsoft), Claude Code (Anthropic) ou Codex (OpenAI).

marsbitIl y a 16 mins

Cursor abandonne le socle Kimi pour son nouveau modèle 1,5T, échange d’actions à 60 milliards de dollars contre Cursor, le premier coup de couteau de Musk vise Microsoft GitHub

marsbitIl y a 16 mins

Le marché boursier américain ne baissera plus jamais ? Le piège de la « Grande Fusion-ascension » à l’ère de la dette élevée

L'article discute d'une théorie populaire sur Reddit selon laquelle, dans un contexte de dette américaine massive (40 billions de dollars) et de déficits persistants, le marché boursier serait entré dans une phase de « Grande Fusion » (« Melt-up »), où les actions ne pourraient mathématiquement plus baisser. L'argument avancé est que le gouvernement, pour gérer sa dette, serait contraint à créer de la monnaie, entraînant une inflation qui propulserait mécaniquement les prix des actifs comme les actions. L'auteur nuance fortement cette idée en la replaçant dans l'histoire des bulles spéculatives (bulle internet, Japon). Il souligne qu'un marché cher (ratio CAPE proche des records) et une hausse alimentée par le momentum et la crainte de rater le mouvement (FOMO) ne garantissent pas une absence de corrections violentes (30%, 40% ou plus), comme l'ont montré des exemples d'hyperinflation (Allemagne, Zimbabwe). La conclusion principale est que le scénario le plus probable n'est ni un défaut, ni une hyperinflation, mais une longue période de « répression financière » : une inflation modérée mais persistante qui grègera le pouvoir d'achat de la monnaie et diluera lentement la dette. Dans ce contexte, les prix nominaux des actifs pourraient continuer à augmenter à long terme, mais les rendements réels (ajustés de l'inflation) seront probablement plus faibles. L'auteur met en garde contre le risque de tout miser sur un récit de hausse perpétuelle. Il recommande la diversification (actions, immobilier, un peu d'or, obligations court terme), le maintien d'une réserve de liquidités pour éviter les ventes forcées lors des crises, et de s'en tenir à un plan d'investissement discipliné plutôt que de succomber à la tentation de tout parier sur les actifs les plus chers et les plus risqués.

marsbitIl y a 33 mins

Le marché boursier américain ne baissera plus jamais ? Le piège de la « Grande Fusion-ascension » à l’ère de la dette élevée

marsbitIl y a 33 mins

Le destin des banques numériques : une application fantaisiste ne vaut pas une licence bancaire

Le destin des néobanques : peu importe la sophistication de leur application, sans licence bancaire, elles peinent à survivre. Alors que des centaines de start-ups ont lancé des services de comptes courants, attirant des milliards d'utilisateurs avec des frais nuls, 76 % d'entre elles restent déficitaires. Leur revenu moyen par utilisateur n'est que de 45 dollars, contre 350 dollars pour les banques traditionnelles. Le problème fondamental réside dans leur modèle économique initial, centré sur les paiements, qui génère des commissions minimes. La vraie rentabilité bancaire provient du crédit (prêts immobiliers, personnels, etc.) et des intérêts perçus. Sans licence bancaire, la plupart des néobanques ne peuvent pas accorder de prêts à grande échelle et restent des plateformes technologiques dépendantes d'une banque partenaire. Les rares exceptions qui prospèrent, comme Nubank au Brésil ou Revolut, le doivent principalement à leur activité de crédit en forte croissance. Nubank, valorisé 600 milliards de dollars, génère l'essentiel de ses revenus des intérêts sur les cartes de crédit et prêts personnels. De même, Chime n'a réalisé son premier profit qu'après le décollage de ses produits de prêt. La dépendance à des infrastructures tierces pose un risque systémique majeur, illustré par la faillite du prestataire Synapse en 2024, qui a gelé 265 millions de dollars de fonds utilisateurs. La seule protection contre de tels risques est la détention d'une licence bancaire propre. Le secteur de la cryptographie a compris cette leçon. De nombreuses entreprises (Paxos, Circle, etc.) demandent désormais des agréments fédéraux, comme la licence de fiducie nationale de l'OCC, pour opérer en toute autonomie. SoFi illustre cette évolution : après être devenue une banque agréée, elle a lancé sa propre monnaie stable. En définitive, pour réussir durablement, les néobanques doivent adopter le cœur de métier bancaire traditionnel : le crédit. Les applications et l'expérience utilisateur ne sont que des outils d'acquisition. Sans licence pour prêter à grande échelle, leur modèle reste fragile. L'essence du secteur bancaire, gagner de l'argent grâce aux intérêts, demeure immuable.

Foresight NewsIl y a 41 mins

Le destin des banques numériques : une application fantaisiste ne vaut pas une licence bancaire

Foresight NewsIl y a 41 mins

Trading

Spot
Futures

Articles tendance

Comment acheter MASK

Bienvenue sur HTX.com ! Nous vous permettons d'acheter Mask Network (MASK) de manière simple et pratique. Suivez notre guide étape par étape pour commencer votre parcours crypto.Étape 1 : Création de votre compte HTXUtilisez votre adresse e-mail ou votre numéro de téléphone pour ouvrir un compte sur HTX gratuitement. L'inscription se fait en toute simplicité et débloque toutes les fonctionnalités.Créer mon compteÉtape 2 : Choix du mode de paiement (rubrique Acheter des cryptosCarte de crédit/débit : utilisez votre carte Visa ou Mastercard pour acheter instantanément Mask Network (MASK).Solde :utilisez les fonds du solde de votre compte HTX pour trader en toute simplicité.Prestataire tiers :pour accroître la commodité d'utilisation, nous avons ajouté des modes de paiement populaires tels que Google Pay et Apple Pay.P2P :tradez directement avec d'autres utilisateurs sur HTX.OTC (de gré à gré) : nous offrons des services personnalisés et des taux de change compétitifs aux traders.Étape 3 : stockage de vos Mask Network (MASK)Après avoir acheté vos Mask Network (MASK), stockez-les sur votre compte HTX. Vous pouvez également les envoyer ailleurs via un transfert sur la blockchain ou les utiliser pour trader d'autres cryptos.Étape 4 : tradez des Mask Network (MASK)Tradez facilement Mask Network (MASK) sur le marché Spot de HTX. Il vous suffit d'accéder à votre compte, de sélectionner la paire de trading, d'exécuter vos trades et de les suivre en temps réel. Nous offrons une expérience conviviale aux débutants comme aux traders chevronnés.

274 vues totalesPublié le 2024.12.12Mis à jour le 2026.06.02

Comment acheter MASK

Discussions

Bienvenue dans la Communauté HTX. Ici, vous pouvez vous tenir informé(e) des derniers développements de la plateforme et accéder à des analyses de marché professionnelles. Les opinions des utilisateurs sur le prix de MASK (MASK) sont présentées ci-dessous.

活动图片