Is Bitcoin Bull Run Nearing Its End? LTH Conviction Is Strong But STH Pressure Builds

bitcoinistPublié le 2025-08-04Dernière mise à jour le 2025-08-05

Résumé

Bitcoin has entered a critical consolidation phase after reaching its $123,000 all-time high, sparking a wave of caution among investors....

Trusted Editorial content, reviewed by leading industry experts and seasoned editors. Ad Disclosure

Bitcoin has entered a critical consolidation phase after reaching its $123,000 all-time high, sparking a wave of caution among investors. Since the peak, price action has cooled down, with BTC now trading below key resistance levels. This slowdown has led some analysts to speculate that $123K could represent the market top for this cycle, increasing fears of a potential bearish reversal.

However, data from CryptoQuant offers a more balanced perspective. Metrics reveal that long-term holders (LTH) remain steadfast, showing strong conviction in Bitcoin’s upward trajectory. These investors continue to hold significant unrealized profits without signs of mass distribution, which supports the argument that the macro trend remains bullish.

Conversely, short-term holders (STH) are showing signs of weakness, with profit margins shrinking during recent rallies. This divergence between LTH confidence and STH selling pressure has created short-term volatility, but the broader supply dynamics remain healthy.

Long-Term Holders Support Bullish Structure Amid Short-Term Selling Pressure

CryptoQuant analyst AbramChart highlights that Long-Term Holders (LTH) continue to anchor Bitcoin’s bullish narrative, with the Net Unrealized Profit/Loss (NUPL) metric remaining solidly above 0.5. This indicates that LTH are still in significant profit territory and show no signs of capitulation. Their strong conviction and willingness to hold are providing a solid foundation for Bitcoin’s price, even as market sentiment shows signs of cooling after the recent rally to $123K.

Bitcoin Net Unrealized PnL by Cohort | Source: CryptoQuant

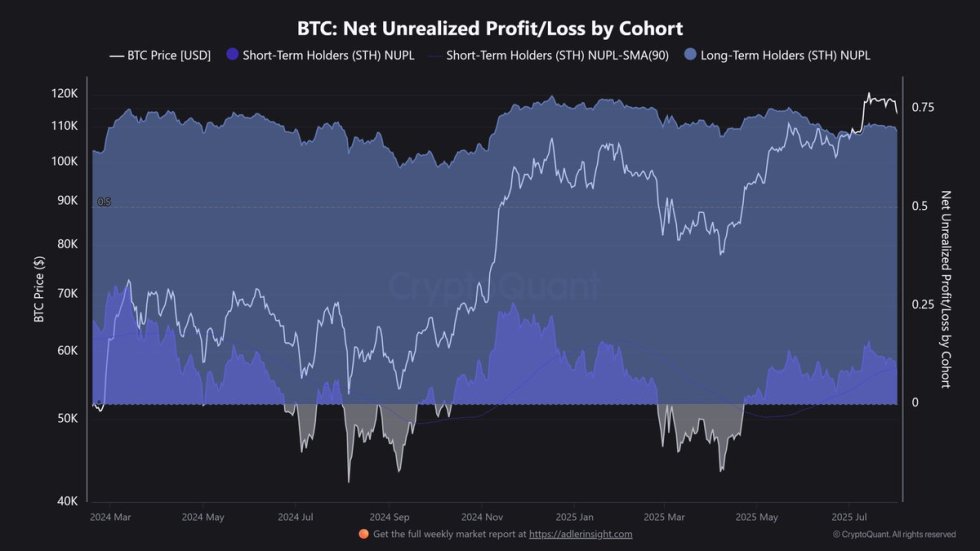
In contrast, Short-Term Holders (STH) are operating under different conditions. Their NUPL levels are fluctuating near lower profit margins, suggesting that many are either realizing gains during brief rallies or are feeling pressure from holding underwater positions. This behavior is creating short-term corrective waves in Bitcoin’s price action, contributing to the recent volatility.

Currently, Bitcoin is trading close to the $104K zone, a level that appears to be supported mainly by LTH confidence. The absence of mass selling from these long-term holders reflects their belief in Bitcoin’s continued upward trajectory, despite temporary market pullbacks.

AbramChart emphasizes that unless LTH begin to distribute their holdings aggressively, the macro uptrend remains intact. Therefore, current price action is likely a phase of consolidation within a larger bullish cycle, where STH-driven volatility offers strategic accumulation opportunities for long-term participants.

Price Action Details: Testing Key Resistance

Bitcoin (BTC) is currently trading at $114,316, following a sharp pullback from the local highs at $122,077. The chart shows that BTC is now retesting the $115,724 resistance zone, which was previously a key support level during the two-week consolidation range. The 100-period moving average (green line) around $115,326 is adding additional pressure, creating a confluence resistance level that bulls need to overcome for further upside momentum.

BTC testing key resistance | Source: BTCUSDT chart on TradingView

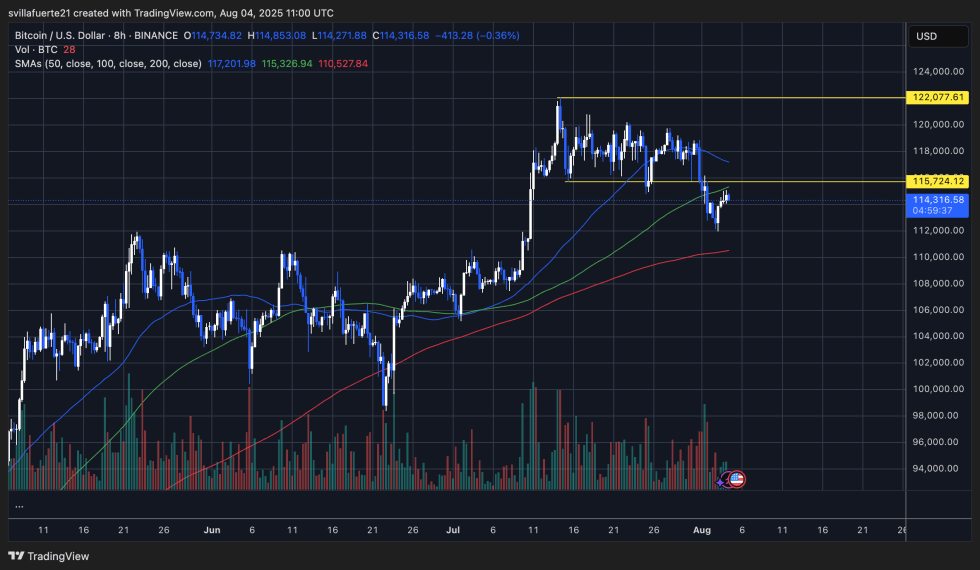
Volume has picked up during the recent bounce, indicating that buyers are attempting to defend the $112K zone. However, BTC is still trading below the 50-period moving average (blue line) at $117,201, suggesting that short-term trend momentum remains bearish unless BTC can reclaim this level.

The overall structure suggests a relief rally within a corrective phase. Bulls need a decisive close above $115,724 to shift the short-term bias back to bullish and aim for a retest of the $122,077 highs. Failure to break above resistance could result in continued range-bound price action, with support at $112,000 being the immediate level to watch.

Featured image from Dall-E, chart from TradingView

Editorial Process for bitcoinist is centered on delivering thoroughly researched, accurate, and unbiased content. We uphold strict sourcing standards, and each page undergoes diligent review by our team of top technology experts and seasoned editors. This process ensures the integrity, relevance, and value of our content for our readers.

Sebastian's journey into the world of crypto began four years ago, driven by a fascination with the potential of blockchain technology to revolutionize financial systems. His initial exploration focused on understanding the intricacies of various crypto projects, particularly those focused on building innovative financial solutions. Through countless hours of research and learning, Sebastian developed a deep understanding of the underlying technologies, market dynamics, and potential applications of cryptocurrencies. As his knowledge grew, Sebastian felt compelled to share his insights with others. He began actively contributing to online discussions on platforms like X and LinkedIn, focusing on fintech and crypto-related content. His goal was to expose valuable trends and insights to a wider audience, fostering a deeper understanding of the rapidly evolving crypto landscape. Sebastian's contributions quickly gained recognition, and he became a trusted voice in the online crypto community. To further enhance his expertise, Sebastian pursued a UC Berkeley Fintech: Frameworks, Applications, and Strategies certification. This rigorous program equipped him with valuable skills and knowledge regarding Financial Technology, bridging the gap between traditional finance (TradFi) and decentralized finance (DeFi). The certification deepened his understanding of the broader financial landscape and its intersection with blockchain technology. Sebastian's passion for finance and writing is evident in his work. He enjoys delving into financial research, analyzing market trends, and exploring the latest developments in the crypto space. In his spare time, Sebastian can often be found immersed in charts, studying 10-K forms, or engaging in thought-provoking discussions about the future of finance. Sebastian's journey as a crypto analyst and investor has been marked by a relentless pursuit of knowledge and a dedication to sharing his insights. His ability to navigate the complex world of crypto, combined with his passion for financial research and communication, makes him a valuable asset to the industry. As the crypto landscape continues to evolve, Sebastian remains at the forefront, providing valuable insights and contributing to the growth of this revolutionary technology.

Lectures associées

À quelle distance sommes-nous de la fin du marché baissier des cryptos ?

Selon les données de Coinglass, l'indice de prime Bitcoin de Coinbase est resté négatif pendant 46 jours consécutifs, établissant un record. La vente de Bitcoin par MicroStrategy début juin a déclenché une forte baisse du marché, confirmant symboliquement le début d'un marché baissier. Le BTC a enregistré sa pire semaine depuis 2022, tombant en dessous de la moyenne mobile sur 200 semaines, un signal clé de marché baissier. Malgré des prédictions antérieures sur une fin proche du marché baissier, la chute continue du BTC et de l'ETH a contredit ces optimistes. Le désancrage de l'action privilégiée STRC de MicroStrategy et l'augmentation des pertes pour les détenteurs à long terme de BTC et d'ETH sont devenus des indicateurs clés de la persistance du marché baissier. Concernant la fin de ce cycle, certaines analyses suggèrent que les mois de juillet à août pourraient présenter une opportunité d'achat, tandis que d'autres prévoient un point bas entre octobre et décembre, avec un BTC entre 42 000 et 44 000 dollars. Des indicateurs techniques comme le prix moyen sur 4 ans du BTC et la carte thermique de la moyenne mobile sur 200 semaines suggèrent également une phase de consolidation. En l'absence de catalyseurs externes forts, ce marché baissier pourrait se prolonger encore 2 à 3 mois, avec une période charnière pour un éventuel rebond entre fin septembre et début octobre.

marsbitIl y a 9 mins

À quelle distance sommes-nous de la fin du marché baissier des cryptos ?

marsbitIl y a 9 mins

Combien de temps nous reste-t-il avant la fin du marché baissier des cryptos ?

L'indice de prime Bitcoin de Coinbase est resté négatif pendant 46 jours consécutifs, un record, signalant une pression de vente continue. Le marché baissier a été confirmé début juin après que MicroStrategy a vendu des Bitcoin, entraînant une chute des prix du BTC sous les 60 000 $ et une rupture du support clé de la moyenne mobile sur 200 semaines. Malgré des prédictions antérieures d'un potentiel fond autour de 53 600 $ ou d'une fin de marché baissier pendant la Coupe du Monde 2026, la baisse s'est poursuivie. Les indicateurs reflètent la pression du marché : l'action privilégiée STRC de MicroStrategy s'est fortement dépréciée, et une part record de détenteurs à long terme de BTC et d'ETH sont en perte. Les grands détenteurs d'ETH sont en perte pour la première fois depuis 2019. Concernant la fin du marché baissier, les avis divergent. Yi Lihua estime que juillet-août pourrait être la dernière opportunité d'achat. Jiang Zhuole prédit un creux entre 42 000 $ et 44 000 $ d'octobre à décembre. L'indice de prix sur 4 ans du BTC et la carte thermique de la moyenne mobile sur 200 semaines suggèrent également une phase de possible stabilisation. En résumé, en l'absence de catalyseurs externes majeurs, ce marché baissier pourrait se prolonger encore 2 à 3 mois, avec une période charnière pour un rebond potentiel du BTC vers fin septembre-début octobre.

Odaily星球日报Il y a 16 mins

Combien de temps nous reste-t-il avant la fin du marché baissier des cryptos ?

Odaily星球日报Il y a 16 mins

Les actions semi-conducteurs s'effondrent, mais Anthropic veut fabriquer une puce 2 nm

Selon des informations, l'entreprise d'IA Anthropic aurait initié les premiers travaux pour développer sa propre puce dédiée à l'IA, envisageant de la fabriquer en partenariat avec Samsung en utilisant sa technologie de fabrication avancée de 2 nanomètres et son emballage de pointe. Ce projet, encore à un stade précoce de définition des spécifications, pourrait être abandonné. Cette initiative s'inscrit dans un contexte où la demande de calcul pour son modèle Claude dépasse l'offre disponible. En développant une puce d'inférence personnalisée, Anthropic cherche à optimiser les performances, réduire les coûts opérationnels et gagner en indépendance. Elle rejoint ainsi d'autres géants comme OpenAI, Google et Meta dans cette course à l'autonomie matérielle. Le choix de Samsung comme partenaire de fabrication n'est pas une surprise, ce dernier étant un investisseur stratégique dans le dernier tour de table d'Anthropic. Pour Samsung, c'est l'opportunité de renforcer son activité de fonderie face à TSMC en s'associant à un acteur majeur de l'IA. Cependant, cette quête d'indépendance crée paradoxalement de nouvelles interdépendances dans la chaîne d'approvisionnement mondiale des semi-conducteurs. Anthropic maintient une stratégie de diversification de ses sources de calcul, avec des engagements à long terme massifs auprès d'Amazon AWS (puces Trainium) et de Google (TPU), ainsi que la location d'un vaste cluster de GPU NVIDIA auprès de xAI. Malgré la tendance à la personnalisation des puces, NVIDIA conserve une position dominante sur le marché de l'inférence IA.

链捕手Il y a 39 mins

Les actions semi-conducteurs s'effondrent, mais Anthropic veut fabriquer une puce 2 nm

链捕手Il y a 39 mins

Signal de reprise dans l'écosystème Solana : Mise à niveau de la gouvernance on-chain, actions tokenisées et memes en hausse simultanée

Alors que le marché général des cryptomonnaies reste faible, Solana affiche une performance positive avec une hausse d'environ 14,9% sur une semaine. Cette dynamique s'explique par des signes de reprise au sein de son écosystème et une mise à niveau majeure de sa gouvernance. Dans le domaine des actifs réels tokenisés (RWA), Solana se place en tête des blockchains pour le nombre de portefeuilles détenteurs (plus de 293 000) et d'actifs RWA émis (2 119). Les flux nets d'entrée dépassent 10 milliards de dollars sur 30 jours. Cette croissance est largement portée par l'expansion des actions tokenisées, dont le volume hebdomadaire sur Solana a atteint un record historique de 14,2 milliards de dollars, dominé par la plateforme Backpack. Parallèlement, le marché des meme coins sur Solana connaît un regain d'activité, stimulé notamment par le succès du token ANSEM soutenu par un influenceur, dont la valorisation a brièvement franchi 1,8 milliard de dollars. Sur le plan de la gouvernance, Solana a lancé le mécanisme Solana Governance Proposals (SGP), permettant aux validateurs de soumettre et voter sur des décisions protocolaires de manière entièrement on-chain. Une proposition peut être initiée par un validateur disposant d'au moins 100 000 SOL délégués. Ce nouveau système, qui coexistera avec le processus technique SIMD, vise à accroître la décentralisation et la participation communautaire. Malgré ces développements positifs, la reprise de l'écosystème Solana reste concentrée sur certains secteurs, et son activité globale demeure en deçà des sommets du cycle précédent.

marsbitIl y a 41 mins

Signal de reprise dans l'écosystème Solana : Mise à niveau de la gouvernance on-chain, actions tokenisées et memes en hausse simultanée

marsbitIl y a 41 mins

Trading

Spot
活动图片