Dogecoin Price Retests 100 SMA Again – Here’s What It Means For Price

bitcoinistPublié le 2025-06-23Dernière mise à jour le 2025-06-23

Résumé

After a turbulent price action over the weekend that saw Dogecoin briefly dip below $0.15, the meme-inspired cryptocurrency is now...

Trusted Editorial content, reviewed by leading industry experts and seasoned editors. Ad Disclosure

After a turbulent price action over the weekend that saw Dogecoin briefly dip below $0.15, the meme-inspired cryptocurrency is now back again to testing an important technical level. Particularly, DOGE is now revisiting the 100-week Simple Moving Average (SMA), which has served as a strong support line for more than a year on the weekly candlestick timeframe, raising questions about what might unfold next for its price movement.

Dogecoin Revisits Familiar Support Line

Dogecoin’s recent extended price decline saw it break below $0.15 very briefly in the past 24 hours. Notably, Dogecoin slipped below $0.16 on Saturday for the first time since April, extending a downtrend that’s seen its price fall about 36% in the past 30 days. Over the weekend, DOGE’s price dropped to around $0.143 before rebounding to approximately $0.153 behind heavy trading volume of over five times the recent daily average. 

Interestingly, this downward price action has seen DOGE now retesting a technical indicator that has had an important hand in its price action over the past year. This phenomenon was first noted on the social media platform X by crypto analyst Trader Tardigrade.
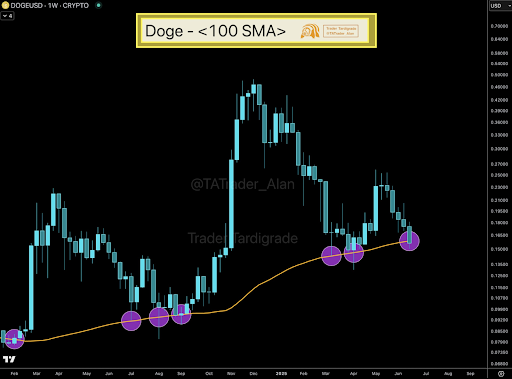
Dogecoin
Source: Trader Tardigrade on X

The chart shared by the crypto analyst on X captures an important pattern. DOGE’s weekly candles have repeatedly bounced off the 100 SMA over the past year, which has made it a vital technical floor for the meme coin. Each time Dogecoin’s price approached or dipped slightly below this moving average, it quickly recovered and went on uptrends.

Dogecoin’s brief plunge to around $0.143, its lowest point since early April, before rebounding above $0.15, has now placed interest with the 100 SMA, which could serve as a launchpad once again if bullish sentiment seeps in.

DOGE Price Zones To Watch

Right now, the important thing is whether Dogecoin can maintain its footing above the $0.145 to $0.151 support zone. The quick rebound following the weekend’s drop below $0.15 shows that buyers are still stepping in at this level. However, any signs of weakness could invalidate the bullish outlook of a bounce off the 100 SMA.

On the upside, reclaiming the $0.153 to $0.16 resistance range with volume confirmation would lend credibility to the idea that Dogecoin is ready for another rally from the 100 SMA. If that happens, price history shows Dogecoin could mirror previous reactions off this moving average and set up a rebound to a resistance level between $0.19 and $0.21. If the current retest leads to another successful bounce, a projection of the most recent bounce shows a move to at least $0.3 could be next.

At the time of writing, Dogecoin is trading at $0.1547, down by 2% in the past 24 hours.

Dogecoin
DOGE trading at $0.15 on the 1D chart | Source: DOGEUSDT on Tradingview.com
Featured image from Getty Images, chart from Tradingview.com
Editorial Process for bitcoinist is centered on delivering thoroughly researched, accurate, and unbiased content. We uphold strict sourcing standards, and each page undergoes diligent review by our team of top technology experts and seasoned editors. This process ensures the integrity, relevance, and value of our content for our readers.

Scott Matherson is a leading crypto writer at Bitcoinist, who possesses a sharp analytical mind and a deep understanding of the digital currency landscape. Scott has earned a reputation for delivering thought-provoking and well-researched articles that resonate with both newcomers and seasoned crypto enthusiasts. Outside of his writing, Scott is passionate about promoting crypto literacy and often works to educate the public on the potential of blockchain.

Lectures associées

Génération d'images par IA accélérée de 1000% sans entraînement, méthode : le « pipeline en trois étapes » le plus simple

Le modèle de génération d’images par IA MrFlow (Multi-Resolution Flow Matching), développé par une équipe de recherche de l’Université de Beihang, de NTU et de l’ETH, propose une accélération significative sans entraînement supplémentaire. Basé sur un pipeline en trois étapes simples, il permet de réduire le temps de génération d’images de haute résolution tout en préservant la qualité. L’approche repose sur trois phases : 1. Génération de structure à basse résolution (12 étapes) pour capturer la composition globale, les couleurs et la sémantique. 2. Sur-échantillonnage dans l’espace pixel à l’aide d’un modèle pré-entraîné comme Real-ESRGAN pour obtenir une image haute définition tout en conservant la clarté structurelle. 3. Raffinement haute résolution en une seule étape, après ajout d’un faible bruit, pour corriger les détails et assurer la cohérence sémantique avec l’invite. Cette méthode atteint une accélération de 10,35× sur des modèles comme Qwen-Image, réduisant le temps de génération de 49,32 s à 4,77 s, avec une perte de qualité inférieure à 1 %. Contrairement aux autres méthodes d’accélération sans entraînement, MrFlow évite les artefacts flous ou les déformations locales grâce au sur-échantillonnage en espace pixel. Elle est compatible avec plusieurs modèles avancés (FLUX.1-dev, SD3, etc.) et peut être combinée à des techniques de distillation pour une accélération supplémentaire. Le code est open source, incluant un plugin ComfyUI pour une utilisation facile.

marsbitIl y a 7 mins

Génération d'images par IA accélérée de 1000% sans entraînement, méthode : le « pipeline en trois étapes » le plus simple

marsbitIl y a 7 mins

Dollars en garantie : comment se forme le « deuxième étage du dollar » au-dessus des stablecoins ?

L'article examine la formation du "dollar collatéral", une couche secondaire de créances en dollars construite sur les stablecoins, et différencie ce mécanisme du système eurodollar traditionnel. L'auteur explique que les stablecoins représentent une créance en dollars tokenisée, mais ne reproduisent pas la capacité d'expansion du crédit des dépôts eurodollars. Alors que le système eurodollar crée de l'élasticité monétaire dès l'émission d'un dépôt bancaire, les stablecoins remplacent principalement certains soldes opérationnels. Leur véritable potentiel systémique émerge lorsqu'un intermédiaire financier utilise des stablecoins comme collatéral pour émettre une nouvelle créance en dollars (la "deuxième couche"), et qu'une troisième partie finance cette créance à une valeur proche du pair. L'article décrit les conditions nécessaires à cette transformation : un contrôle juridique et opérationnel solide sur les jetons, une décote rigoureuse couvrant les risques (émetteur, liquidité, rachat) et la pérennité du financement de la créance secondaire. La pression dans cette chaîne se propage différemment : la première vulnérabilité apparaît au niveau de la créance secondaire (via des appels de marge et une hausse des décotes), bien avant tout problème potentiel de rachat du stablecoin sous-jacent. En conclusion, le "dollar collatéral" n'est pas le stablecoin lui-même, mais la créance en dollars de seconde couche qui est acceptée et financée comme quasi-monnaie. Son élasticité dépend de la volonté des bilans de traiter cette créance comme un actif liquide, et non de la qualité des réserves du stablecoin.

marsbitIl y a 43 mins

Dollars en garantie : comment se forme le « deuxième étage du dollar » au-dessus des stablecoins ?

marsbitIl y a 43 mins

Trading

Spot
活动图片