Supply Mapping: Unlocking On-chain Market Behaviors

insights.glassnodePublié le 2025-04-13Dernière mise à jour le 2025-04-14

Unlike traditional financial markets, where investors' behavior remains hidden, blockchain technology uniquely allows analysts to pinpoint the type of investors who are buying or selling at specific stages of a token's lifecycle and price. Supply Mapping is a new on-chain tool designed to classify token supply based on such investor behavior, offering a new, deeper, and more nuanced understanding of market dynamics.

It builds on the foundation of Cost Basis Distribution (CBD), which maps token supply across price levels – showing where supply is concentrated. However, CBD doesn’t reveal who is buying or selling at those levels. Supply Mapping bridges this gap by introducing a behavioral layer. It identifies different types of market participants based on when they decide to buy or sell, revealing their motivations.

Such a granular segmentation of different investor cohorts based on their behavioral patterns leads to a more comprehensive view of supply dynamics and market sentiment.

💡
Our Dashboard now provides in-depth insights across hundreds of tokens. Access it here.

The Power of Supply Mapping

Understanding investor psychology is crucial in cryptocurrency markets, as repeated emotional behaviors – ranging from exuberant buying driven by FOMO, systematic profit realization at peaks, to fear-driven selling in downturns –underscore market cycles.

Supply Mapping effectively visualizes these emotional dynamics, empowering traders with superior predictive insight into pivotal market turning points.

Behavioral Cohorts Defined

Supply Mapping segments token holders into five mutually exclusive cohorts:

  • Conviction Buyers: Investors accumulating tokens despite declining prices, signaling strong belief in long-term value.
  • Momentum Buyers: Participants purchasing tokens as prices rise, capitalizing on market momentum.
  • Loss Sellers: Investors exiting positions at a loss.
  • Profit Takers: Participants selling tokens at a profit.
  • First-Time Buyers: New entrants engaging with the token for the first time.

Calculating Supply Mapping

Supply Mapping calculation begins by aggregating the cumulative supply of each investor cohort on a daily basis. This cumulative view shows how the supply held by each group evolves over time.

To further enhance interpretability, a 30-day Relative Strength Index (RSI) transformation is applied, normalizing cohort data and clearly highlighting shifts in investor behavior. Green areas indicate rising supply activity, while red signifies declines, vividly capturing dynamic flows and shifting sentiment among cohorts.

Practical Behavioral Insights

The examples below illustrate how Supply Mapping enables traders to effectively read the collective mindset of the market. By interpreting shifts among cohorts, traders can clearly identify emotional extremes such as exuberant buying, panic selling, or profit realization, helping to pinpoint market excesses and anticipate reversals. Let’s break down some examples.

1) Identifying Local Tops

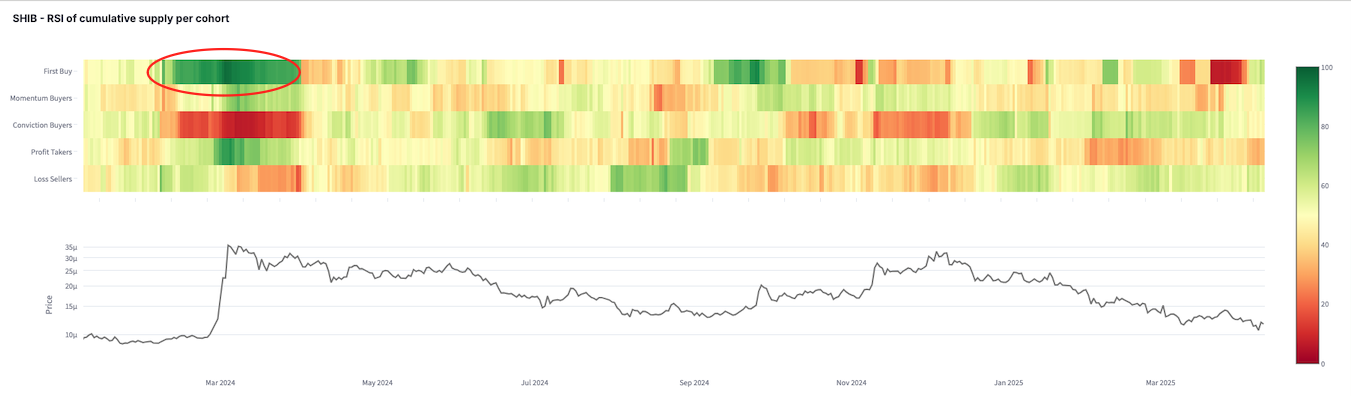
SHIB (March 2024): SHIB experienced a major wave of first-time buyers in March 2024 — a clear sign of retail-driven FOMO. As the price began to climb rapidly, hype kicked in, and new investors rushed in, eager not to miss out. This sudden influx of fresh demand is visible in the on-chain data as a strong spike in First-Time Buyers activity.

This surge of inexperienced buyers coincided almost exactly with the local price peak. Meanwhile, Profit Takers – more experienced market participants – started selling into the strength, locking in gains as the newcomers entered.

Notably, Conviction Buyers did not participate meaningfully in the rally, showing little sign of accumulation. That lack of support, combined with rising profit-taking and aggressive FOMO buying, created an unsustainable structure.

This pattern – fresh demand absorbed by seasoned sellers with no conviction backing – is often a hallmark of market tops. In SHIB’s case, it marked the start of a prolonged downtrend.

On-chain behavioral data captured this perfectly, highlighting how investor psychology leaves footprints in supply flows – and how reading those shifts can offer powerful insight into price dynamics
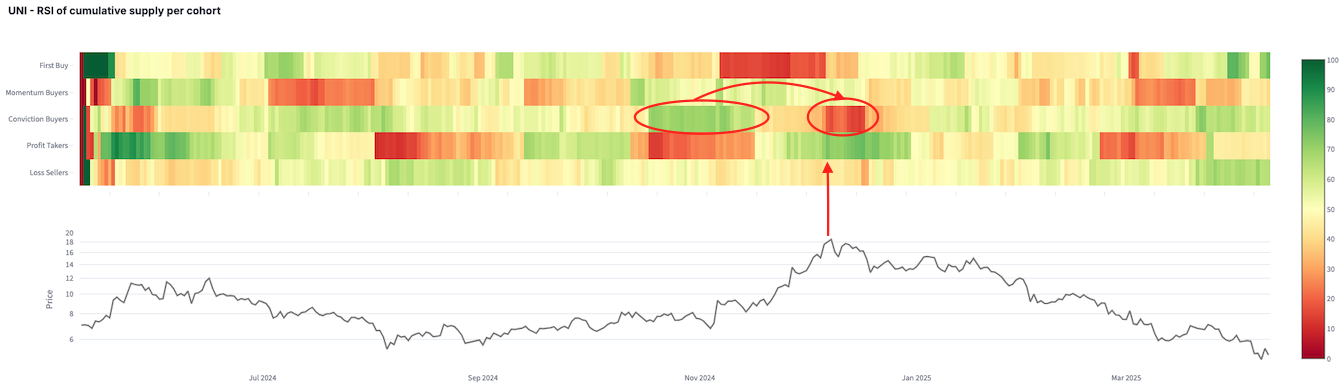
UNI (December 2024): In this example, Supply Mapping reveals again how behavioral data can help identify local market tops before price reversals occur.

Looking at UNI in late 2024, we see that Conviction Buyers (third row from the top) were actively accumulating early in the uptrend – shown by deep green colors. This indicates strong belief-driven buying, typically a healthy sign during price appreciation.

However, as the price approaches its December peak, we observe a clear behavioral shift:

  • Conviction Buyers stop accumulating, with the color fading toward red.
  • Simultaneously, the Profit Takers cohort (fourth row) turns green, signaling a surge in selling from participants locking in gains.

This transition from accumulation to profit-taking was a key warning signal. The growing dominance of Profit Takers suggested that the rally was maturing and that upward momentum could be fading – anticipating the eventual price reversal that followed.
2) Identifying Local Bottoms

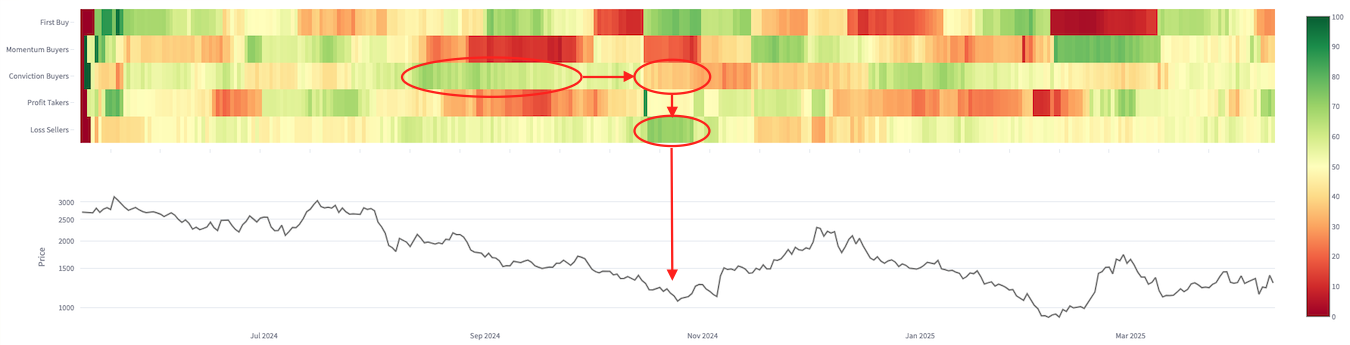
MKR (November 2024): During MKR’s sharp sell-off in November 2024, Supply Mapping highlighted a textbook example of capitulation.

Throughout the price decline, Conviction Buyers (third row from the top) had been steadily accumulating – shown by sustained green coloring – signaling confidence and willingness to absorb the dip.

But as the downtrend intensified, even these high-conviction participants started to give up. The shift is clear:

  • Accumulation by Conviction Buyers fades and eventually disappears.
  • At the same time, Loss Sellers (bottom row) spike sharply into green, indicating that many holders are exiting at a loss.

This behavioral pivot – from conviction to capitulation – is a hallmark of market exhaustion. When even the most resilient holders start selling, it often marks a local bottom. In this case, the simultaneous drop in conviction and surge in loss selling served as a powerful contrarian signal, presenting tactical entry opportunities for traders willing to go against the crowd.
3) Capturing Momentum and Trends

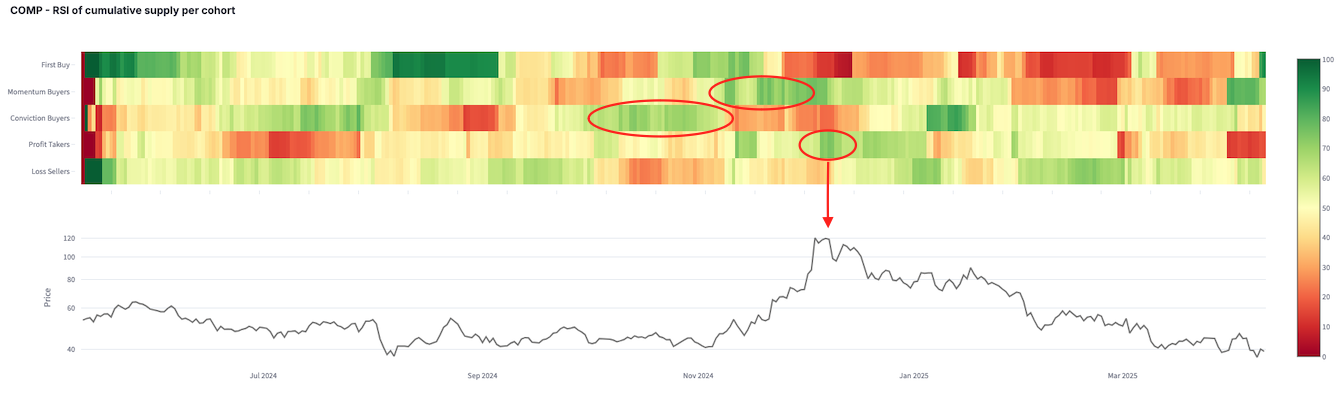
COMP (October–December 2024): The October rally in COMP followed a classic momentum-driven pattern – and Supply Mapping made that structure easy to spot.

Early on, Conviction Buyers (third row) stepped in, accumulating at lower price levels, as shown by the green band. This suggested growing confidence.

Once the price started accelerating, Momentum Buyers (second row) jumped in, pushing the rally higher and feeding the breakout.

But as the rally matured, both groups began to shift behavior:

  • Momentum and Conviction Buyers stopped accumulating, as shown by fading greens.
  • Profit Takers (fifth row) surged into green – indicating widespread realization of gains.

This behavioral rotation, from accumulation to distribution, echoed patterns seen in prior local tops. The rise in profit-taking activity served as an early warning of trend exhaustion, giving traders a chance to de-risk before the subsequent reversal.
These examples demonstrate how Supply Mapping empowers traders to read the collective psychology of the market. By analyzing shifts in behavior across investor cohorts, traders can identify emotional extremes – such as euphoric buying, panic-driven selling, or waves of profit-taking. These behavioral inflection points help reveal moments of market excess and can serve as early indicators of potential trend reversals.

Conclusion

Supply Mapping provides traders with a powerful lens to decode market psychology and behavior directly from on-chain data. When combined with traditional Cost Basis Distribution (CBD), it enhances visibility into not just where supply is positioned but also who is driving it. By uncovering the strategies and emotions behind participant actions – from conviction to capitulation – Supply Mapping helps traders better anticipate turning points and make more informed, timely decisions.


Lectures associées

Le vent de l'IA "active" souffle sur la Silicon Valley, Hark lève 700 millions de dollars

L'entreprise américaine Hark, fondée fin 2025 et encore sans produit public, a levé 700 millions de dollars en série A, atteignant une valorisation de 6 milliards de dollars. Le tour de table est mené par Parkway Venture Capital et comprend des géants technologiques comme NVIDIA, AMD Ventures, Intel Capital, Qualcomm Ventures et Salesforce Ventures. Hark vise à créer la prochaine interface universelle homme-machine en combinant un "modèle de base auto-développé" avec du "matériel sur mesure". Son objectif est de développer une nouvelle interface d'intelligence artificielle matérialisée par du matériel natif AI : une gamme d'appareils matériels personnalisés dotés de capacités d'agent intelligentes, équipés de modèles vocaux de bout en bout et d'une mémoire hautement personnalisée. Ces systèmes AI multimodaux sont conçus pour comprendre et interagir de manière naturelle. Le fondateur, Brett Adcock, a auparavant créé Archer et Figure. Son expérience dans les systèmes intégrant l'IA, le matériel et l'interaction avec le monde réel (comme chez Figure) est considérée comme un atout clé pour Hark. L'entreprise a également recruté d'anciens cadres d'Apple, Meta, Google et Tesla. L'article souligne que l'IA actuelle, bien que puissante, est principalement confinée aux écrans et fonctionne de manière réactive. Hark et d'autres pionniers visent à créer une IA "active" qui agit comme un collaborateur, anticipant les besoins et agissant de manière autonome. Cette évolution nécessite des avancées conjointes en modèles de base, systèmes d'exploitation pour agents, mémoire personnalisée et terminaux matériels. Enfin, l'article note que les startups chinoises possèdent des avantages significatifs dans ce domaine, notamment un écosystème manufacturier complet (comme à Shenzhen), un vaste marché d'adoption et un soutien politique fort en faveur de l'IA. Le financement majeur de Hark confirme une tendance émergente : l'avenir de l'IA se jouera non seulement sur les écrans, mais aussi dans le monde physique via des appareils natifs intelligents.

marsbitIl y a 27 mins

Le vent de l'IA "active" souffle sur la Silicon Valley, Hark lève 700 millions de dollars

marsbitIl y a 27 mins

Les concurrents s'introduisent en Bourse les uns après les autres, Kimi commence à s'impatienter

La société chinoise d'IA Moon (Kimi) a officiellement entamé la démantèlement de sa structure VIE et Red Chip, préparant ainsi une introduction potentielle à la Bourse de Hong Kong. Cette décision intervient alors que ses concurrents directs, Zhipu AI et MiniMax, ont déjà réalisé leur IPO en début d'année 2026, déclenchant un réévaluation importante des sociétés de grands modèles de langage sur les marchés financiers. La valorisation de Moon a connu une croissance spectaculaire, passant de 3 milliards de dollars à sa création en 2023 à plus de 200 milliards de dollars en mai 2026. Les experts estiment que cette valorisation reflète une anticipation par le marché du potentiel de la société à devenir une future plateforme d'entrée vers l'IA en Chine, plutôt que ses performances financières actuelles. Historiquement focalisée sur la recherche et le développement technique sous la direction de son fondateur Yang Zhilin, la société a récemment opéré un virage stratégique. Elle a réduit ses dépenses publicitaires et ses objectifs en termes d'utilisateurs actifs mensuels pour se concentrer sur le développement d'Agents IA et la monétisation via des abonnements payants et des API. Cette nouvelle orientation commerciale semble porter ses fruits, avec des revenus récurrents annuels dépassant les 2 milliards de dollars. Les analystes préviennent que l'entrée en bourse imposera de nouvelles contraintes. La société devra équilibrer ses investissements en R&D avec les attentes de rentabilité des investisseurs, tout en renforçant sa gouvernance, sa conformité et la transparence de sa stratégie commerciale. Le défi pour Moon sera de transformer son avance technologique en une rentabilité durable pour justifier sa valorisation élevée.

marsbitIl y a 46 mins

Les concurrents s'introduisent en Bourse les uns après les autres, Kimi commence à s'impatienter

marsbitIl y a 46 mins

Les marchés américains atteignent des sommets, alors pourquoi les consommateurs sont-ils de plus en plus pessimistes ?

Malgré les records successifs du marché boursier américain, le sentiment des consommateurs atteint des niveaux historiquement bas. Cet écart apparent s'explique par une division structurelle croissante de l'économie, qualifiée de "K-shaped". Premièrement, l'enquête sur la confiance des consommateurs de l'Université du Michigan pourrait être biaisée par un échantillon surreprésentant les démocrates, généralement plus pessimistes. Cependant, le malaise est réel pour une partie de la population qui subit la pression de l'inflation passée sur les prix alimentaires et énergétiques, sans voir ses salaires suivre. Le cœur du problème réside dans l'inégalité de l'exposition aux actifs. Environ 60% des Américains détiennent des actions, directement ou indirectement, et bénéficient de la hausse des marchés. Les 40% restants, sans investissements, se sentent davantage distancés. Ainsi, la vigueur apparente de la consommation agrégée est en réalité portée par le haut de la pyramide : les 10% des consommateurs les plus aisés contribuent désormais à près de 50% des dépenses. Les ménages modestes, majoritaires, voient leur part se réduire et leur situation se fragiliser. Pour les investisseurs, cette faible confiance est historiquement un bon indicateur contraire, annonciatrice de rendements boursiers solides à un an. Mais cette dynamique perpétue le clivage : les facteurs qui alimentent la hausse des actifs financiers (détenus par les plus riches) accentuent simultanément les pressions inflationnistes sur les budgets des ménages sans patrimoine. L'économie américaine montre une résilience de plus en plus concentrée, creusant le fossé entre les détenteurs d'actifs et les autres.

marsbitIl y a 1 h

Les marchés américains atteignent des sommets, alors pourquoi les consommateurs sont-ils de plus en plus pessimistes ?

marsbitIl y a 1 h

La stratégie de double stablecoin de Tether : l’USAT conforme n’est qu’un écran de fumée, l’USDT jamais conforme est la vérité ?

En 2026, Tether a lancé l'USAT, une monnaie stable conforme à la loi américaine GENIUS Act, émise par une banque américaine. Cependant, cette initiative est analysée comme une stratégie permettant à son produit principal, l'USDT (d'une capitalisation de plus de 1830 milliards de dollars), de rester durablement hors du cadre réglementaire américain. L'USAT sert de façade « conforme » aux États-Unis, avec des réserves auditées et une structure supervisée. En revanche, l'USDT continue d'être émis offshore, avec des réserves contenant des actifs comme de l'or et du Bitcoin, interdits par la loi GENUS. Cette structure génère des profits élevés pour Tether mais l'empêcherait de se conformer pleinement. L'article souligne que l'USDT est systémique dans de nombreuses économies émergentes, servant d'outil d'épargne et de paiement. Le double système crée une séparation : l'USAT adressera le marché régulé américain, tandis que l'USDT conservera sa base internationale hors de la supervision des États-Unis. D'ici 2028, les plateformes américaines devront supprimer les stablecoins non conformes, ce qui achèvera cette séparation planifiée. Tether est également devenu un important détenteur de dette du Trésor américain via l'USDT, accentuant la dépendance des États-Unis envers une entité qu'il ne régule pas. En somme, l'USAT n'est pas le signe que Tether se conforme, mais un mécanisme permettant à l'USDT de rester indéfiniment hors de portée réglementaire, posant la question des implications d'un outi dollarisé aussi crucial échappant au contrôle de son pays d'émission.

marsbitIl y a 1 h

La stratégie de double stablecoin de Tether : l’USAT conforme n’est qu’un écran de fumée, l’USDT jamais conforme est la vérité ?

marsbitIl y a 1 h

Trading

Spot
Futures
活动图片