Is the Metaverse Dead? On-Chain Data Tells a Different Story

insights.glassnodePublié le 2025-03-09Dernière mise à jour le 2025-04-07

This is the third article in our series exploring Glassnode’s Cost Basis Distribution (CBD) metric and its practical applications. Previously, we demonstrated how to apply CBD insights across assets and how to identify capitulation events on a CBD heatmap.

For a deeper dive into the methodology and calculations behind this metric, refer to our detailed research piece here.

This week, we introduce another use-case-specific exploration of CBD - analyzing Metaverse tokens. Despite declining prices and fading hype, on-chain data suggests that major investors remain active, steadily accumulating and lowering their cost basis.

Does this signal a long-term bet on a Metaverse resurgence? Let’s first recap how to analyze and interpret CBD data and then apply that knowledge to the latest trends in Metaverse.

Understanding Cost Basis Distribution

Cost Basis Distribution (CBD) tracks where token supply is concentrated based on the average cost basis of holders. By analyzing shifts in supply distribution, we can identify investor behavior - whether they are accumulating, capitulating, or redistributing their holdings.

How to Read CBD Heatmaps:

  • Color Intensity (Supply Distribution)
    A warmer color (red/yellow) indicates a high concentration of supply at a given price range, while cooler colors (blue/green) signal lower supply.
  • Vertical Axis (Cost Basis)
    Each horizontal slice represents a price range where a portion of supply last moved, showing how holders adjust their cost basis over time.

Tracking these changes helps us pinpoint potential market turning points, where accumulation or distribution trends may signal future price movements.

Metaverse Tokens: What Cost Basis Distribution Data Reveals

In this analysis, we focus on Metaverse tokens - The Sandbox (SAND), Decentraland (MANA), and Axie Infinity (AXS) - which were among the most prominent assets during the Metaverse boom of 2021. While the hype surrounding virtual worlds has faded, we shift our focus away from user activity and instead examine investor behavior using Cost Basis Distribution (CBD) data.

Rather than evaluating adoption metrics or in-game activity, we analyze how token holders have adjusted their positions over time. Are they capitulating, holding steady, or accumulating at lower prices? By tracking supply shifts at different price levels, we gain insights into how investor conviction has evolved in this post-hype phase and whether accumulation trends hint at long-term confidence in these projects.

The Sandbox (SAND): Steady Accumulation in a Bear Market

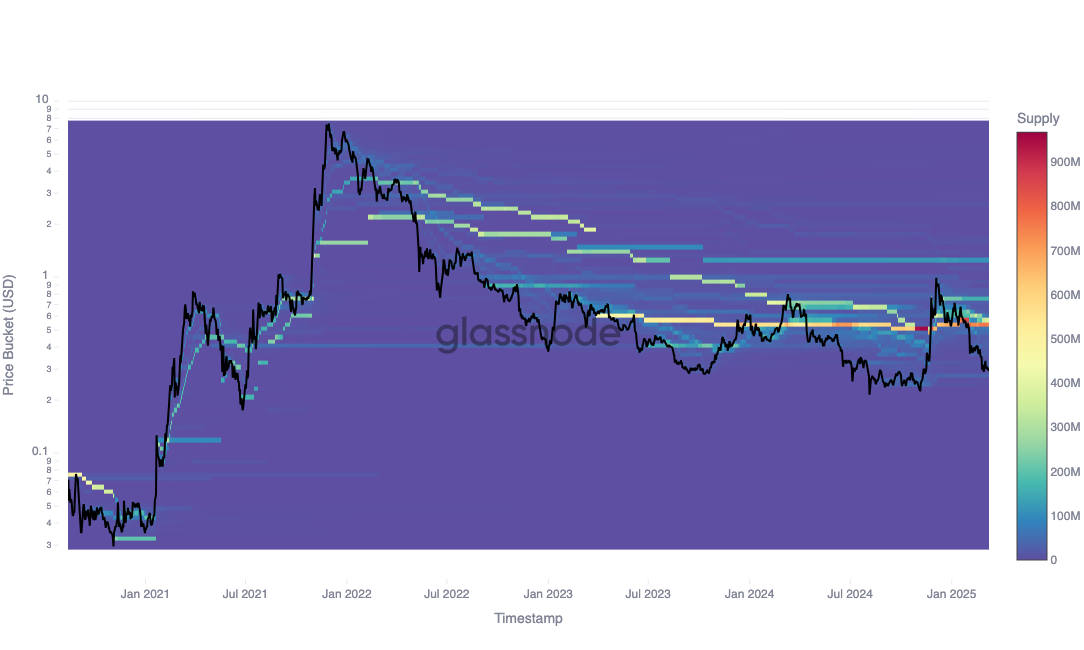
Despite price volatility, on-chain data shows continued accumulation. Holders with strong conviction are steadily increasing their positions, reinforcing their belief in the project's long-term potential.
💡
Key Insight: Accumulation persists across key price levels, suggesting confidence despite bearish conditions.
image.png
CBD shows SAND investors remained engaged throughout long-term investment horizons
🔗
View Cost Basis Distribution Data for SAND across multiple timeframes in Glassnode Studio.

Decentraland (MANA): Buying the Dip

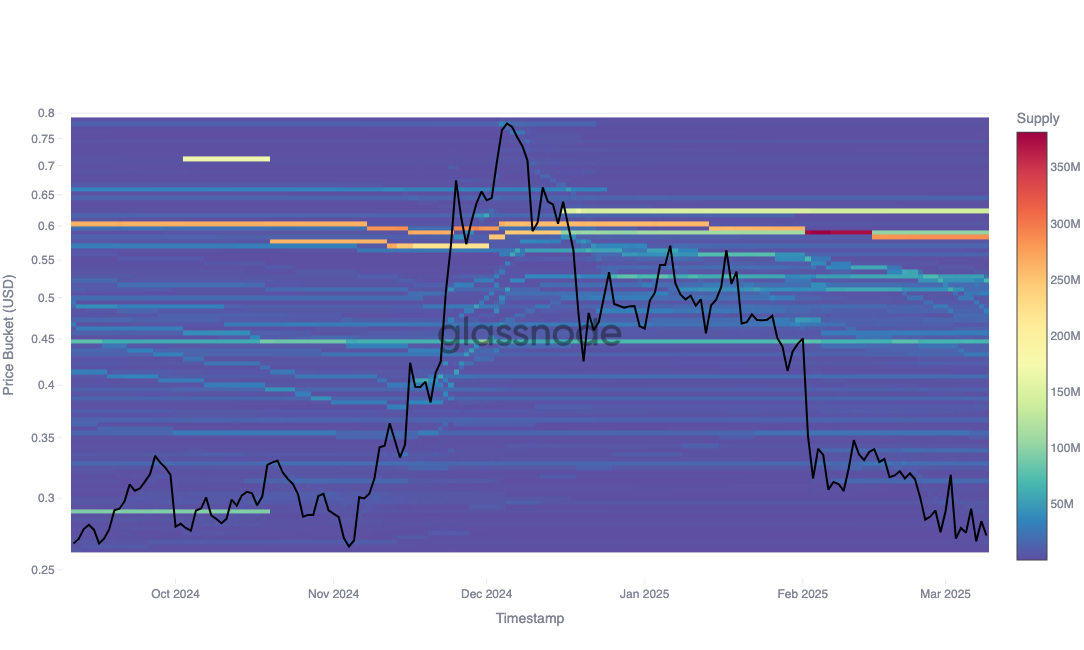
A significant supply concentration has formed around $0.60, reflecting increased buying activity following a price drop. This suggests that investors are viewing lower prices as buying opportunities, rather than signs of further decline.
💡
Key Insight: Market participants are actively accumulating at perceived value zones.
image.png
Notice supply concentration at around $0.6 increasing in Feb 2025 despite the price drop
🔗
View Cost Basis Distribution Data for MANA across multiple timeframes in Glassnode Studio.

Axie Infinity (AXS): Long-Term Conviction Remains

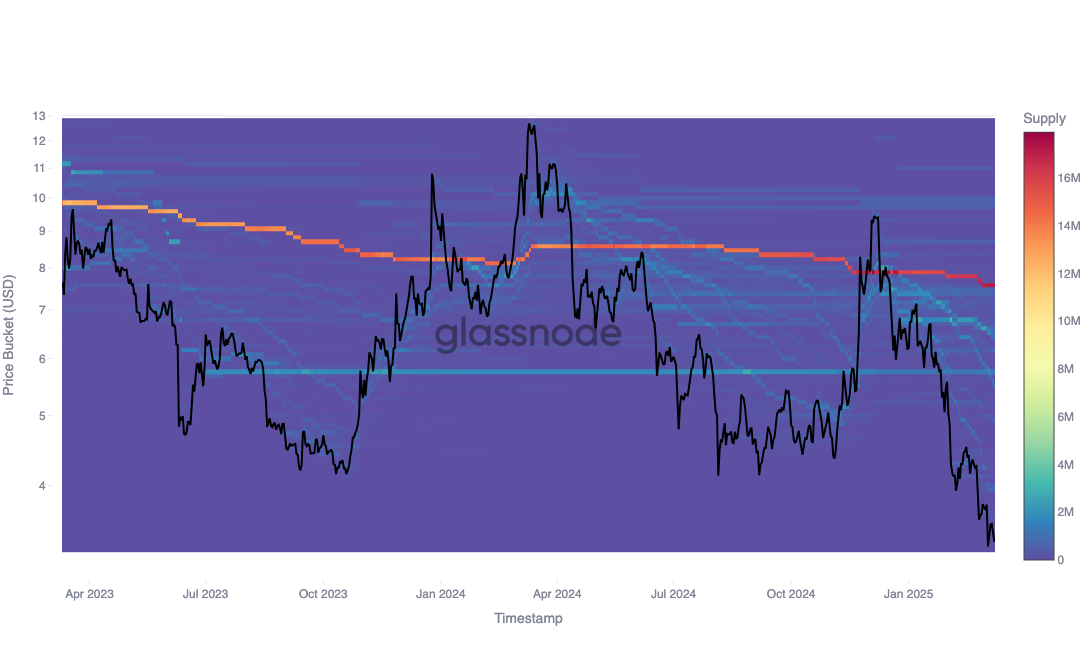
Despite a sustained downtrend, on-chain data shows a progressive build-up of large positions. This pattern suggests that certain investors remain highly confident in the future of Axie Infinity.
💡
Key Insight: Persistent accumulation hints at long-term belief in the project’s fundamentals.
image.png
Notice consistent accumulation over the past two years showing low sensitivity to price action
🔗
View Cost Basis Distribution Data for AXS across multiple timeframes in Glassnode Studio.

Is Metaverse Resurgence Ahead?

The speculative hype around the Metaverse may have faded, but on-chain activity suggests otherwise. The continued accumulation across major Metaverse tokens indicates that many investors see these projects as undervalued opportunities rather than failures.

Is this setting the stage for a future recovery? While price action remains uncertain, the data suggests that conviction remains strong among key market participants - and they are positioning accordingly.

Lectures associées

Le décès inattendu du PDG, le récit de la « tokenisation » d'ONDO va-t-il changer ?

Le fondateur et PDG d'Ondo Finance, Nathan Allman, est décédé subitement. Figure clé du secteur RWA, il a été l'architecte de la transition d'Ondo, d'un protocole DeFi à produit de rendement structuré vers un pilote de la tokenisation d'actifs traditionnels (bons du Trésor américain, actions, ETF). À court terme, cet événement suscite des interrogations sur la continuité de la vision, les partenariats institutionnels et la valorisation du jeton ONDO. Cependant, à plus long terme, Ondo dispose d'une structure établie. Le nouveau PDG, Ian De Bode, ancien président et responsable de la stratégie chez Ondo, possède un solide parcours en finance traditionnelle et en conseil. Son profil semble adapté à la phase actuelle du projet, axée sur la conformité réglementaire, l'expansion et la collaboration institutionnelle. Le défi pour Ondo sera de prouver qu'il s'agit d'une infrastructure financière durable et non d'un projet porté uniquement par son fondateur. L'avenir de l'ONDO en tant que "premier actif de tokenisation" dépendra de la capacité de la nouvelle équipe à maintenir le rythme de développement des produits (OUSG, USDY, Ondo Global Markets), à étendre le volume d'actifs sous gestion et à répondre à la demande réelle du marché. Le décès de Nathan Allman est une perte pour le secteur RWA, mais il laisse derrière lui une voie claire : intégrer les marchés financiers traditionnels matures dans l'écosystème blockchain.

marsbitIl y a 24 mins

Le décès inattendu du PDG, le récit de la « tokenisation » d'ONDO va-t-il changer ?

marsbitIl y a 24 mins

La multiplication par deux de NEAR : 3 tendances clés propulsent le prix de la crypto

NEAR double son prix : 3 moteurs principaux Le prix du token NEAR a fortement augmenté, passant de 1,24 $ début mai à environ 2,37 $ le 25 mai, avec une capitalisation redépassant les 30 milliards de dollars. Cette performance s'explique par trois facteurs clés. Premièrement, le récit de l'IA : le cofondateur Illia Polosukhin est l'un des auteurs de l'article fondateur Transformer, à l'origine des grands modèles de langage modernes. NEAR intègre désormais l'IA dans sa stratégie et son application phare, Near.com, étant perçu comme une infrastructure d'IA décentralisée. Deuxièmement, l'accent sur la confidentialité : face à la demande croissante, NEAR a lancé des fonctions comme « Confidential Payments » et « Confidential Intents ». Ces outils permettent des transferts privés entre plus de 35 blockchains, protégeant les données des utilisateurs et des entreprises, ce qui équilibre confidentialité et utilité. Troisièmement, un mécanisme de rachats : depuis fin 2025, la totalité des tokens NEAR est en circulation. Les frais générés par NEAR Intents, sa couche de transactions inter-chaînes, sont utilisés pour racheter des tokens NEAR sur le marché, réduisant la pression de vente. Avec un TVL dépassant 8000 millions de dollars, ces rachats mensuels s'élèvent à environ 3 millions de dollars. Ces éléments combinés - le potentiel de l'IA, les innovations en matière de vie privée et un modèle économique favorable - ont propulsé la récente valorisation de NEAR.

marsbitIl y a 32 mins

La multiplication par deux de NEAR : 3 tendances clés propulsent le prix de la crypto

marsbitIl y a 32 mins

Trading

Spot
Futures
活动图片