Executive Summary
- Bitcoin’s rally to $93k has been fuelled by robust capital inflows from both ETFs, and spot markets. Over $62.9B has entered the market over the last 30 days, with BTC dominating the demand inflows.
- Elevated unrealized profits among long-term holders have triggered significant spending activity, with 128k BTC sold between 8-October and 13-November.
- U.S. Spot ETFs played a pivotal role, absorbing around 90% of the selling pressure from long-term holders over the analyzed period. This highlights the growing importance of the ETFs in maintaining liquidity, and stabilizing the market.
Capital Inflows Surge
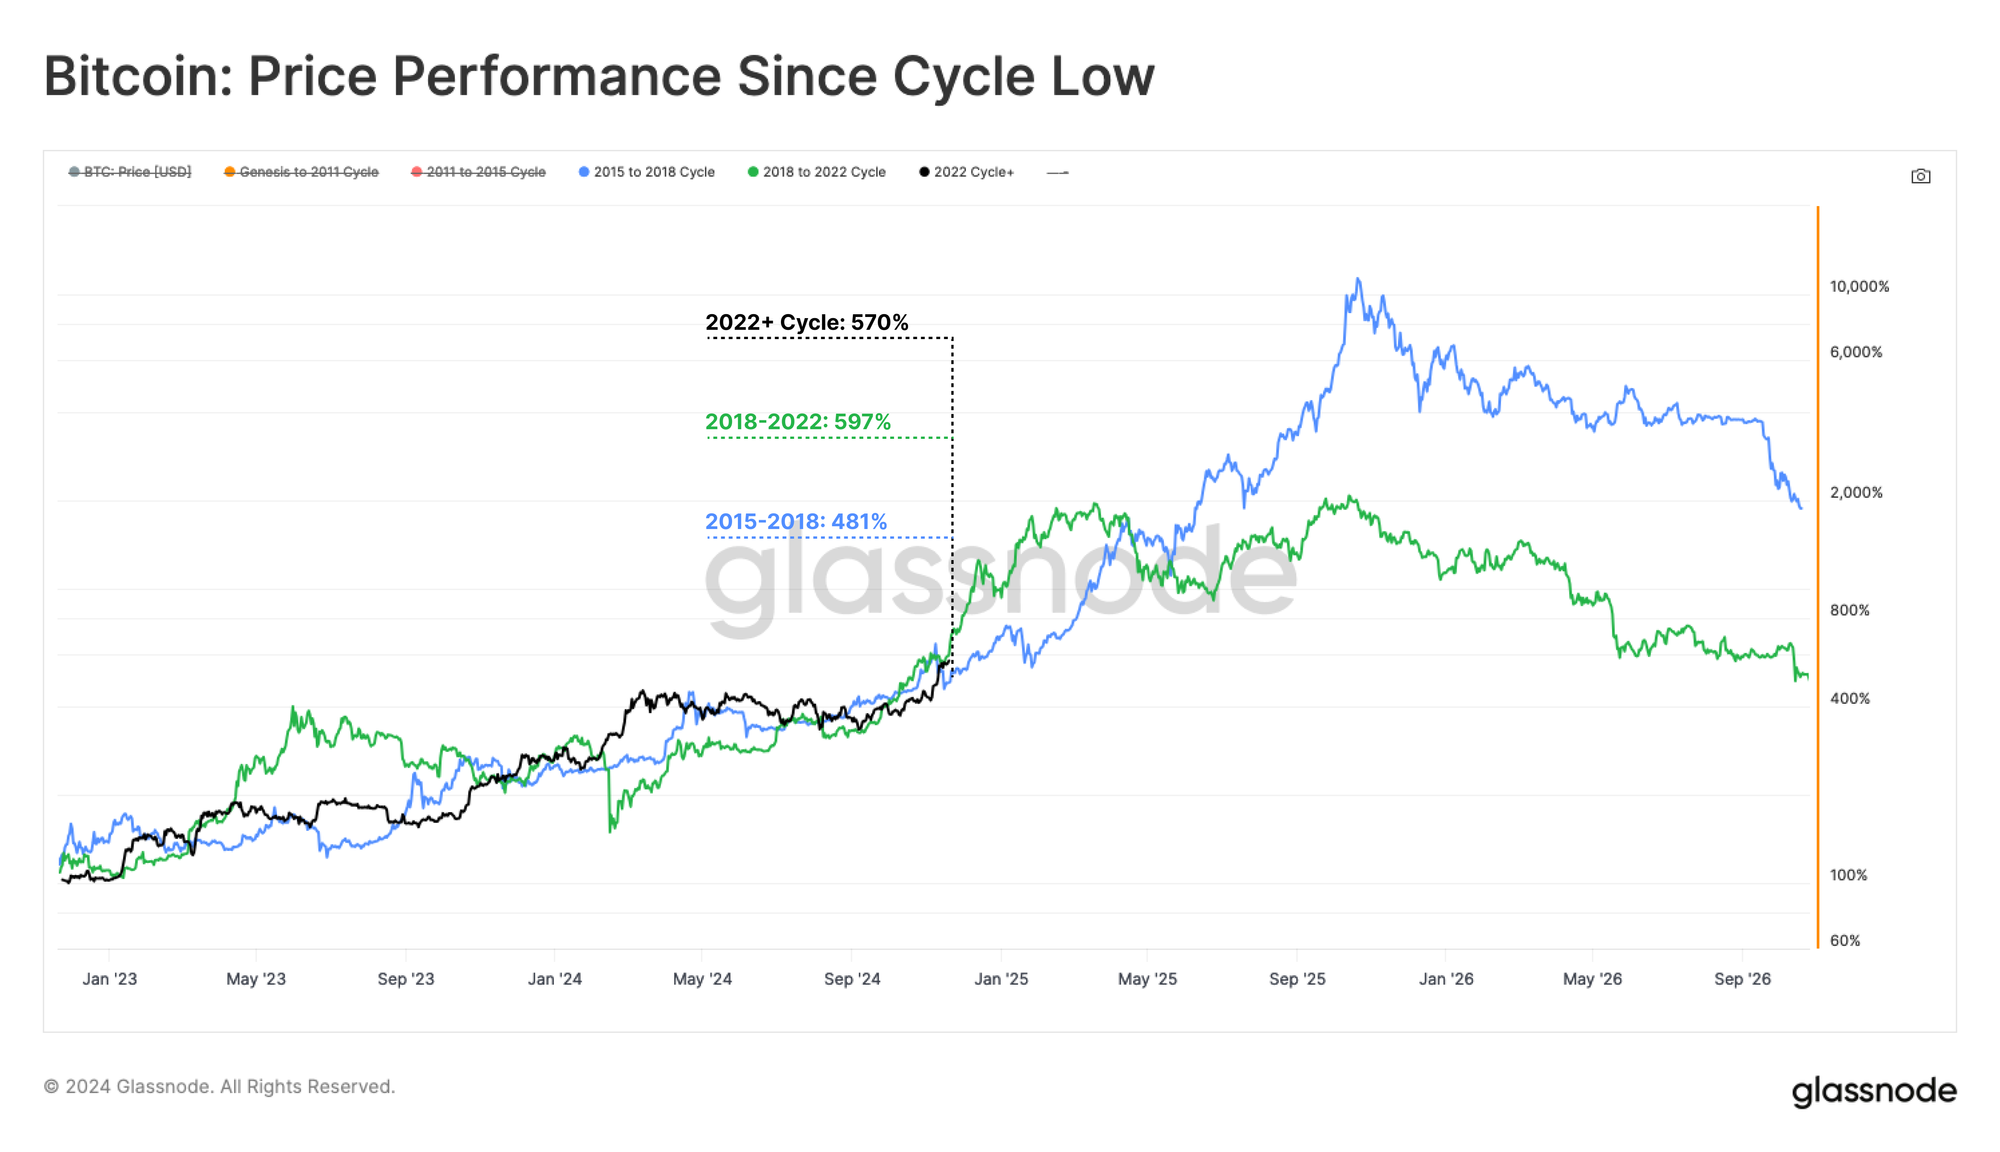
Since the start of November, the Bitcoin price performance has been nothing short of remarkable, repeatedly forming new ATHs throughout the month. When comparing the price performance of the current cycle to the 2015-2018 🔵 and 2018-2022 🟢 cycles, a striking persistent similarity can be seen. Both the magnitude of the rally, and the duration are surprisingly consistent, despite vastly differing market conditions.
This longstanding consistency over cycles remains intriguing, offering insights into Bitcoin’s macro price behaviour and cyclical market structure.
Historically, bull markets in the past have extended for between 4 and 11 months from the current point, providing a historical framework for assessing cycle duration and momentum.
A new ATH has been set this week at $93.2k, putting Bitcoin’s quarterly performance at an impressive +61.3%. This is an order of magnitude higher than the comparative performance of both Gold and Silver, which have seen more modest quarterly rises of +5.3% and +8.0%, respectively.
This stark contrast suggests a potential rotation of capital from traditional commodity store of value assets, towards Bitcoin being a younger, emergent and digital one.
The Bitcoin market capitalization has also expanded to a staggering $1.796T, making it the 7th largest asset globally. This move positions Bitcoin above two symbolically significant global assets: silver, valued at $1.763 trillion, and Saudi Aramco, at $1.791 trillion.
As of current, Bitcoin trails Amazon by only 20%, placing this as the next important milestone in its journey up the ranks of the world’s most valuable assets.

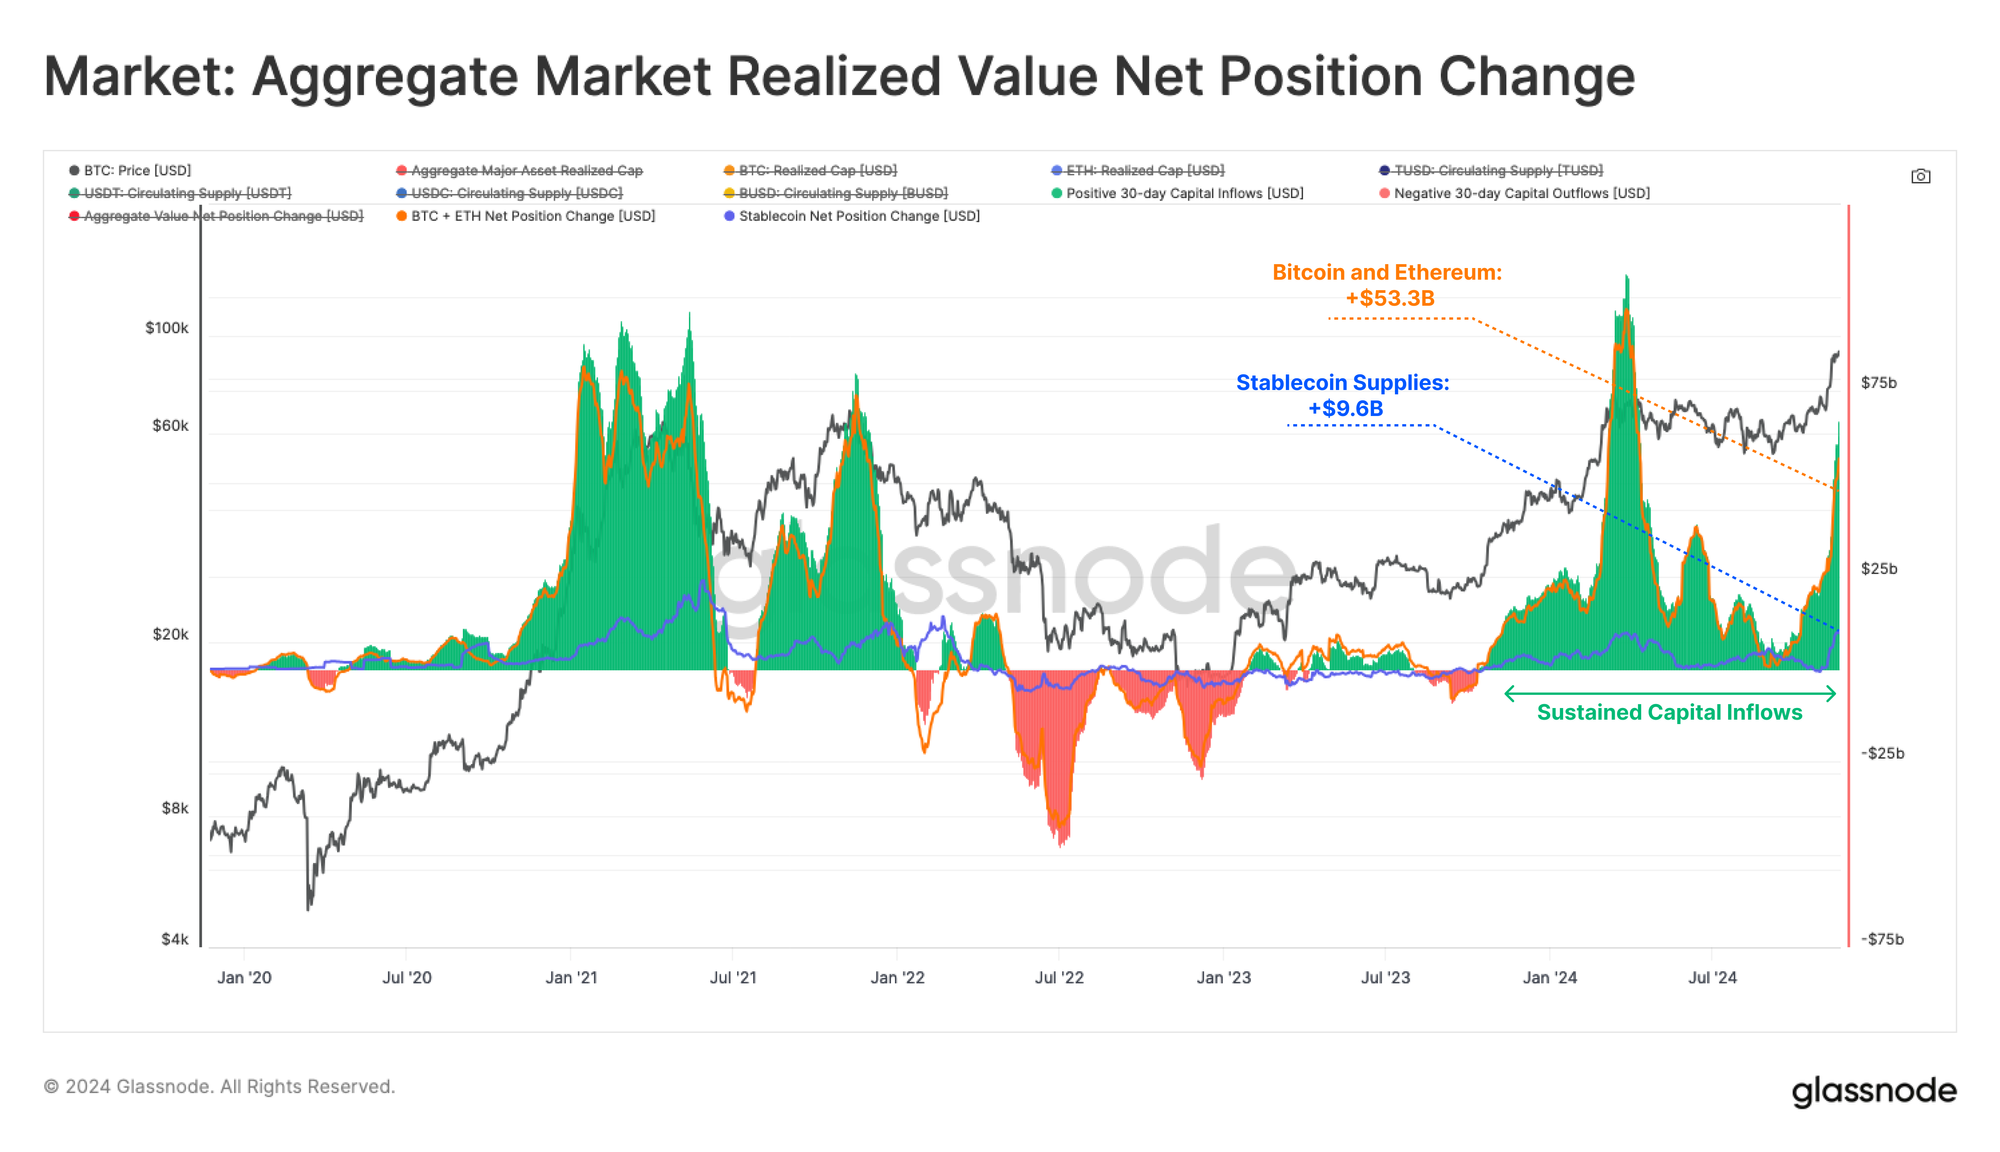
Following Bitcoin’s standout 90-day performance, the broader digital asset market is starting to experience a meaningful influx of capital. Over the past 30 days, aggregate inflows have reached a massive $62.9 billion, with Bitcoin and Ethereum networks absorbing $53.3 billion, while stablecoin supplies have expanded by $9.6 billion.
These inflows mark the highest levels since the March 2024 peak, and reflects renewed confidence and fresh demand after the U.S. presidential election.
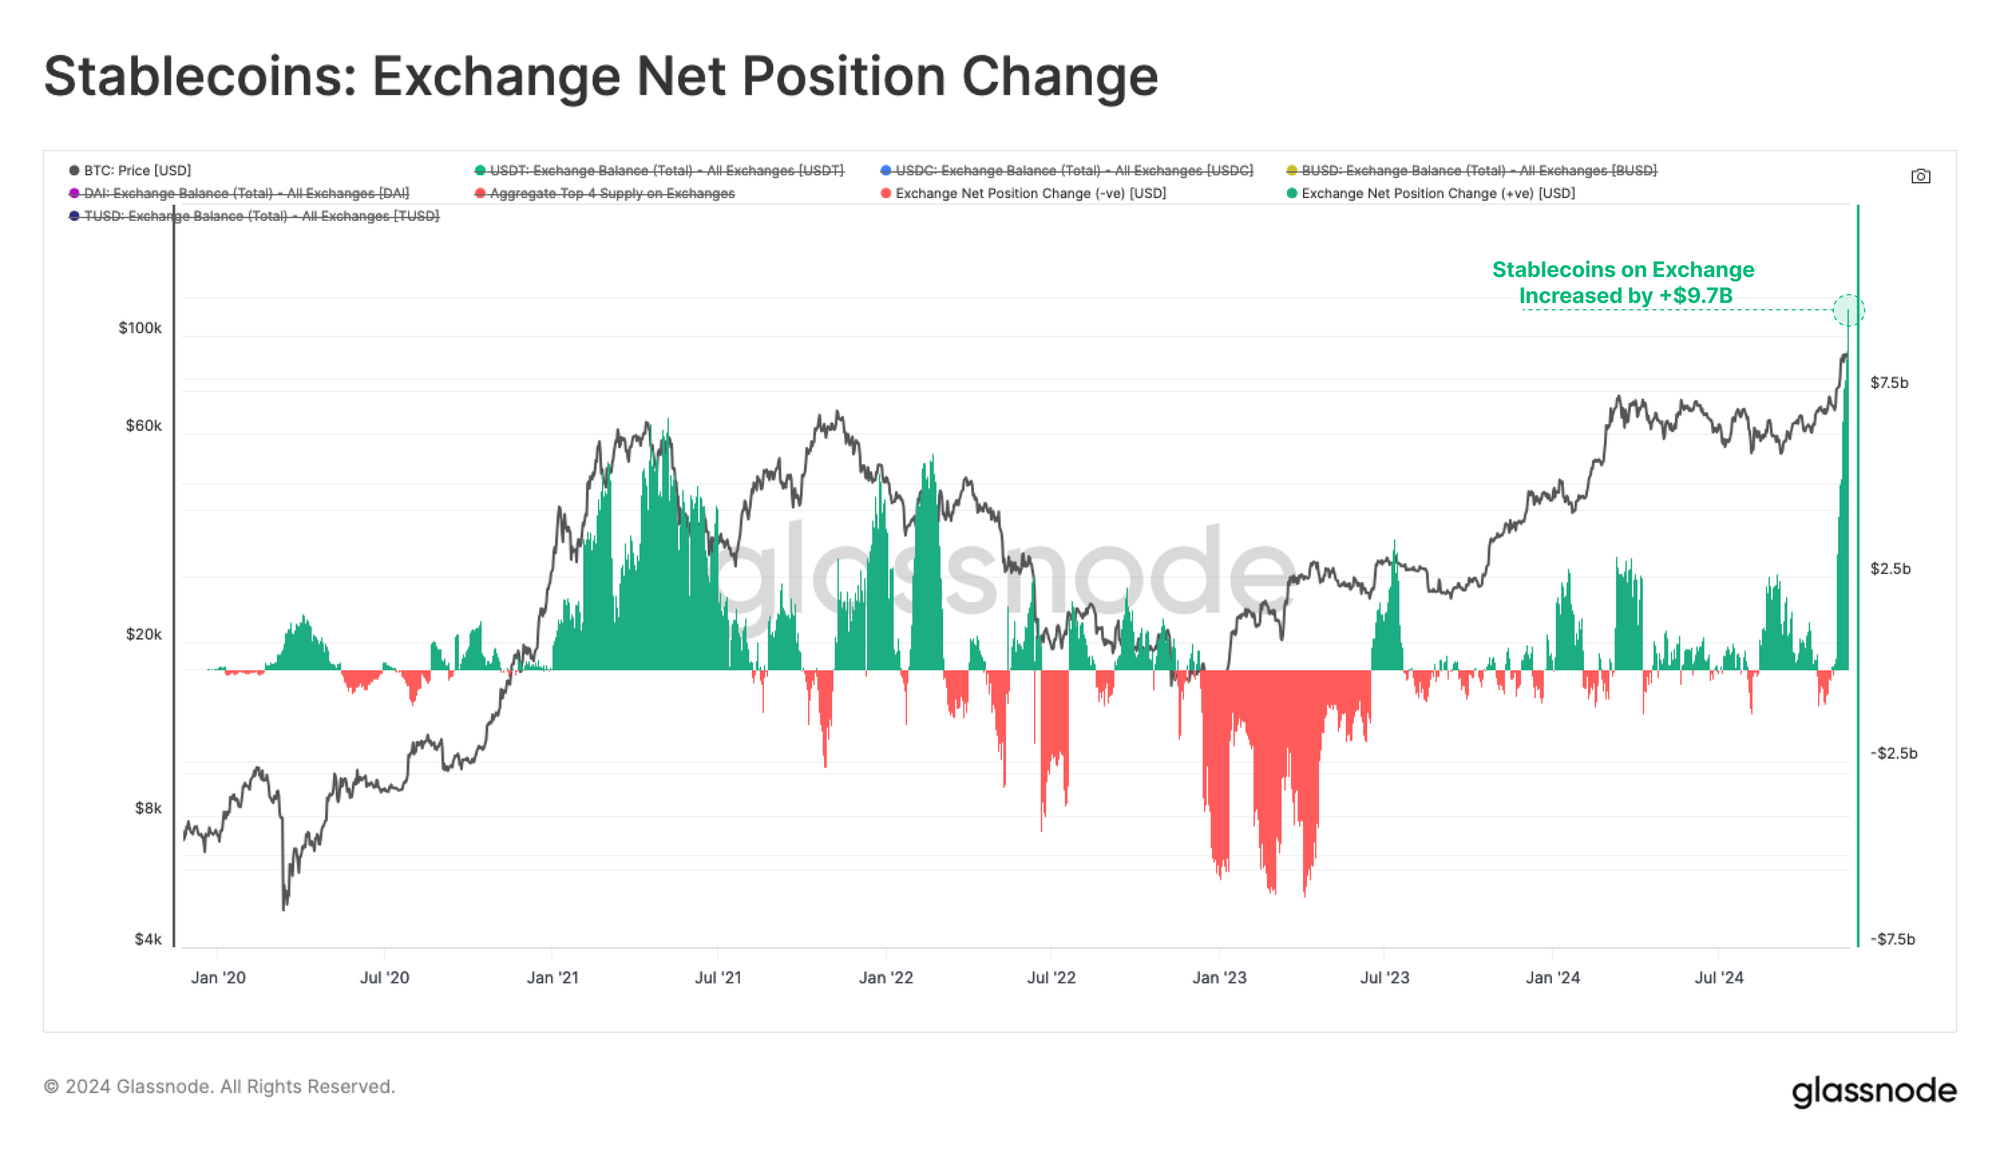
Expanding on the capital inflows observed, the vast majority of the $9.7 billion in stablecoins minted over the past 30 days were deployed directly to centralized exchanges. This inflow closely matches the total capital flows for stablecoin assets during the same period, emphasizing their pivotal role in stimulating market activity.
The surge in stablecoin balances on exchanges reflects strong speculative demand as investors position to capitalize on trends, further reinforcing the bullish narrative and post-election momentum.
Investigating the Profitability of Investors
We have thus far explored the tides of rising market liquidity, which has supported outperformance for Bitcoin. In this next section, we will evaluate how this price action has affected the unrealized profitability (paper gains) of market investors, utilizing the MVRV Ratio.
When comparing the current value of the MVRV Ratio 🟠 against its yearly moving average 🔵, we can see an acceleration in investor profitability. This phenomena has typically been a supportive environment for continued market momentum, but also creates conditions where investors become more likely to start taking profits to realize these paper gains.

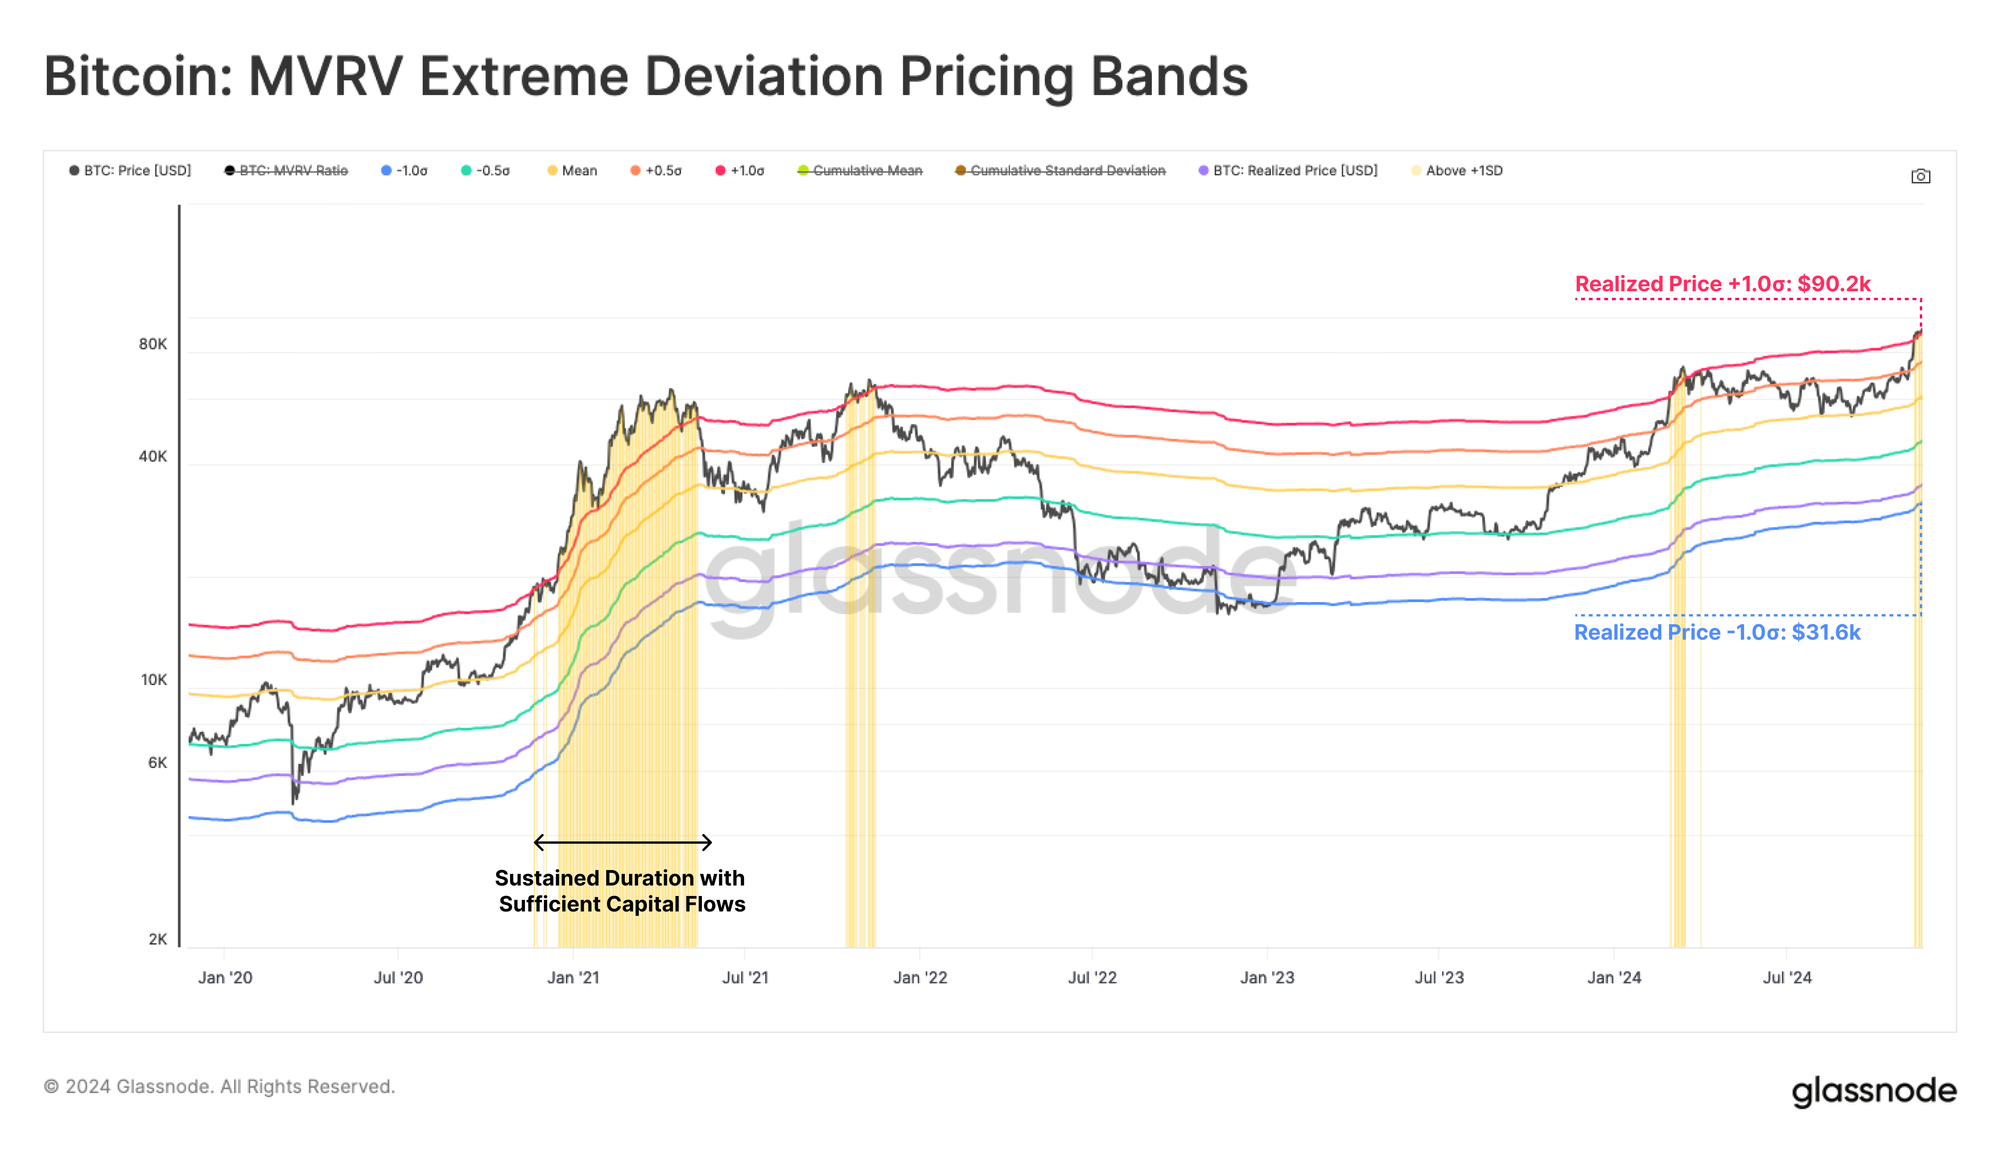
As the profitability of market investors increases, the elevated potential for new sell-side pressure comes into play. By overlaying the MVRV Ratio with ±1 standard deviation bands, we can construct a framework to assess over and under-heated market conditions.
- Overheated (warm colors): MVRV trades above +1SD
- Underheated (cool colors): MVRV trades below -1SD
Bitcoin's price has recently broken above the +1σ band, located at $89.5k. This signals that investors are now holding statistically significant unrealized profits, and suggests an increased likelihood of profit-taking activities.
Nevertheless, the market has historically remained in this overheated state for extended periods of time, especially when supported by sufficiently large capital inflows to absorb sell-side pressure.
Long-Term Holders Spending at Extremes
During the euphoric phase of the market cycle, the behaviour of long-term investors becomes critical to monitor. LTHs control a substantial proportion of the supply, and their spending dynamics can greatly impact the market stability, eventually working to form both local, and global tops.
We can evaluate the paper gains held by LTHs by utilizing the NUPL metric, which currently resides at 0.72, just below the Belief 🟢 to Euphoria 🔵 threshold at 0.75. Despite the substantial price increase, sentiment among these investors remains measured compared to previous cycle tops, suggesting there may be further room for growth.

As Bitcoin broke above $75.6k, 100% of the 14M BTC held by long-term holders moved into profit, enticing an acceleration in spending. This has led to a non-trivial balance decline of +200k BTC since the ATH break-out.
This is a classic and repeating pattern, where long-term holders begin taking profits whenever price action is strong, and demand is sufficient to absorb it. With a significant amount of Bitcoin still under LTH ownership, it is likely that many LTHs are waiting for higher prices before releasing more coins back into liquid circulation.

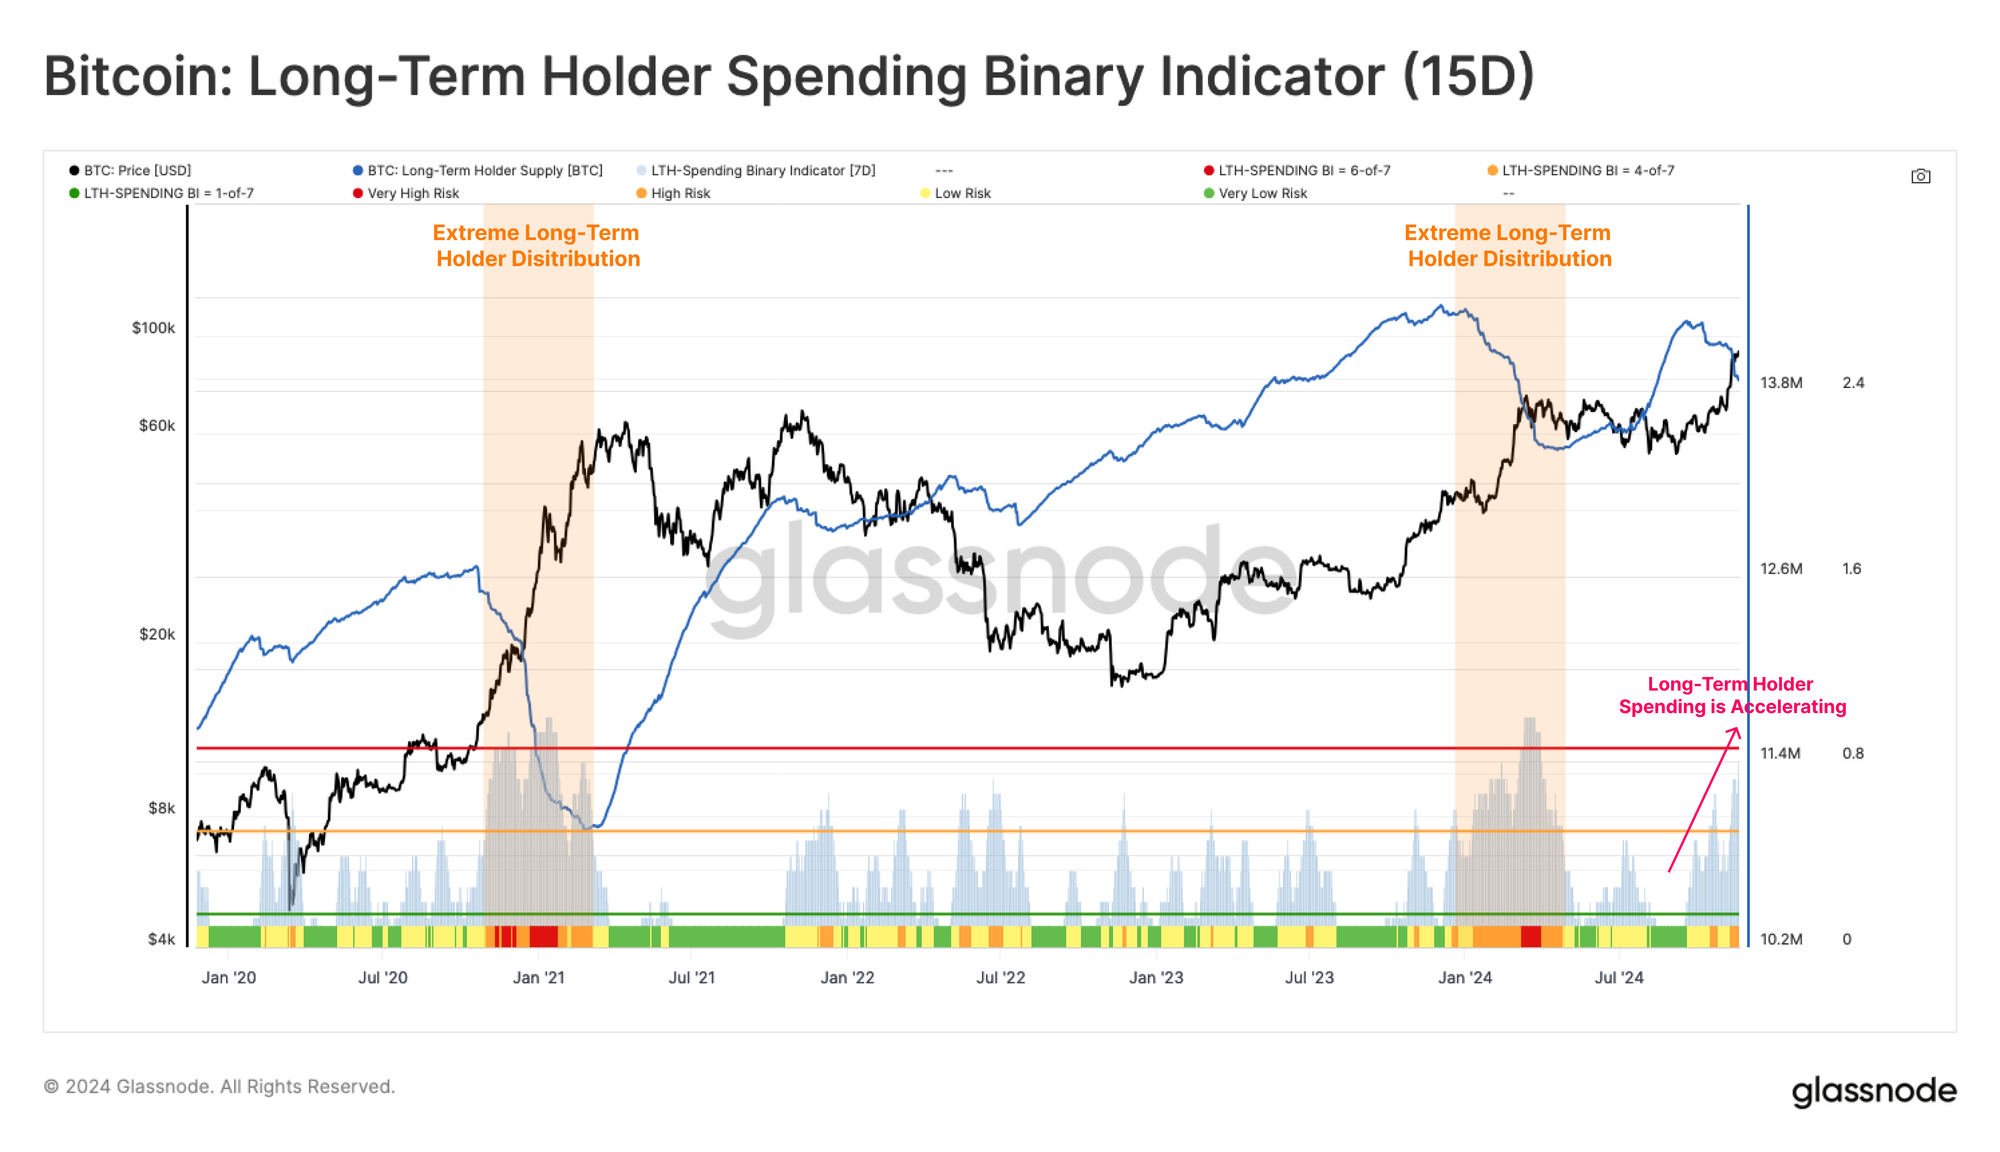
We can employ the Long-Term Holder Spending Binary Indicator to evaluate the intensity of LTH sell-side pressure. This tool assesses the percent of days out of the last two weeks where the cohorts spending exceeds their accumulation, resulting in a net decline in their holdings.
Since early September, as Bitcoin's price gained momentum, long-term holder spending can be seen to steadily increase. With the recent surge to $93k, this indicator reached a value indicating 11 of the last 15 days have seen a LTH balance decline.
This highlights an increase in long-term holder distribution pressure, although it is not yet at the magnitude observed around the March 2021, and March 2024 peaks.
Having identified the elevated spending behaviour by long-term holders, we can consult the next tool for deeper insights into their activity around pivotal market points. The interplay of profit taking, and unrealized profit can help to highlight their role in shaping cycle transitions.
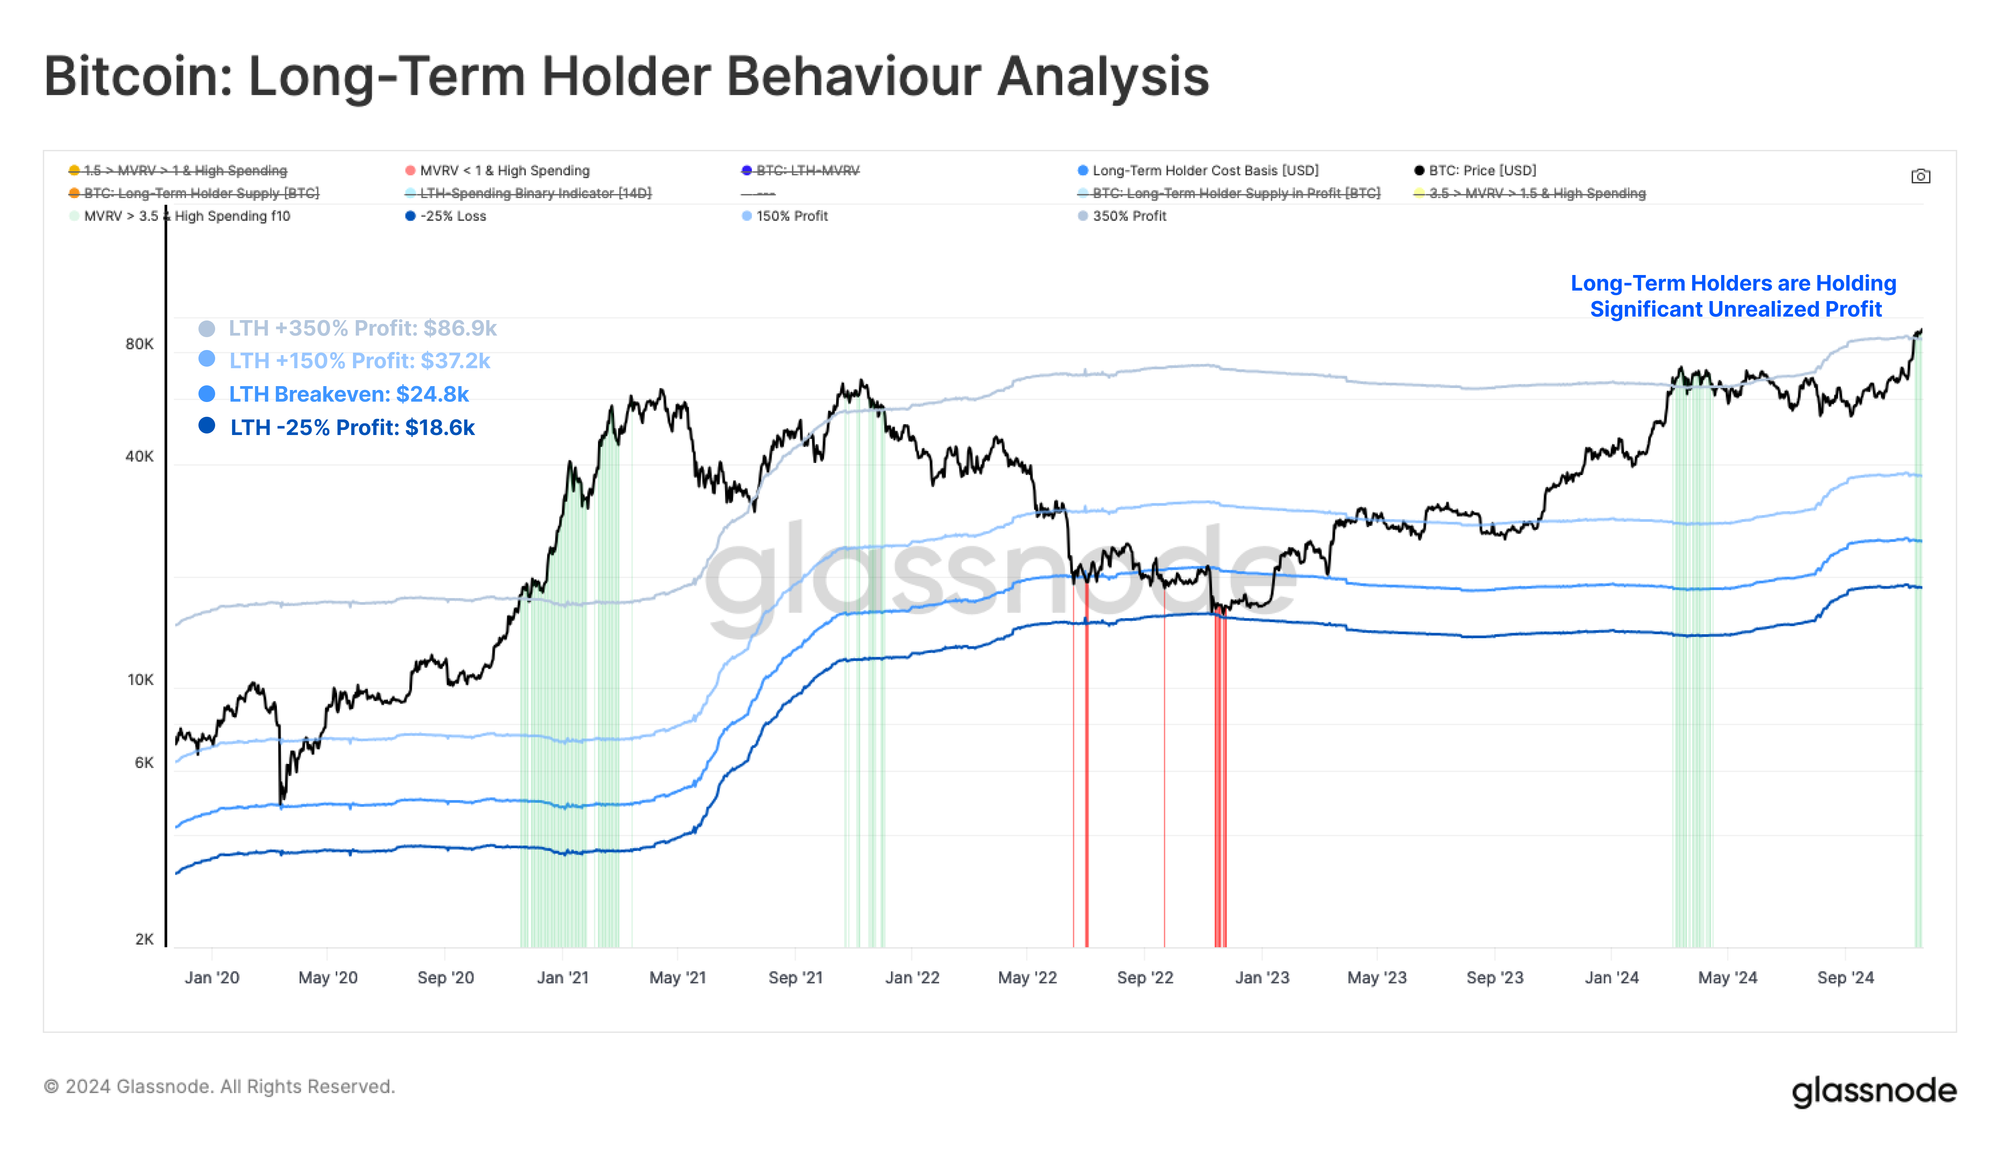
This chart visualizes:
- LTH Realized Price (🔵): The average acquisition price for long-term holders.
- Profit/Loss Pricing Bands (🔵): Bands representing extreme profit (+150%, +350%) and loss (-25%) levels, which often trigger notable spending activity.
- Profit-Taking (🟩): Phases where long-term holders hold over +350% profits and ramp up spending.
- Capitulation (🟥): Periods of high spending by long-term holders in a -25%+ loss state.
Bitcoin’s price has surged past the +350% profit-band (located at $87k), prompting significant profit-taking behaviour amongst this cohort. Distribution pressure is likely to increase as the market rallies, and these unrealized gains expand accordingly. That said, this has historically signalled the start of the most extreme phase of prior bull markets, with unrealized profits growing to over 800% in the 2021 cycle.
Institutional Buyers
We will now turn our attention to the role that institutional buyers have on the market, particularly via the U.S. Spot ETFs. The ETFs have been a major source of demand in recent weeks, absorbing a majority of the sell-side by LTHs. This dynamic also highlights the growing influence of institutional demand in shaping modern Bitcoin market structure.
As outlined in Week on-Chain 46, since mid-October, weekly ETF inflows have surged to between $1B to $2B per week. This represents a significant uptick in institutional demand, and are some of the most significant periods of inflows to date.
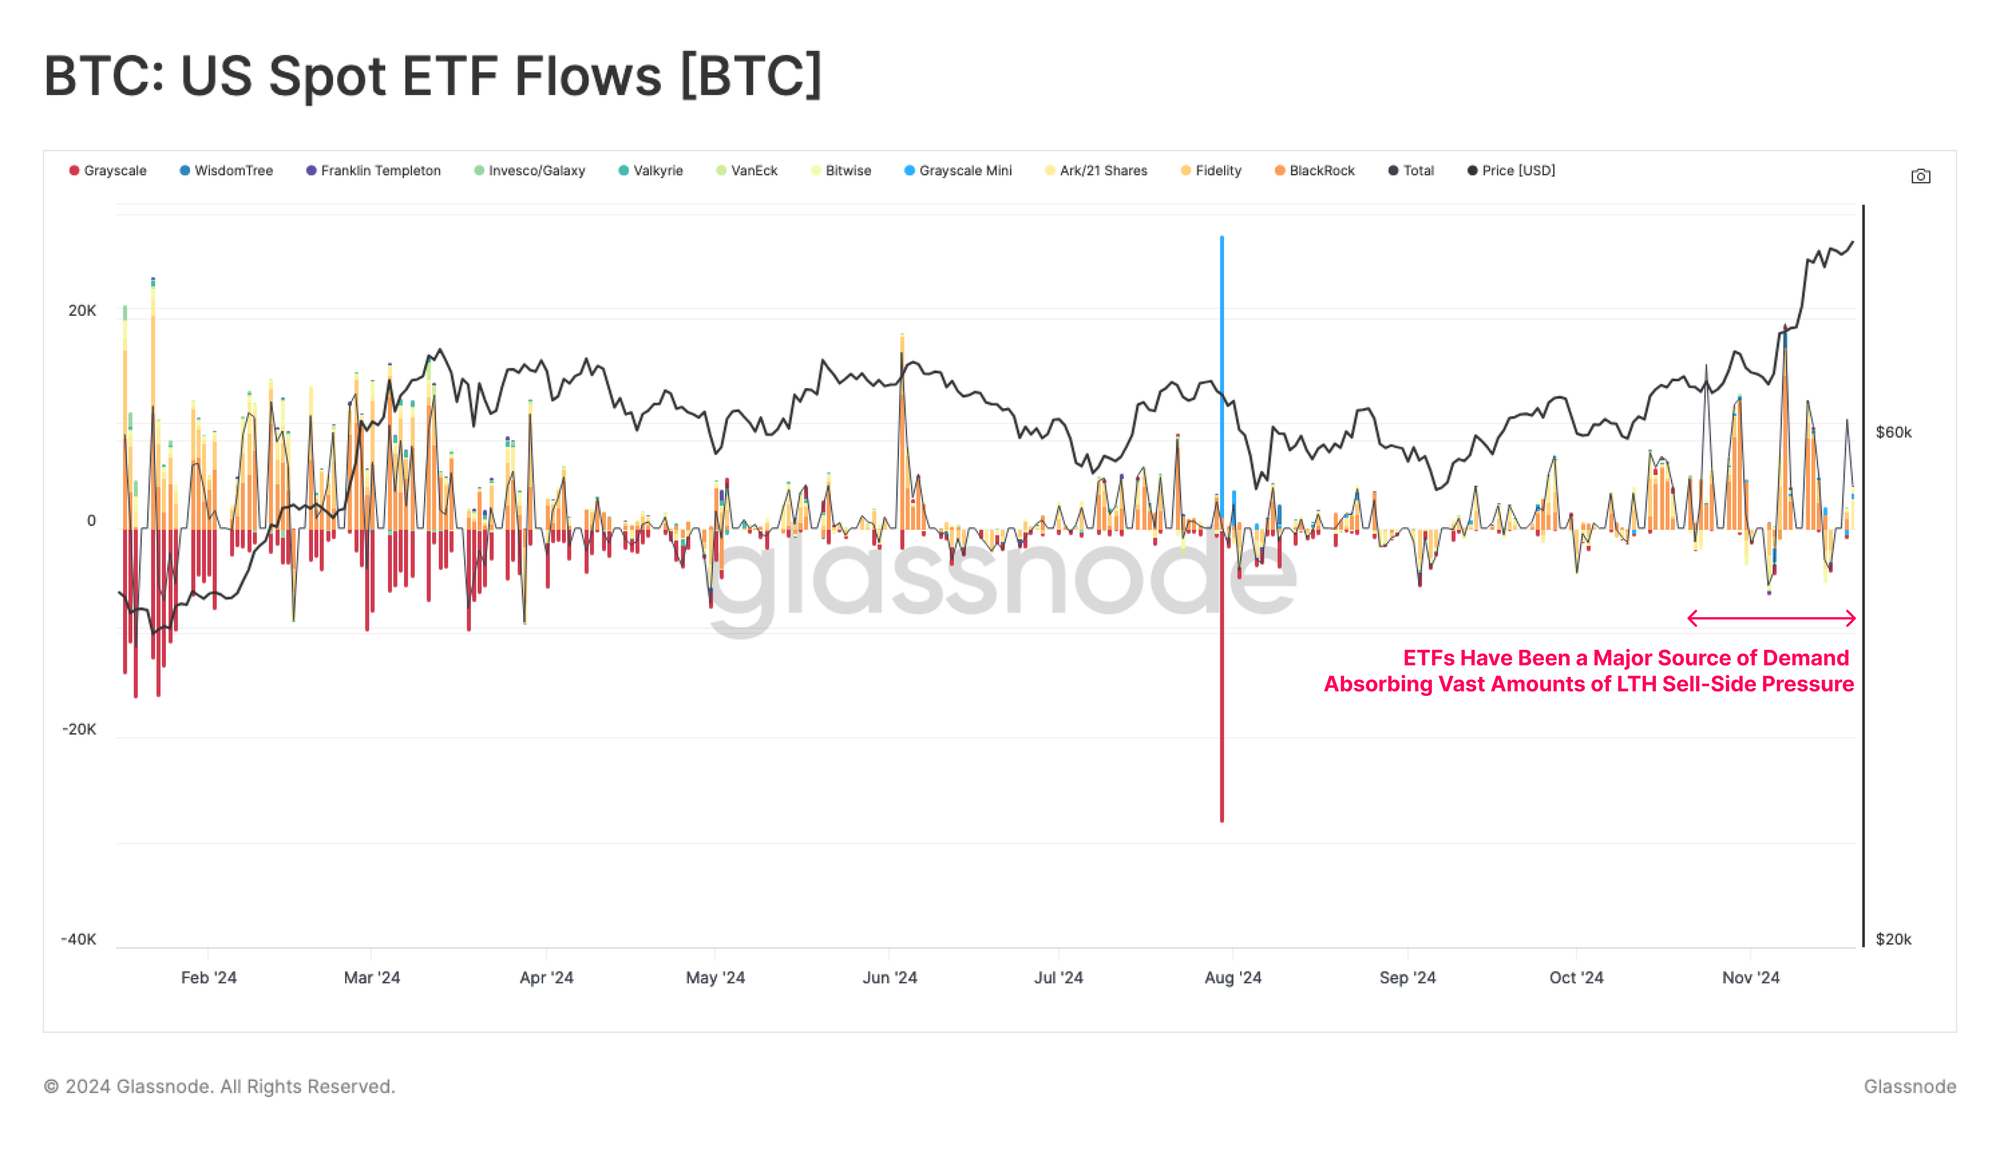
To visualize the counter balancing forces of LTH sell pressure, and ETF demand, we can analyze the 30-day change in the Bitcoin balance of each cohort.
The chart below shows that during the period from 8-October to 13-November, the ETFs absorbed around 128k BTC, which is approximately 93% of the 137k BTC in net selling pressure exerted by LTHs. This highlights the critical role that the ETFs have in stabilizing the market during periods of elevated selling activity.
However, since 13-November, LTH sell-side pressure has begun to outpace ETF net inflows, echoing a pattern observed in late February 2024, where the imbalance between supply and demand led to increased market volatility, and consolidation.

Summary and Conclusion
Bitcoin's rally to $93k has been supported by strong capital inflows, with around $62.9B worth of capital flowing into the digital asset space over the last 30-days. This demand has been led by institutional investors via the U.S. Spot ETFs, perhaps even as capital rotates out of gold and silver.
The ETFs have played a key role, absorbing over 90% of sell-side pressure by Long-Term Holders. However, as unrealized profits reach more extreme levels, we can expect more LTH spending, which in the immediate term has outpaced ETF inflows.
Disclaimer: This report does not provide any investment advice. All data is provided for information and educational purposes only. No investment decision shall be based on the information provided here and you are solely responsible for your own investment decisions.
Exchange balances presented are derived from Glassnode’s comprehensive database of address labels, which are amassed through both officially published exchange information and proprietary clustering algorithms. While we strive to ensure the utmost accuracy in representing exchange balances, it is important to note that these figures might not always encapsulate the entirety of an exchange’s reserves, particularly when exchanges refrain from disclosing their official addresses. We urge users to exercise caution and discretion when utilizing these metrics. Glassnode shall not be held responsible for any discrepancies or potential inaccuracies. Please read our Transparency Notice when using exchange data.
- Join our Telegram channel.
- For on-chain metrics, dashboards, and alerts, visit Glassnode Studio