On-Chain movements show bullish pressure building around Ether (ETH) as its exchange balance hits ATL and Staking deposits continue to grow.
The technical chart shows that Ether (ETH) could rally to $3,000 if buyers can break through the resistance between $1,900 and $2,000.
ETH balances on exchanges hit a new low of 12.6%, a sharp drop over the past 30 days, according to Glassnode data. A decrease in supply on exchanges is usually a bullish sign, as it means there are fewer Token available for sale.
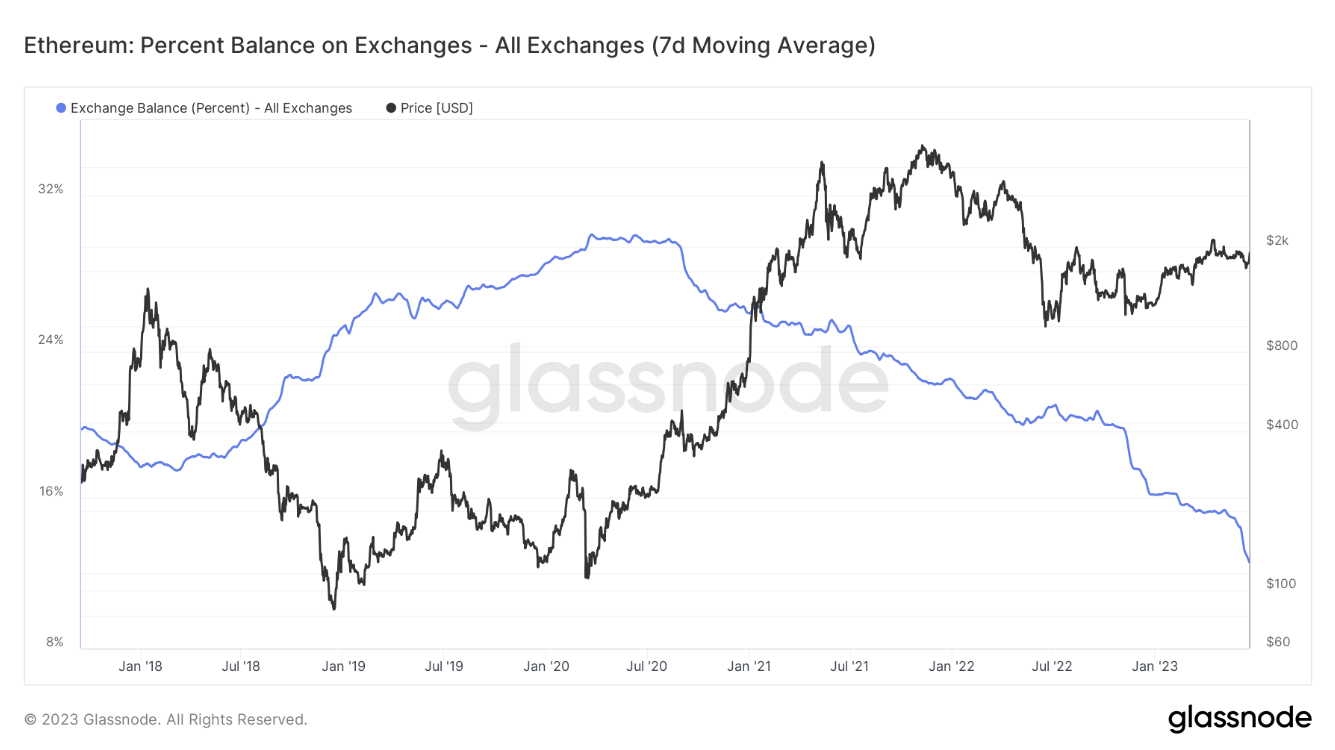
Supply Percentage of ETH on Cryptocurrency Exchanges | Source: Glassnode
Net deposits and withdrawals from exchanges showed a sharp increase in Coin withdrawals in early June amid regulatory crackdowns on Binance and Coinbase.
The data is considered unimportant, as the withdrawals are caused by investors panicking over the potential collapse of centralized exchanges.
However, the level of withdrawals and the bullish action show similarities to the November 2022 levels, when the ETH price increased rapidly by more than 33%.
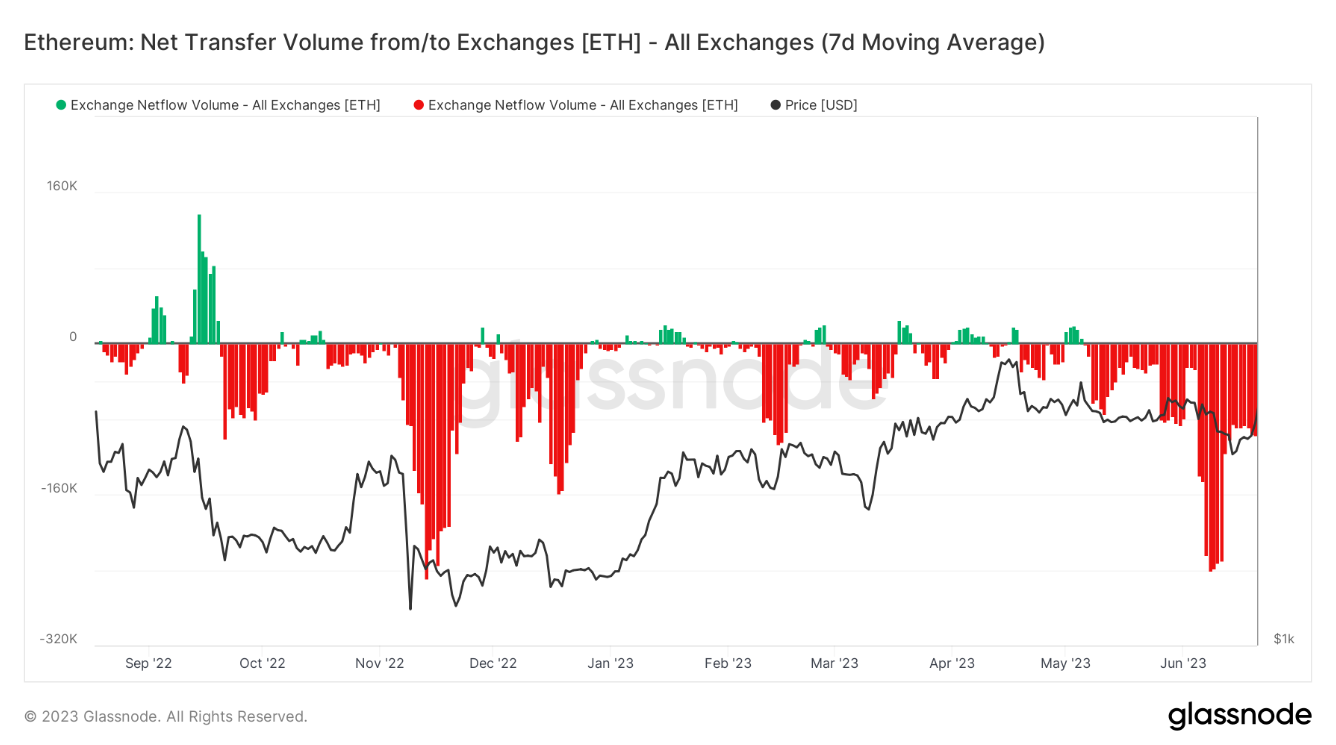
Net ETH deposits and withdrawals from exchanges | Source: Glassnode
At the same time, the supply of ETH locked in Staking contracts has increased dramatically since the Shapella upgrade in April. Currently, over 23 million ETH is deposited in Staking contracts, representing 19.1% of its total supply.
Glassnode data shows that nearly 30% of the ETH supply is locked in smart contracts, including decentralized finance (DeFi) and Staking contracts, up from 25.5% in early 2023.
Increased Coin from exchanges and smart contract deposits is a positive for ETH price, as it reduces the supply of Liquidation.
Ether price broke out above the 50-day moving average at $1,823, creating a bullish breakout.
The ETH/USD pair is currently facing resistance around the horizontal level of $1,906. The pair has been making a higher Dip since November 2022, with $1,900-$2,000 acting as technical and psychological resistance, following an ascending triangle pattern.
A breakout above $2,000 could quickly push ETH towards a 2022 break of around $3,000. The target of the ascending channel pattern also coincides with this level.
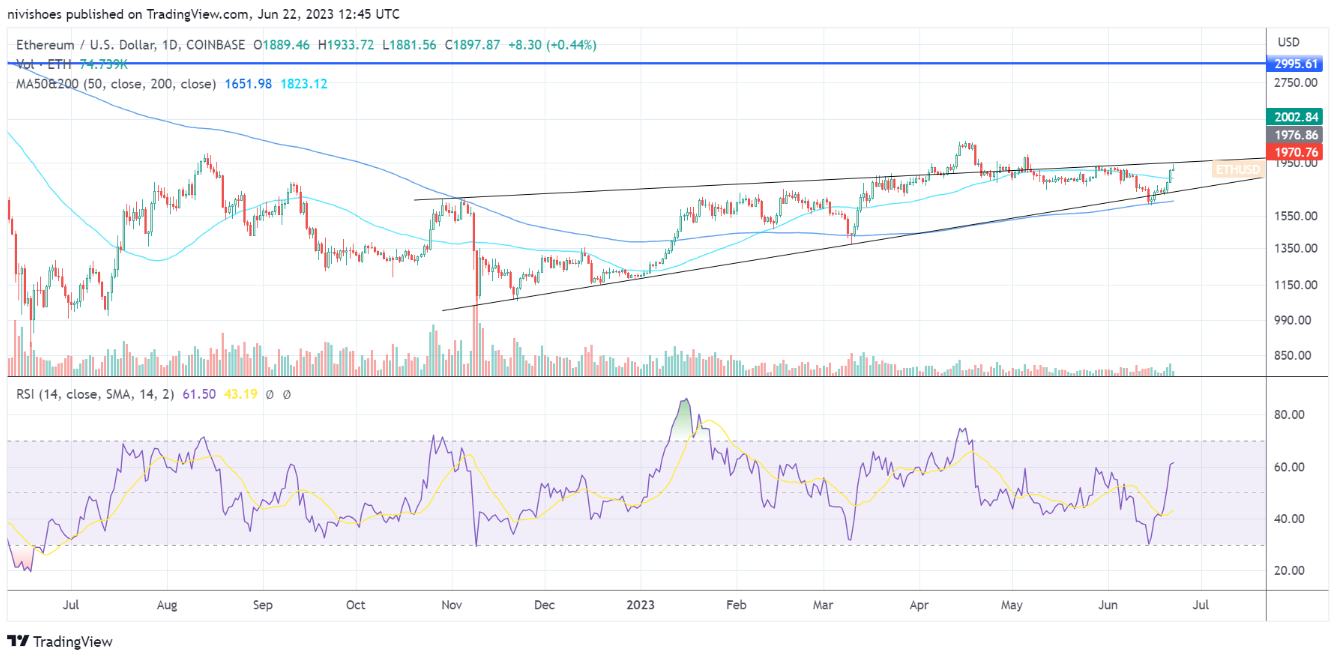
ETH/USDT Daily Chart | Source: TradingView
The ETH/BTC pair is looking to establish support around the 2023 low of 0.06255 BTC. If sellers push the price below this level, the downside target is 0.05689 BTC.
However, the relative strength index is showing an oversold reading for the ETH/BTC pair, suggesting a pullback is likely.
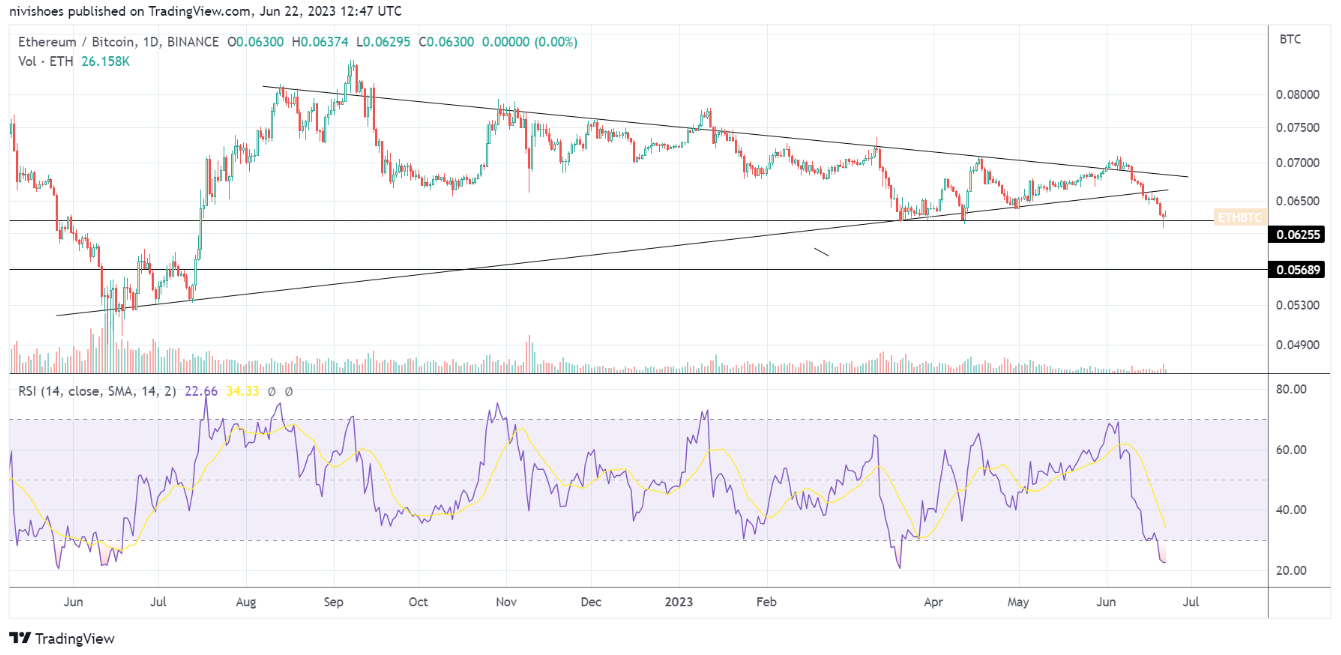
ETH/BTC Daily Chart | Source: TradingView
ETH's funding rate has risen to a monthly high, acting as a warning sign for late buyers.
Traders pay fees for their long or short positions, depending on the demand for the asset. When demand for buy orders exceeds demand for sell orders, Longing orders become more expensive, causing traders to buy to pay traders to sell.
It is likely that the price will return to the Dip of the ascending triangle pattern on the ETH/USD pair around $1,680.
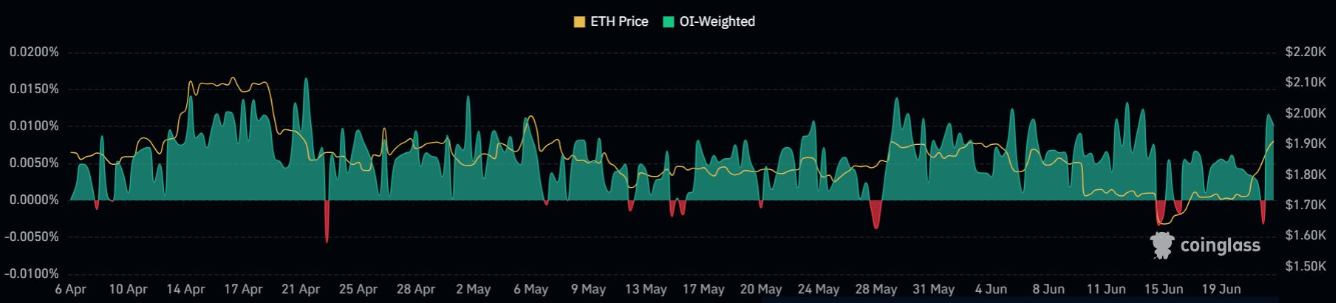
Funding rate of ETH perpetual swap contracts | Source: CoinGlass
However, On-Chain movements and market indicators present a higher upside opportunity for the medium-term trend.
Bitcoin’s price action and the bulls’ ability to hold $30,000 will also play an important role in maintaining Ether’s momentum.