XDC Network (XDC) Tests Its Momentum: Break Free or Face Resistance?

TheNewsCryptoPublié le 2026-03-03Dernière mise à jour le 2026-03-03

Résumé

XDC Network (XDC) has seen a 3.15% price increase, trading around $0.03456 with a market cap of $689.24 million. Daily trading volume rose over 16% to $25.81 million. The price faces resistance near $0.03477, with potential to climb higher, but could also fall to support at $0.03435 if bearish pressure returns. Technical indicators present a mixed outlook. The 4-hour MACD remains in bearish territory but shows signs of a potential bullish crossover. The Chaikin Money Flow indicates slight selling pressure, while the daily RSI at 57.76 suggests moderate bullish conditions with room for further upside. The Bull Bear Power shows a very mild bullish tilt, indicating possible consolidation rather than a strong trend. The overall momentum hinges on whether buyers can sustain control and push the price beyond key resistance levels.

Following a brief bullish call across the crypto charts, some green shades are found within the digital assets’ trading patterns. Will the recent uptick build more momentum and see a steady upside? Bitcoin (BTC) and Ethereum (ETH) are seeking to escape the vast and dominant bear market. Concurrently, XDC Network (XDC) has recorded a 3.15% gain in value.

The asset’s lowest and highest trading ranges fall between $0.03171 and $0.03523, respectively. At the time of writing, XDC Network trades within the $0.03456 zone, with its market cap at $689.24 million. Besides, the daily trading volume of XDC has soared by over 16.19%, reaching the $25.81 million mark, according to CMC data.

If the XDC/USDT trading pair’s price climbs up, it would hit the resistance at around $0.03477. With extended gains, the bulls may gain more strength and drive the asset’s price above the $0.03498. However, the wave of bearish pressure might pull the XDC Network price back to the support at $0.03435. A sturdy downside correction could trigger the mighty bears, and it may lead the price to fall below $0.03414.

Where Is XDC Network’s Momentum Taking It Now?

The 4-hour technical outlook exhibits that both the Moving Average Convergence Divergence and signal lines of XDC Network are below the zero line. It shows the broader trend is bearish. Also, MACD is attempting to cross above zero, and if it succeeds, a transition toward the bullish zone happens.

Moreover, the Chaikin Money Flow indicator resting at -0.01 points to slight selling pressure, with the capital outflow marginally exceeding inflow. Notably, the XDC market is largely balanced. If CMF moves further below, the downtrend strengthens, and a move above zero likely renews the buying interest.

XDC Network’s daily Relative Strength Index (RSI) at 57.76 reflects a moderate bullish condition, with buyers maintaining control. Peculiarly, the asset has enough room for further upside without being overstretched. If the value continues climbing, the bullish momentum could strengthen further.

In addition, the Bull Bear Power (BBP) reading of XDC at 0.00309 displays a very mild bullish tilt. Significantly, the overall pressure remains weak, and it may show a consolidation phase rather than a strong trending move. With the value rising steadily, it would signal the strengthening bullish control.

Top Updated Crypto News

Aptos (APT) Charts Turn Bullish: Is a $1 Surge Loading?

TagsAltcoinCryptocurrencyXDCXDC Network

Cryptos en tendance

Questions liées

QWhat is the current trading price and market capitalization of XDC Network (XDC) as mentioned in the article?

AAt the time of writing, XDC Network trades within the $0.03456 zone, with its market cap at $689.24 million.

QAccording to the 4-hour technical analysis, what does the position of the MACD lines relative to the zero line indicate about the broader trend for XDC?

AThe Moving Average Convergence Divergence (MACD) and signal lines being below the zero line indicates that the broader trend is bearish.

QWhat does the Chaikin Money Flow (CMF) value of -0.01 suggest about the XDC market?

AThe Chaikin Money Flow (CMF) indicator resting at -0.01 points to slight selling pressure, with the capital outflow marginally exceeding inflow, indicating the market is largely balanced.

QWhat is the significance of the daily Relative Strength Index (RSI) reading of 57.76 for XDC?

AThe daily Relative Strength Index (RSI) at 57.76 reflects a moderate bullish condition, with buyers maintaining control and showing there is enough room for further upside without being overstretched.

QWhat are the identified resistance and support levels for the XDC/USDT trading pair in the article?

AThe resistance level is at around $0.03477, and the support level is at $0.03435. A sturdy downside correction could push the price below $0.03414.

Lectures associées

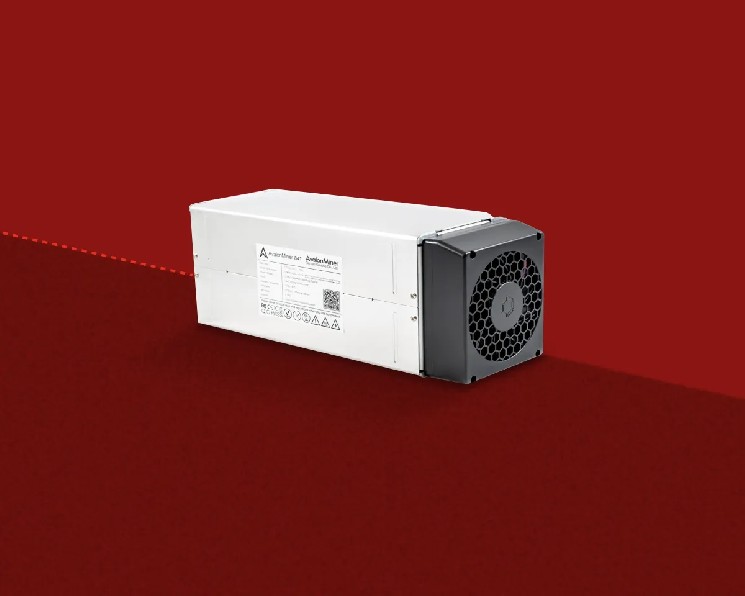
Core Scientific a dépensé 41,9 millions de dollars pour accélérer son retrait du minage de bitcoin

Core Scientific a payé 41,9 millions de dollars pour résilier un contrat d'approvisionnement en puces de minage avec Block (et sa filiale Proto), mettant ainsi fin à ses plans d'expansion dans le minage de Bitcoin. La société réoriente entièrement son activité vers la colocation pour l'intelligence artificielle (IA). Le contrat annulé portait sur des puces de 3 nm représentant une puissance de hachage d'environ 15 EH/s. Core Scientific a déclaré qu'elle n'investirait plus dans de nouveaux équipements de minage et générerait désormais des flux de trésorerie à partir de son parc existant, tout en convertissant ses sites pour l'IA. Au deuxième trimestre 2026, ses revenus provenant de l'IA ont explosé à 136,7 millions de dollars (contre 10,6 millions l'année précédente), représentant 83% de son chiffre d'affaires total. À l'inverse, ses revenus issus de son propre minage ont chuté de 66% à 21,5 millions de dollars. La production trimestrielle de Bitcoin a baissé de 53%. La puissance dédiée à la colocation IA atteignait 437 MW à mi-juillet 2026. CoreWeave est son principal client, représentant environ 77% des revenus sur le premier semestre 2026. Un partenariat significatif avec AMD a également été annoncé, portant sur un potentiel de 2,5 GW de capacité et des revenus contractuels estimés à plus de 14 milliards de dollars. Dans l'ensemble, le chiffre d'affaires du T2 2026 a plus que doublé pour atteindre 164,2 millions de dollars, mais les dépenses en capital ont bondi à 797,5 millions de dollars. Cette transition rapide vers l'IA reflète une tendance plus large dans l'industrie des mineurs de Bitcoin face à la pression sur la rentabilité.

cryptonews.ruIl y a 20 mins

Core Scientific a dépensé 41,9 millions de dollars pour accélérer son retrait du minage de bitcoin

cryptonews.ruIl y a 20 mins

Prévision du prix de Cardano : +800 % ou un nouveau pas vers le bas — Quel analyste comprend correctement l'ADA ?

Cardano (ADA) s'échange à 0,1643 $ le 29 juillet, après avoir rebondi depuis une zone de déséquilibre (FVG) autour de 0,1450-0,1515$. Les niveaux de résistance immédiats sont les moyennes mobiles à 0,1654$ (20 jours) et 0,1737$ (50 jours), tandis que les supports se situent à 0,1563$ et 0,1513$. Deux analyses s'opposent. Cheeky Crypto estime que les prix actuels constituent une opportunité générationnelle, citant l'accumulation par les "baleines" lors du récent recul et les fondamentaux techniques de Cardano, avec un objectif haussier à long terme de +800%. À l'inverse, LuckSide Crypto attribue la récente baisse de 6,27% à des tensions géopolitiques (Iran) et surtout au report au Sénat américain du vote sur le "CLARITY Act", une loi cruciale pour la clarté réglementaire, retardant ainsi les espoirs d'ETF spot pour l'ADA. Par ailleurs, l'offre de stablecoins sur Cardano a triplé en un an pour dépasser 55 millions de dollars, et un nouveau partenariat avec Reef Data a été annoncé pour des flux de paiement. En résumé, le scénario haussier dépend du maintien du rebond, de la stabilité des taux de la Fed et d'une avancée législative rapide. Le scénario baissier prévaut si le rebond échoue, que les tensions géopolitiques persistent et que le projet de loi continue de stagner, poussant l'ADA vers 0,1563$ voire 0,1513$.

cryptonews.ruIl y a 53 mins

Prévision du prix de Cardano : +800 % ou un nouveau pas vers le bas — Quel analyste comprend correctement l'ADA ?

cryptonews.ruIl y a 53 mins

Trading

Spot

Articles tendance

Comment acheter XDC

Bienvenue sur HTX.com ! Nous vous permettons d'acheter XDC Network (XDC) de manière simple et pratique. Suivez notre guide étape par étape pour commencer votre parcours crypto.Étape 1 : Création de votre compte HTXUtilisez votre adresse e-mail ou votre numéro de téléphone pour ouvrir un compte sur HTX gratuitement. L'inscription se fait en toute simplicité et débloque toutes les fonctionnalités.Créer mon compteÉtape 2 : Choix du mode de paiement (rubrique Acheter des cryptosCarte de crédit/débit : utilisez votre carte Visa ou Mastercard pour acheter instantanément XDC Network (XDC).Solde :utilisez les fonds du solde de votre compte HTX pour trader en toute simplicité.Prestataire tiers :pour accroître la commodité d'utilisation, nous avons ajouté des modes de paiement populaires tels que Google Pay et Apple Pay.P2P :tradez directement avec d'autres utilisateurs sur HTX.OTC (de gré à gré) : nous offrons des services personnalisés et des taux de change compétitifs aux traders.Étape 3 : stockage de vos XDC Network (XDC)Après avoir acheté vos XDC Network (XDC), stockez-les sur votre compte HTX. Vous pouvez également les envoyer ailleurs via un transfert sur la blockchain ou les utiliser pour trader d'autres cryptos.Étape 4 : tradez des XDC Network (XDC)Tradez facilement XDC Network (XDC) sur le marché Spot de HTX. Il vous suffit d'accéder à votre compte, de sélectionner la paire de trading, d'exécuter vos trades et de les suivre en temps réel. Nous offrons une expérience conviviale aux débutants comme aux traders chevronnés.

436 vues totalesPublié le 2024.12.12Mis à jour le 2026.06.02

Comment acheter XDC

Discussions

Bienvenue dans la Communauté HTX. Ici, vous pouvez vous tenir informé(e) des derniers développements de la plateforme et accéder à des analyses de marché professionnelles. Les opinions des utilisateurs sur le prix de XDC (XDC) sont présentées ci-dessous.

活动图片