Earning Millions Daily in a Sluggish Market: Is Pump.fun's Revenue Real?

marsbitPublicado a 2026-03-21Actualizado a 2026-03-21

Resumen

Despite a perceived market downturn, pump.fun remains a top revenue-generating crypto-native application, ranking fourth in earnings behind only Tether, Circle, and Hyperliquid across various timeframes. Its daily income consistently exceeds one million USD, derived from three primary sources: a 0.95% protocol fee on bonding curve transactions, a token’s "graduation" fees on Pumpswap, and revenue from its acquired multi-chain trading platform, Terminal (formerly Padre). On-chain analysis confirms the bonding curve revenue is authentic, with no evidence of fake transfers or data manipulation. However, questions arise about the organic nature of this activity. While Solana’s daily active addresses range between 1.2-2.2 million, pump.fun sees about 150,000, with roughly 30,000 new tokens deployed daily. Data suggests a significant portion of tokens are launched by a small group of sophisticated deployers, not organic users. Moreover, research indicates that 98.6% of tokens on pump.fun are pump-and-dump schemes, turning the platform into a low-cost, high-efficiency "casino" where deployers profit at the expense of retail investors. Despite pump.fun using nearly all its income to buy back its native token, $PUMP, the price continues to fall due to a lack of buyer confidence and organic demand. The fundamental issue is not revenue authenticity but the platform's role in facilitating a predatory ecosystem, making it unattractive to long-term institutional investment.

Author: BlockBeats

"What other crypto-native applications can still make money?"

When it comes to this question, you might instinctively think—stablecoins, CEXs, Perp DEXs, on-chain Pokémon cards...

And pump.fun, this application that was once infinitely glorious during the meme frenzy and created one of the largest IPOs in cryptocurrency history, is starting to be easily forgotten. Even in some conversations, I heard questions like:

"Is pump.fun still alive? Can they still make money?"

pump.fun not only can still make money, but it remains a top-tier "money printer" among crypto-native applications. Statistics on DefiLlama show that across any time frame—24 hours, 7 days, 30 days, or 1 year—pump.fun's revenue is firmly in 4th place, only behind Tether, Circle, and Hyperliquid.
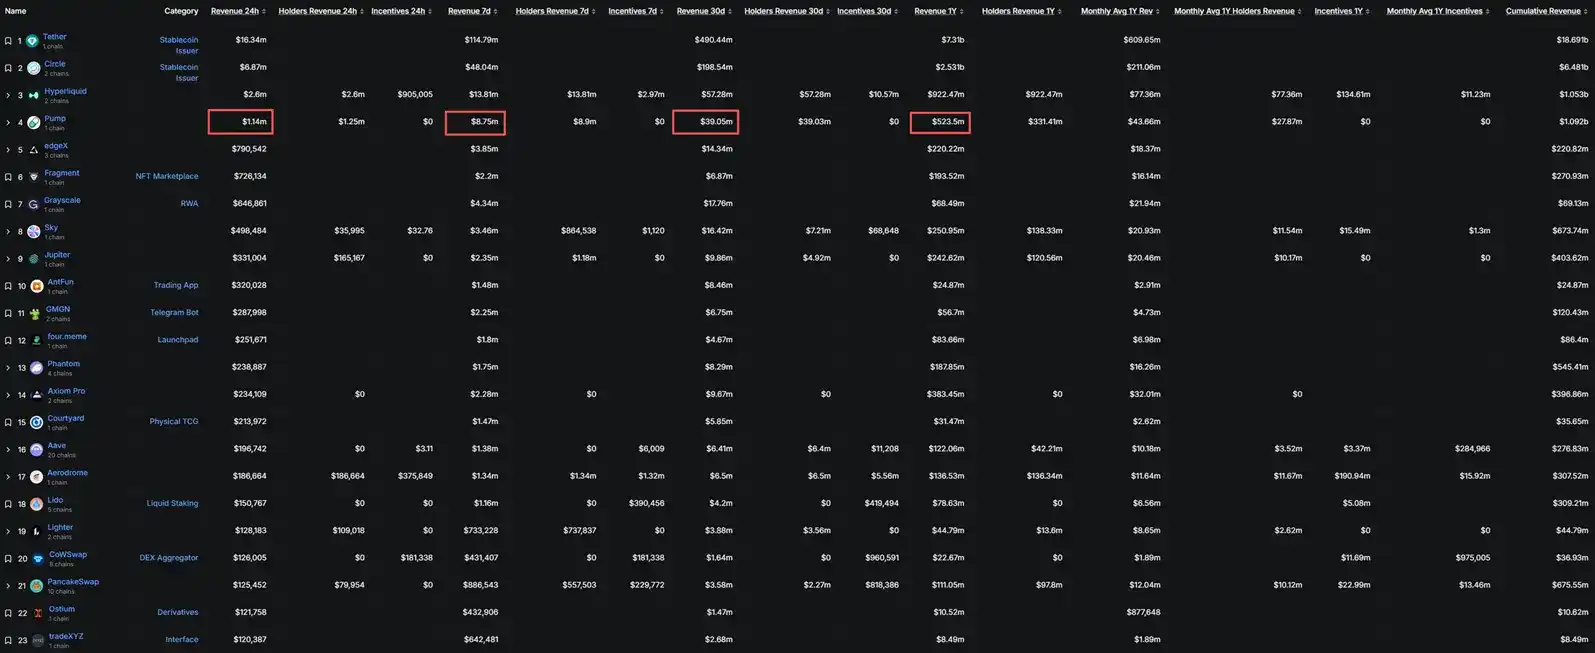
Although various "dog coin hunting" chat groups are冷冷清清, many with not a single message for days, pump.fun's average revenue over the past 7 or 30 days still exceeds one million dollars per day.

Is this real revenue, or is pump.fun faking it?

Is pump.fun's revenue real?

First, according to pump.fun's official revenue dashboard, its current revenue consists of three parts:

- Bonding curve revenue: Transaction fee income before a new token "graduates." pump.fun charges a 0.95% protocol fee on these transactions.

- Pumpswap revenue: For new tokens that have successfully graduated (migrated to the Pumpswap AMM for trading), a 0.93% protocol fee is charged on transactions for tokens with a market cap of 0-420 SOL.

- Terminal (Padre) revenue: pump.fun acquired the trading terminal Padre in October last year and rebranded it as the multi-chain trading platform Terminal. Revenue from this trading platform is now also counted as pump.fun revenue.

- Revenue is net of referral rebates and trading cashback.

For protocol revenue from the bonding curve phase, the Solana address used by pump.fun official to receive this portion of revenue is CebN5WGQ4jvEPvsVU4EoHEpgzq1VV7AbicfhtW4xC9iM. The bonding curve revenue aggregated to this address is hardcoded into the contract. If fake revenue were being created by externally transferring funds to this address, there would necessarily be external addresses directly calling the System Program's Transfer instruction. After analyzing the transactions for this address, we found no evidence of any伪造收入的行为 through simple, external SOL transfers.

This means that the bonding curve revenue确实完全来自于真实合约调用的协议手续费抽成。

DefiLlama's pump.fun bonding curve revenue data is obtained by directly calling pump.fun's official API, which is why we first conducted an on-chain analysis of pump.fun's official bonding curve revenue address. However, DefiLlama's calculations for Pumpswap and Terminal (Padre) revenue are done through Dune SQL queries of on-chain Solana data,完全不依赖 pump.fun 官方的 API,具有极高的链上客观性和不可篡改性。

At this point, we have ruled out the suspicion that pump.fun is faking revenue through "external transfers" or "falsifying data" in a simple and crude manner. However, the possibility remains that they could be generating fake revenue through "wash trading" using bots or internal wallets. Therefore, we must ask further—given the current overall sluggish state of the cryptocurrency market, with meme coin热度更是大幅退潮, is pump.fun's revenue real and organic?

The reasonableness of pump.fun's revenue in the current market environment?

According to data on Token Terminal, during the first quarter of this year, the daily active address count on Solana stabilized between 1.2 million and 2.2 million, while on pump.fun it was approximately 150,000.

Simultaneously, according to data from Dune's pump.fun related statistical dashboard, these 150,000 addresses correspond to approximately 30,000 new token deployments per day.

This means that if all 30,000 new tokens per day were deployed spontaneously by different real users, then about 20% of pump.fun's active users are launching new coins every day. However, according to a paper titled "Predicting the success of new crypto-tokens: the Pump.fun case" published last month by Giulio Marino et al., from September 1, 2025, to October 1, 2025, a total of 655,770 new tokens were deployed on pump.fun, yet the number of addresses deploying tokens was only 243,123.
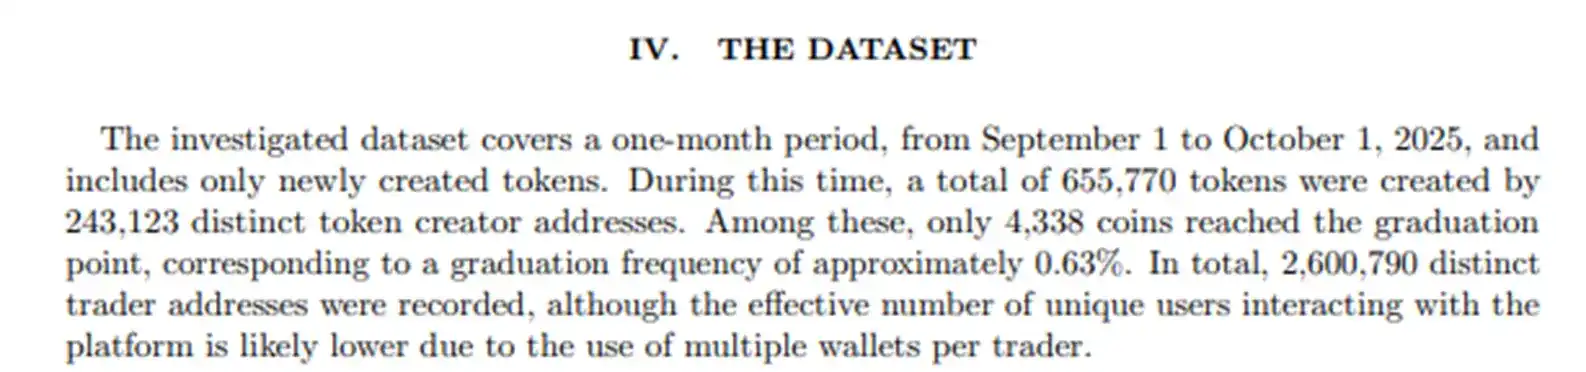
And the current daily number of token deployments is even higher than last September:

Combined with the current market environment, this data is somewhat "counter-intuitive"—on social media, it feels like cryptocurrency is almost finished, yet on pump.fun, so many new tokens are still being deployed every day. Also, the number of active addresses over the past month is about 10% higher than last September.

In pump.fun's daily million-dollar revenue, Pumpswap and Terminal (Padre) still account for a relatively "small portion." Taking the data from March 18 as an example, the revenue from Pumpswap and Terminal (Padre) on that day was approximately $284,000 and $58,000 respectively, while the revenue from the bonding curve was about $795,000, roughly 2.3 times the sum of the former two.

The new token graduation rate has recently even reached more than twice that of last September:
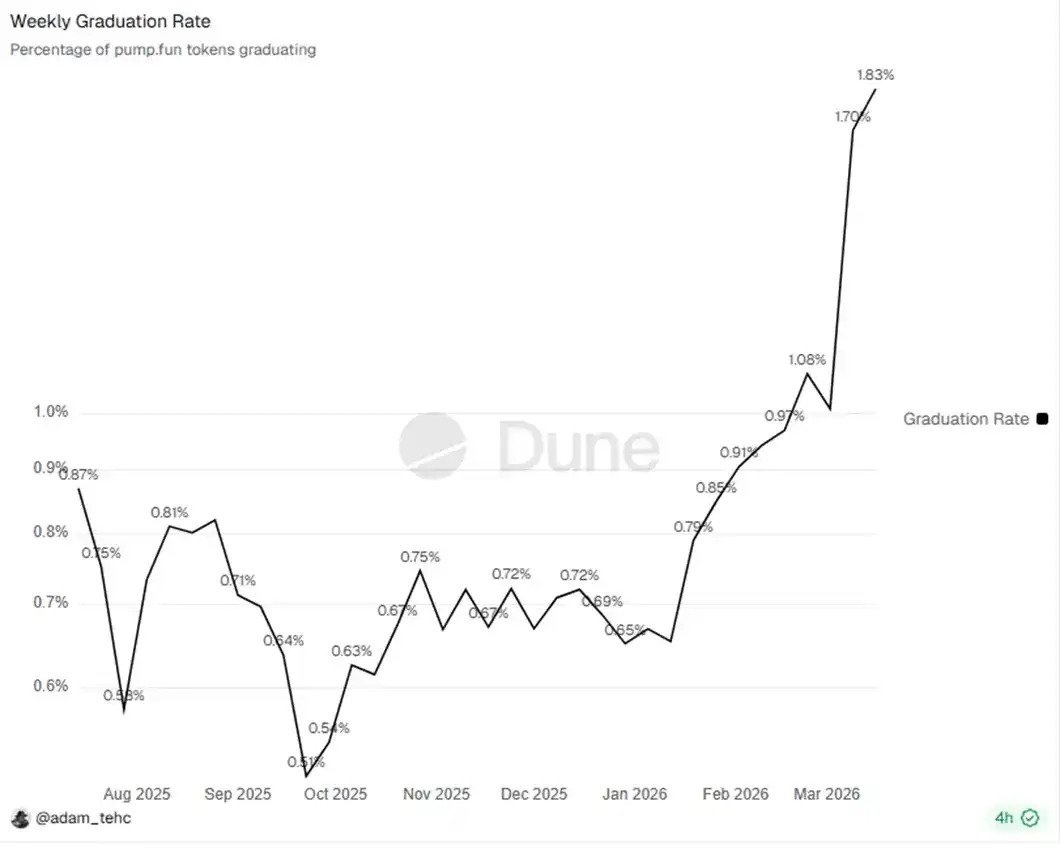
Simultaneously, approximately 26,000 new tokens were deployed on pump.fun that day. To achieve $795,000 in bonding curve revenue, a bonding curve trading volume of $795,000 / 0.95% (the protocol fee rate charged by the bonding curve) ≈ $83,684,200 is required. Averaged across each newly deployed token, each newly deployed token needs to contribute an average of about $3,218 in trading volume before successfully graduating.

If we combine the above data, an average of just over $3,000 in trading volume per new token doesn't sound that difficult; in fact, it seems quite normal, because even in September of last year, when the data was全面落后, pump.fun was still able to achieve this goal. If calculated in SOL terms, they are earning more SOL now than in September last year, it's just that the USD-denominated revenue has decreased.

But at this point, we still have questions: Since last August, pump.fun has been using almost its entire daily revenue to回购 $PUMP. To date, they have repurchased over 10% of the total supply and over 30% of the current circulating supply of $PUMP. Why then does the price of $PUMP keep falling? Although on-chain data shows that the repurchased $PUMP, worth over $300 million, remains untouched in wallets, could it be that they are creating fake revenue through wash trading, "repurchasing" on one hand while secretly selling off through分散的地址?

Where did the $PUMP go?

Let's look at the $PUMP token release schedule:
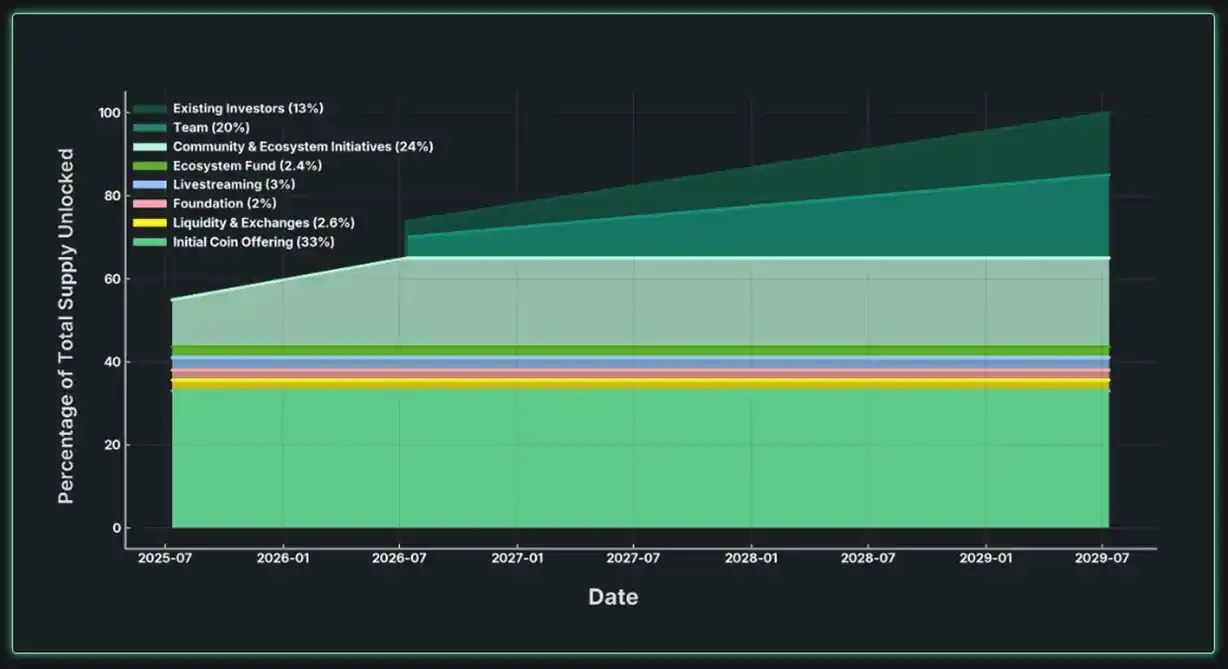
So far, the circulation of $PUMP is as follows:

- ICO: 33%, fully unlocked at TGE.

- Team: 20%, still locked.

- Investors: 13%, still locked.

- LP and Exchanges: 2.6%, fully unlocked at TGE.

- Ecosystem Fund: 2.4%, fully unlocked at TGE.

- Live Streaming Support: 3%, fully unlocked at TGE.

- Foundation: 2%, fully unlocked at TGE.

- Community and Ecosystem Incentives: 24%, approximately 50% unlocked at TGE, the remaining portion unlocks linearly over 1 year. Currently, 65.27% of this portion has been unlocked.

The $PUMP multi-sig custodial wallet with the address Cfq1ts1iFr1eUWWBm8eFxUzm5R3YA3UvMZznwiShbgZt currently holds approximately 36.5% of the total supply of $PUMP.

This does not match the $PUMP token release schedule. What we can明确的是 is that after TGE, all $PUMP was transferred to the multi-sig custodial wallet for distribution. The theoretical maximum transferable amount is only about 58.67% of the total supply (ICO 33% + LP and Exchanges 2.6% + Ecosystem Fund 2.4% + Live Streaming Support 3% + Foundation 2% + Community and Ecosystem Incentives unlocked portion ~15.67%). The $PUMP balance in the multi-sig custodial wallet should not be lower than approximately 41.33%. The difference is about 4.83%.

Where did this 4.83% go? We don't know. We don't even know where the $PUMP for the other parts, which have clearly defined用途 in the description, are located beyond the ICO sale distribution. Although by comparing on-chain data, we did find that approximately 24% of the total supply of $PUMP was transferred in large amounts to various addresses and has remained silent ever since, roughly corresponding to the portions other than the ICO sale distribution, pump.fun official has never disclosed the storage addresses corresponding to the funds for each part of the wallet.

Especially for the community and ecosystem incentives part, the only community and ecosystem incentive activities we can publicly know about are大概只有 the Glass Full Foundation (which bought approximately $1.7 million worth of meme coins within the pump.fun ecosystem), grants of $10,000 each to 6 meme coin communities (totaling $60,000), and a hackathon that funded 12 projects with $25,000 each (totaling $300,000 promised but only 6 winners announced so far).

And yet, this part is already the most clear...

But even with this transparency issue, even if the 4.83% was secretly sold off, pump.fun official's large-scale repurchase of over 10% of the total supply and over 30% of the current circulating supply should be able to offset this selling pressure. Why then is the price performance of $PUMP still languishing?

A possible reason is that $PUMP truly lacks sufficient buy-side demand. In the face of a lack of market recognition, even large-scale repurchases are like mud牛入海 (a Chinese idiom meaning something disappears without a trace).

The Unrecognized "Casino"

When talking about Hyperliquid, we affirm its leading position in Perp DEX and narrative potential. But for pump.fun's meme coin track, even retail investors mostly consider it a scam, unsustainable.

In the earlier part of the article, we acknowledged the authenticity of pump.fun's revenue. Now we need to look at some other data. This data can show that the poor perception of meme coins is not just simple感性厌恶 from retail investors experiencing the剧烈波动 of meme coins, but also creates理性抗拒 among institutional investors.

As early as last April, research by Medallion Analytics showed that over a 180-day statistical period, among approximately 178,000 deployers who launched multiple tokens, 85.3% of them were profitable. Within 180 days, these deployers launched a total of approximately 3.59 million tokens, and the profitable deployers launched about 3.07 million of them, a proportion of about 85.5%.

During the statistical period, the top 10 profitable deployers profited approximately 365,000 SOL, while the 10中等 deployers in terms of profitability could only profit 47.3 SOL, a difference of about 7720 times. For the top deployers, the average interval between new token issuances was only 0.11 hours, while for medium deployers it was as long as 10.96 hours.

Solidus Labs studied the performance of newly deployed tokens on pump.fun between January 2024 and March 2025. The analysis pointed out that a staggering 98.6% of the tokens were pump-and-dump scams.
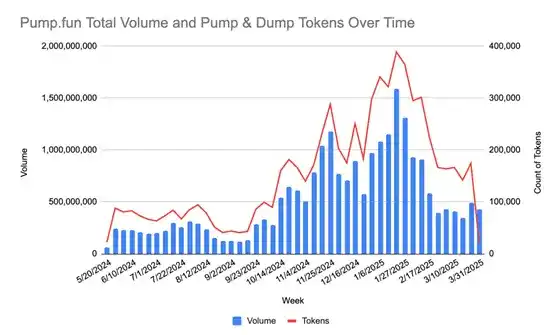
Meme coin issuance has long ceased to be a competition of creativity, but an assembly line for issuing coins and profiting. Top deployers, after making extremely short-cycle rapid profits, can then invest funds into facilities related to automatic coin issuance, making their harvesting speed even faster.

pump.fun has driven the cost of issuing new meme coins on Solana down to $2 or even less, which is indeed a technological advancement. However, they have not guided the meme coin track towards a benign development direction, making retail and institutional investors believe that meme coins are indeed a cultural or even belief-based asset. They tried to broaden the track to直播币, ICM coins, and recently AI Agent coins, but none of these attempts have been successful.

The data is there. The money they make the most is still earned by providing "low-cost harvesting tools," just like a casino taking a cut.

For pump.fun, deployers earn a risk-free 0.95% return for every new coin they issue and for every bit of fake volume they wash trade before the token graduates. If you want your token to get more exposure, you need to wash trade even more volume, providing pump.fun with even more revenue. The funds in this ecosystem are real, the revenue is real, but the ecosystem itself is non-organic, and retail investors are hurt. For institutional investors, such an ecosystem lacks a healthy, sustainable long-term foundation, which is perhaps the fundamental reason for pump.fun's depressed token price.

In the end, we have one more question:

Since pump.fun's repurchases cannot boost the token price, wouldn't using the daily revenue for staking rewards be better than the current repurchase strategy?

Maybe, or maybe they just don't care anymore.

Preguntas relacionadas

QIs pump.fun's daily revenue of over a million dollars real, and how is it verified?

AYes, pump.fun's revenue is real and verified through on-chain analysis. The bonding curve revenue is collected via a smart contract address with no external SOL transfers, and the Pumpswap and Terminal(Padre) revenues are calculated from immutable Solana on-chain data via Dune SQL, independent of pump.fun's API.

QWhat are the main sources of pump.fun's revenue?

Apump.fun's revenue comes from three main sources: 0.95% protocol fees from bonding curve transactions before a token graduates, 0.93% protocol fees from trades of graduated tokens on Pumpswap (for tokens with a market cap of 0-420 SOL), and revenue from the Terminal (formerly Padre) multi-chain trading platform acquired in October.

QWhy is the price of $PUMP token performing poorly despite significant buybacks?

AThe $PUMP token price remains low primarily due to a lack of buy-side demand and market recognition. Despite the team buying back over 10% of the total supply (over 30% of the circulating supply), the ecosystem is seen as a non-organic 'casino' for meme coin scams, which discourages institutional and long-term investor interest.

QWhat does the data say about the legitimacy and success rate of tokens launched on pump.fun?

AData from Solidus Labs indicates that 98.6% of tokens launched on pump.fun from January 2024 to March 2025 were pump-and-dump scams. While a small percentage of deployers (largely automated, top-tier ones) are highly profitable, the vast majority of tokens are designed for rapid, short-term exploitation rather than genuine community or cultural value.

QHow does the current activity and token deployment on pump.fun compare to market sentiment?

ADespite a bearish overall market sentiment, on-chain data shows that pump.fun's activity has increased. Daily active addresses are up about 10% compared to September, with approximately 30,000 new tokens deployed daily. However, this high volume is largely driven by automated, profit-focused deployers rather than organic user growth, creating a disparity between on-chain metrics and negative public perception.

Lecturas Relacionadas

STAR 50 Soars 10.73%, Why Did A-Shares Stage a "V-Shaped Reversal"?

After a prolonged decline, the Chinese A-share market staged a strong rally on July 21. The STAR 50 index surged 10.73%, its largest single-day gain in nearly a year, leading a broad-based "V-shaped" reversal. The Shanghai Composite Index rose 1.79%, the Shenzhen Component Index gained 4.81%, and the ChiNext Index jumped 7.05%. Total market turnover reached 2.97 trillion yuan, an increase of 256.1 billion yuan from the previous session, with over 3,100 stocks advancing. The semiconductor sector spearheaded the rebound, with related ETFs posting significant gains. Analysts attribute the surge to three converging factors. First, coordinated capital inflows from "national team" institutions, insurance funds, listed company buybacks, and fund house self-purchases have bolstered market liquidity and confidence. Second, supportive policy signals, including commitments from regulators to ensure stable market operations, provided a favorable backdrop. Third, a stabilization and recovery in overseas markets, notably South Korea, created a positive external environment. Institutions suggest the most severe panic selling phase for the tech sector has likely passed, following a significant digestion of crowded positions and leveraged funds. While short-term volatility may persist, the medium to long-term outlook remains underpinned by enduring trends like AI computing demand expansion and semiconductor localization. The market's focus now shifts to the sustainability of supportive fund flows, earnings reports, and upcoming catalysts from the global AI industry chain.

marsbitHace 30 min(s)

STAR 50 Soars 10.73%, Why Did A-Shares Stage a "V-Shaped Reversal"?

marsbitHace 30 min(s)

U.S. Tech Momentum Stocks Post Largest Single-Day Gain Ever, But Is the Plunge Over?

US tech momentum stocks staged a sharp rebound on Tuesday (July 21st). Morgan Stanley's TMT Momentum Factor surged over 12%, marking its largest single-day gain on record, exceeding even peaks from the 2000 dot-com bubble. Key momentum indices from Goldman Sachs also posted their strongest daily performances in years. The rally was led by semiconductors, with the Philadelphia Semiconductor Index jumping 4.6%. This rebound followed three consecutive down days and a cumulative 33% plunge in momentum stocks, one of the steepest drawdowns since the dot-com era. Analysts attribute the surge largely to a short squeeze. Heavy selling had pushed high-beta momentum stocks into deeply oversold territory, forcing many short sellers, particularly in Asia, to cover their positions, creating a self-reinforcing buying spiral. However, the rebound's internals appear weak. Trading volume was notably low, and advancing stocks still lagged decliners on the S&P 500, indicating a narrow, concentrated rally rather than broad market participation. Diverging views emerge on the outlook. BTIG warns the bounce has hit key resistance and recommends selling into strength, citing extreme volatility and historical parallels to past market tops. Conversely, Goldman Sachs and UBS believe the momentum unwind is nearing its end, suggesting it may be time to gradually add exposure, as positioning has been significantly reduced. They caution, however, that high volatility warrants a measured approach, potentially using defined-risk strategies. The upcoming earnings season, particularly reports from major tech firms like Alphabet, is seen as a critical test for the rally's sustainability. Simultaneously, bond markets flashed a warning, with yields rising partly due to spiking oil prices. Analysts note that if long-term Treasury yields break decisively higher, it could pose a significant headwind for equities, especially growth stocks.

marsbitHace 38 min(s)

U.S. Tech Momentum Stocks Post Largest Single-Day Gain Ever, But Is the Plunge Over?

marsbitHace 38 min(s)

U.S. Tech Momentum Stocks Record Largest Single-Day Gain Ever, but Has the Rout Ended?

U.S. tech momentum stocks staged a dramatic rebound on Tuesday, July 21st. Key momentum indices like the Morgan Stanley TMT Momentum Factor and Goldman Sachs' High Beta Momentum Long Index posted historic or near-historic single-day gains, fueled largely by semiconductor stocks. This sharp rally followed a severe three-day sell-off that saw momentum stocks plunge 33%, marking one of the steepest pullbacks since the dot-com bubble. Analysts attribute the bounce primarily to a short squeeze, as forced covering from over-leveraged traders, particularly in Asia, created a buying spiral. However, the rally's health is questioned due to weak market breadth—overall trading volume was low, and decliners outnumbered advancers in the S&P 500 despite the index's gain—suggesting a narrow, concentrated surge rather than broad recovery. Opinions on the sustainability diverge. BTIG strategists warn the rebound has hit key resistance levels, citing extreme volatility and historic stock dispersion as signs of an ongoing broader correction, and recommend selling into strength. Conversely, Goldman Sachs and UBS view the aggressive momentum unwinding as nearing its end, noting reduced positioning and a lack of new fundamental catalysts. They suggest the sell-off presents a selective opportunity to add exposure, albeit cautiously and gradually using defined-risk strategies. The immediate trajectory hinges on the ongoing earnings season, with market focus on Alphabet's capital expenditure guidance for AI investment clarity. Meanwhile, bond markets present a risk, with rising Treasury yields—potentially heading toward 5.5%—and widening credit spreads for mega-cap tech companies posing a threat to equity valuations. The combination of technical factors, earnings results, and macro conditions leaves the durability of the rebound in doubt.

链捕手Hace 40 min(s)

U.S. Tech Momentum Stocks Record Largest Single-Day Gain Ever, but Has the Rout Ended?

链捕手Hace 40 min(s)

Long-Divided Must Unite, Long-United Must Divide: When L1 Becomes Its Own Rollup, What Is Ethereum's Endgame?

"The Inevitable Cycle: When L1 Becomes Its Own Rollup – What is Ethereum's Endgame?" For years, the Ethereum community grappled with concerns that L2s were fragmenting the ecosystem and eroding L1's value. While L2s provided cheaper execution, they also splintered liquidity and the unified user experience of a single chain. This has prompted a fundamental reassessment of the relationship between L1 and L2. Ethereum's roadmap is evolving. The "Scale" initiative merges L1 and L2 expansion into a holistic framework. L1 itself is advancing with higher gas limits, statelessness, and zkEVM verification, no longer content to be just a low-throughput settlement layer. Consequently, the primary value proposition of L2s is shifting from merely providing cheap blockspace to offering L1 cannot easily provide: application-specific optimizations, privacy features, and flexible governance models. L2s are becoming a spectrum of execution environments with varying degrees of security inheritance from Ethereum. A critical challenge in this multi-chain future is interoperability. The vision is to make Ethereum "feel like one chain again." This relies on advancements in native account abstraction (like EIP-7702) and intent-based architectures (Open Intents Framework), where users declare desired outcomes, and solvers handle the complex cross-chain execution. Furthermore, shortening Ethereum's finality time from minutes to seconds is crucial, as it underpins trust between chains for bridges, stablecoins, and cross-chain applications. Perhaps the most provocative idea is that Ethereum L1 itself could become a form of "its own Rollup." As zkEVM and proof systems mature, high-performance nodes could execute transactions and generate validity proofs. Regular validators would then verify these proofs instead of re-executing all transactions. This blurs the traditional L1/L2 hierarchy, making "Rollup" more of a general execution-verification architecture. Native Rollup aims to integrate L2 validation more directly into the Ethereum protocol, allowing L2s to inherit L1's security more fully and move away from reliance on security councils. In the end, L2s are not destined to replace L1 or be made obsolete by it. The likely future is a unified system where diverse execution environments—each optimized for specific use cases like DeFi, gaming, or privacy—coexist. They will share a common foundation of security, liquidity, and verifiable state, seamlessly connected to restore a cohesive user experience. The next phase for Ethereum is not just about scaling through separation, but about intelligently reintegrating what was separated back into a coherent whole.

链捕手Hace 56 min(s)

Long-Divided Must Unite, Long-United Must Divide: When L1 Becomes Its Own Rollup, What Is Ethereum's Endgame?

链捕手Hace 56 min(s)

Trading

Spot
活动图片