When Will Solana Price Surge To $360? Analyst Shares Possible Timeline

bitcoinistPublicado a 2026-04-01Actualizado a 2026-04-01

Resumen

Crypto analyst Celal Kucuker has presented a technical analysis suggesting Solana (SOL) could eventually surge to $360, a 333% increase from its current price of around $83. His forecast, however, anticipates significant short-term volatility, including a potential sharp crash to new lows near $50.42 to complete a bearish Double Bottom pattern. Kucuker's chart analysis indicates SOL may first rally to approximately $111.32 before plunging to the $50 support level. From that low, a breakout from a long-term descending channel could propel the price toward the $360 target, potentially by late 2026 or 2027. Key resistance levels on the path are identified at $130 and $260. When questioned on the fundamental thesis, the analyst pointed to broader crypto market dynamics, suggesting that momentum from meme coin rallies often catalyzes upward movement across the market, which could drive Solana to new all-time highs.

A crypto analyst has issued a new Solana price forecast, outlining several potential target levels for the current cycle. In the short term, the analyst expects significant volatility and the possibility of a sharp price crash to new lows. Despite this, his ultimate projection suggests that SOL could surge toward $360, representing a roughly 333% increase from its price of about $83 at the time of writing.

When The Solana Price Could Hit $360

A detailed technical analysis shared by market expert Celal Kucuker on X has sparked renewed optimism around Solana’s price outlook. The analyst shared a chart showing the SOL price around $88 at the time. He also outlined a clear roadmap that points to a potential final surge near $360 for the cryptocurrency.

The chart reveals a dominant bearish channel defined by several parallel red descending trendlines that shaped Solana’s price action from late 2025 through early 2026. These lines have repeatedly capped rallies and guided SOL’s downtrend, while also respecting the critical resistance point around $147.15.

Following the cryptocurrency’s rally to $147, it recorded a massive price crash to $66.92, marking the first floor of its Double Bottom pattern, as shown on the chart. Based on the trajectory of black lines within the descending parallel channel, Kucuker expects Solana to rally again to $111.32 in the near term, representing a roughly 66% increase from the previous bottom.
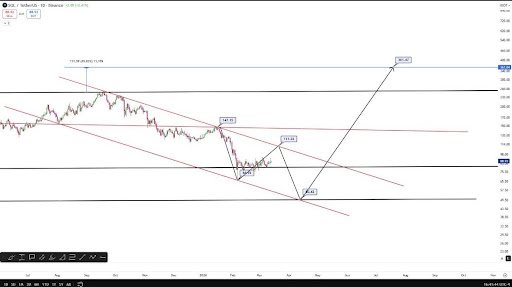
Source: Chart from Celal Kucuker on X

Once this happens, SOL is projected to plunge even deeper toward $50.42, officially completing its bearish Double Bottom pattern. Kucuker has highlighted this area as a solid support zone. From this pivotal low, the analyst drew a black, upward-sloping line that cleanly slices through the entire bearish descending channel.

This line points directly to the $361.47 bullish target. Kucuker’s timing for this projection suggests that Solana could skyrocket to this level by 2027. However, the chart shows somewhere around the third quarter of 2026. Notably, such a move would deliver a staggering 616% gain from the projected $50.42 support level.

Additional targets in the chart analysis further reinforce Kucuker’s bullish outlook. The analyst drew multiple horizontal lines on the chart to mark key resistance zones that may influence price movement. The first red line points to $130 as an immediate resistance level, which comes into play once the price surpasses the initial target of $111.32. Beyond this, the next black line identifies $260 as the next major resistance level that, if broken, could confirm Solana’s projected price rally above $360.

The Thesis Behind The Bull Rally

A crypto community member has challenged Kucuker’s bullish forecast for Solana, questioning why he posted price targets and charts without explaining the underlying thesis. They asked the analyst to explain which macroeconomic factors could push the SOL price above $360 and which could drive it down to the $50 support level.

In response, Kucuker pointed to broader market dynamics, noting that price rallies often start with meme coins, which typically generate momentum across the market. He noted that Solana will likely benefit from this upward movement, potentially propelling it to new all-time highs.

SOL trading at $82 on the 1D chart | Source: SOLUSDT on Tradingview.com

Preguntas relacionadas

QWhat is the analyst's ultimate price target for Solana in this cycle, and what percentage increase does that represent from the current price?

AThe analyst's ultimate price target for Solana is $360, which represents a roughly 333% increase from its price of about $83 at the time of writing.

QAccording to the technical analysis, what is the projected low point that would form the Double Bottom pattern before the surge?

AThe analysis projects that Solana will plunge to a low of $50.42 to officially complete its bearish Double Bottom pattern.

QWhat are the two key resistance levels identified in the chart that Solana must break through on its way to the $360 target?

AThe two key resistance levels identified are $130 as an immediate resistance and $260 as the next major resistance level.

QWhat broader market dynamic did the analyst cite as a potential catalyst for Solana's price rally?

AThe analyst cited that price rallies often start with meme coins, which generate momentum across the market, and Solana will likely benefit from this upward movement.

QBy what timeframe does the analyst suggest Solana could potentially reach the $360 price target?

AThe analyst's timing suggests Solana could reach the $360 target by 2027, with the chart indicating it could happen around the third quarter of 2026.

Lecturas Relacionadas

Los retiros de Bitcoin continúan: 8 años de almacenamiento en una cartera fría Coldcard terminaron en cero

Retirada de bitcoin continúa: 8 años en cartera fría Coldcard terminan en cero La cartera hardware Coldcard ha sido vulnerada, provocando una nueva oleada de retiradas de fondos de dispositivos afectados. Galaxy Research informa que el volumen total robado asciende a 1.367,05 BTC (unos 88,6 millones de dólares) desde 4.585 direcciones, superando ampliamente los 594,5 BTC reportados inicialmente el 30 de julio de 2026. La mayor parte de lo robado permanece inactiva en las direcciones de los atacantes. El problema no reside en el firmware, que ya fue actualizado por Coinkite, sino en las frases semilla (seed phrases) generadas desde marzo de 2021 debido a un error de programación. Estas frases son fácilmente descifrables, y actualizar el firmware no las cambia. Solo transferir los fondos a una nueva dirección con una nueva frase semilla elimina la vulnerabilidad. El fallo se originó al integrar la biblioteca libNgU, lo que hizo que los dispositivos dejaran de usar el generador de números aleatorios por hardware STM32 y pasaran a usar el generador software Yasmarang, inicializado con datos públicamente accesibles como el número de serie del chip. Afecta a frases semilla creadas en dispositivos Mk2/Mk3 (firmware 4.0.1–4.1.9 y hasta 5.0.3), Mk4/Mk5 (hasta v5.6.0) y Q (hasta v1.5.0Q). Se excluyen aquellas creadas con al menos 50 lanzamientos de dados independientes o una passphrase BIP-39 fuerte y única. Los usuarios deben generar una nueva frase semilla en firmware corregido y transferir sus activos. Un caso ilustrativo es el de un inversor de 39 años que perdió 2 BTC (unos 130.000 dólares) en minutos, ahorrados durante ocho años mediante trabajo físico como protección contra la hiperinflación en su país, con el objetivo de una jubilación anticipada a los 50 años. Su estrategia conservadora de "comprar y mantener en frío" se vio truncada, dejándolo devastado y decidido a abandonar las criptomonedas. Este incidente recuerda vulnerabilidades históricas por generadores de números aleatorios débiles, como la de la biblioteca BitcoinJS (2011-2015), que causó grandes pérdidas. Subraya que el almacenamiento offline no garantiza automáticamente seguridad criptográfica, especialmente cuando la entropía se ve comprometida dentro del propio dispositivo "cerrado".

cryptonews.ruHace 44 min(s)

Los retiros de Bitcoin continúan: 8 años de almacenamiento en una cartera fría Coldcard terminaron en cero

cryptonews.ruHace 44 min(s)

Por qué el Bitcoin se mantiene en $64,000 tras la dura pausa de la Fed

Bitcóin cierra julio cerca de los 64.000 dólares tras una volátil reacción a la decisión de la Fed de mantener las tasas sin cambios, aunque sin indicar un pronto aflojamiento monetario. Esto ha provocado una rotación de capital hacia los ETF de Bitcoin, que registraron una entrada neta de 32,1 millones de dólares, mientras que los fondos de Ethereum experimentaron salidas. El mercado de criptomonedas, con una capitalización de unos 2,29 billones de dólares, se mantiene en un rango lateral, con Bitcoin encontrando soporte en 63.000-63.500 dólares y resistencia en 66.000 dólares. La Fed mantuvo su tasa clave, pero tres miembros votaron a favor de un aumento, señalando una postura más dura de lo esperada. En este entorno macroeconómico incierto, los inversores institucionales parecen favorecer a Bitcoin como activo principal, aunque persiste el interés selectivo en activos como Solana. Mientras, la aprobación de la ley CLARITY en EE.UU. se retrasa hasta después del receso de agosto. Para el último día de julio, el enfoque estará en los datos macro de EE.UU. El escenario base para Bitcoin es la consolidación entre 63.000 y 66.000 dólares, con su ruptura superior dependiendo de nuevos flujos institucionales. La estabilidad por encima de 63.000 dólares para BTC, el mantenimiento de Ethereum sobre 1.860 dólares y las entradas continuas en ETF son claves para una posible base de recuperación en la segunda mitad del año.

cryptonews.ruHace 4 hora(s)

Por qué el Bitcoin se mantiene en $64,000 tras la dura pausa de la Fed

cryptonews.ruHace 4 hora(s)

Trading

Spot
活动图片





