Venice Token [VVV] surges 14% – Why THIS is the next KEY hurdle

ambcryptoPublicado a 2026-03-26Actualizado a 2026-03-26

Resumen

Venice Token (VVV) surged 14.37% to $6.40, supported by a 26.54% increase in trading volume, indicating strong spot market demand. The price broke out of a pennant pattern, shifting the market structure from consolidation to expansion, with immediate resistance at $6.68 and a potential target near $8.50. Key support now lies at $5.14. However, the MACD shows weakening bullish momentum with a negative histogram, suggesting a divergence between price action and underlying strength. Additionally, persistent sell pressure in Spot CVD indicates aggressive selling, though buyers appear to be absorbing it. Open Interest rose 18.74%, reflecting leveraged positioning that could fuel volatility. The rally's sustainability depends on holding above $5.14; a break below could quickly reverse gains.

Venice Token [VVV] has surged 14.37% to $6.40 as trading volume climbs 26.54% to $23.12M, signaling strong demand expansion across the spot market.

This expansion shows that price is not drifting upward but rather advancing through strong spot demand.

As participation increases, the rally reflects conviction instead of low-liquidity spikes. The VVV price increase toward $6.40 highlights alignment between demand and price action.

However, volume expansion at this stage also suggests that traders are reacting to the breakout rather than anticipating it.

As a result, this phase often defines whether continuation can hold or begin to fade under pressure.

VVV breaks free as structure shifts upward

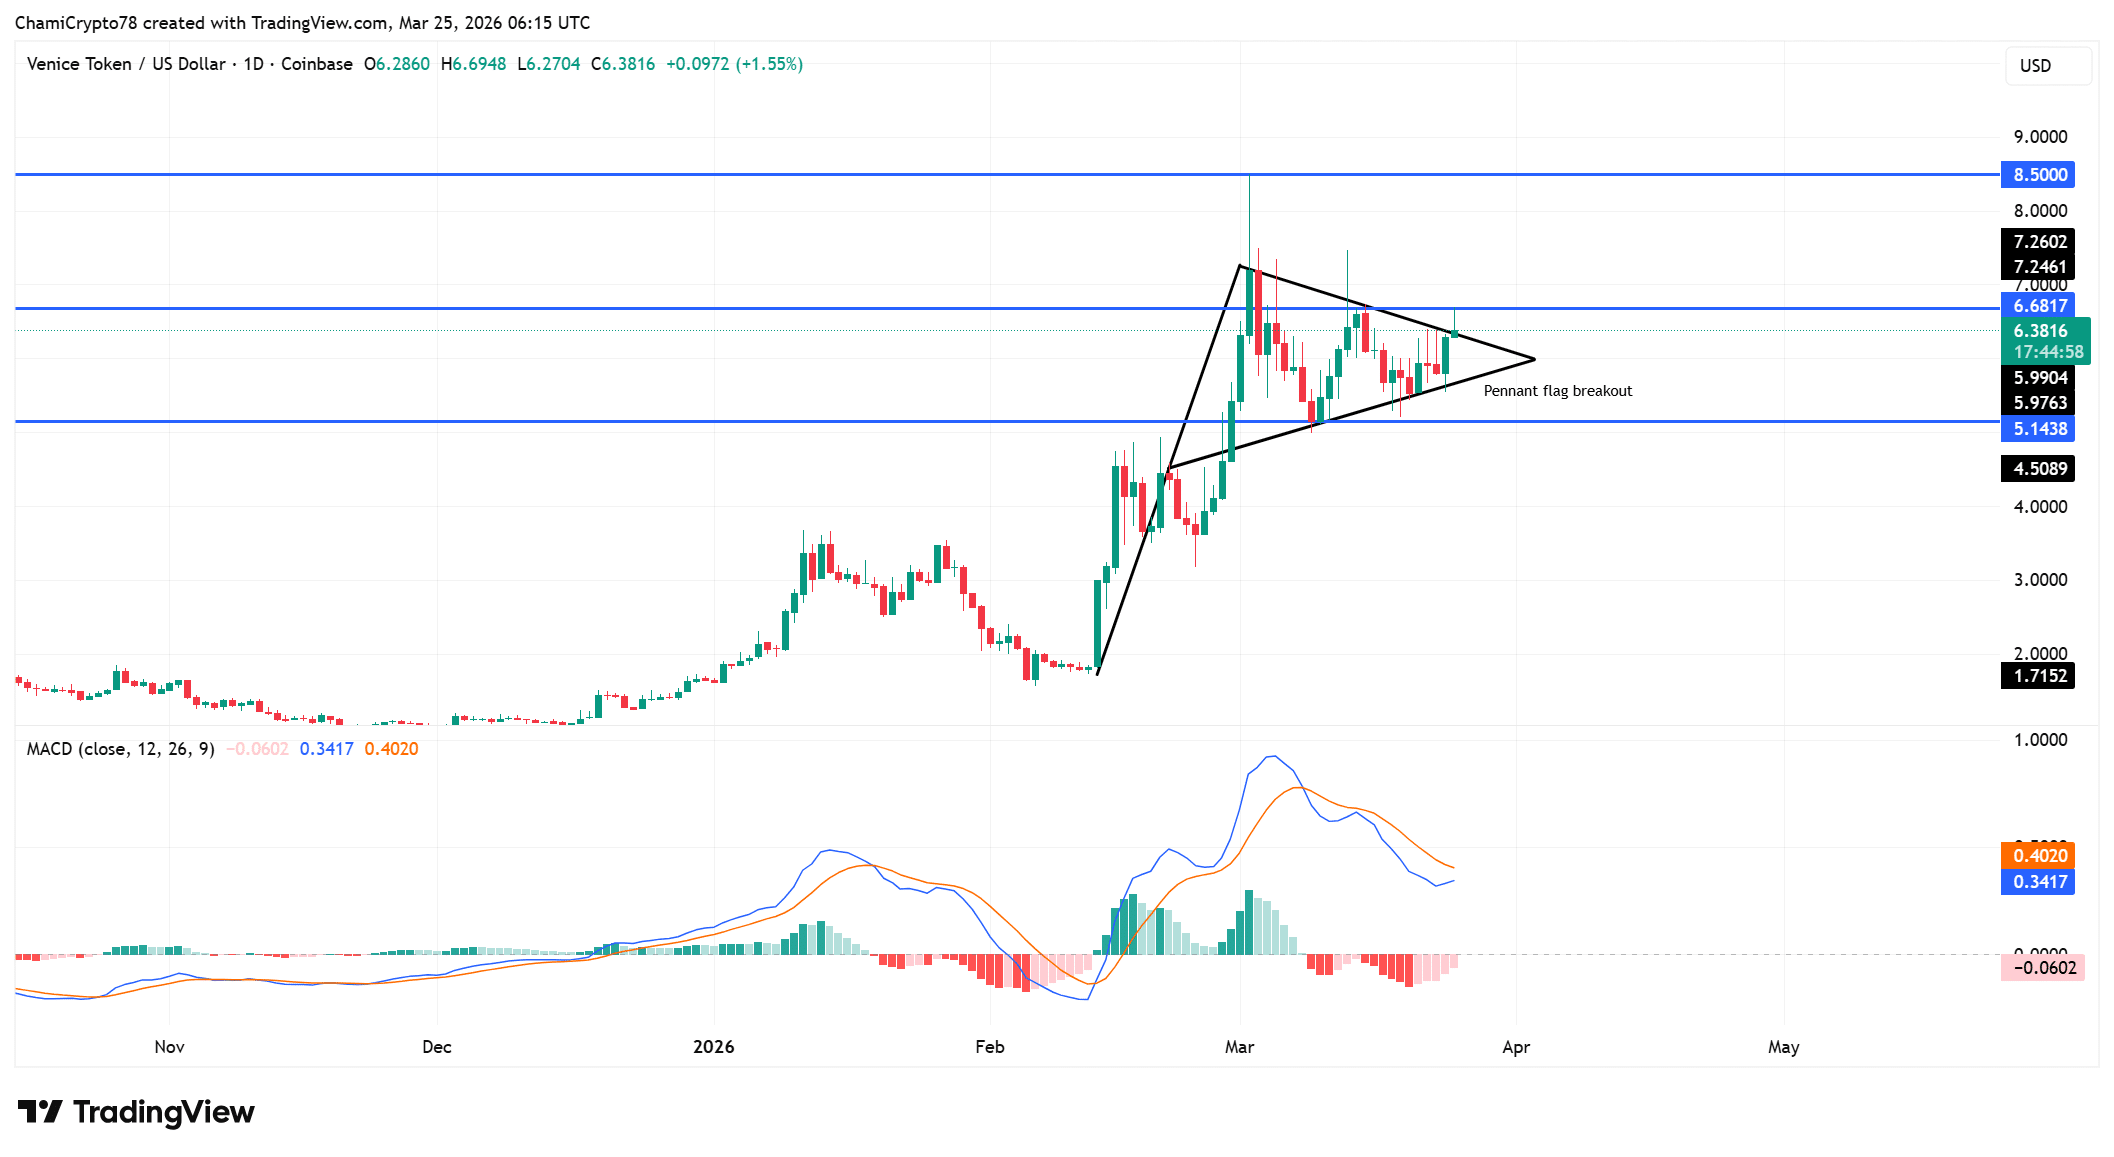
Price has broken out of the pennant flag, ending the prior compression phase and shifting structure toward expansion.

The breakout places immediate resistance at $6.68, while a broader target forms near $8.50 if continuation holds.

Besides, the former consolidation region around $5.14 now acts as a key support base. This transition reflects a shift from indecision into directional control.

However, price now approaches resistance zones where sellers may respond. As a result, holding above the breakout zone remains critical.

If price maintains this structure, the breakout could extend, but failure to hold support would quickly weaken the setup.

The MACD structure shows that bullish strength has not fully aligned with price action.

The indicator has not crossed above the signal line, which limits confirmation of sustained upside pressure.

Additionally, the histogram has turned negative, reflecting weakening strength after the breakout.

This divergence highlights a gap between structural expansion and internal strength. However, price continues holding above key levels, suggesting that buyers still defend the move.

As a result, the current setup reflects early-stage expansion rather than fully confirmed continuation.
Source: TradingView

CVD divergence exposes underlying sell pressure

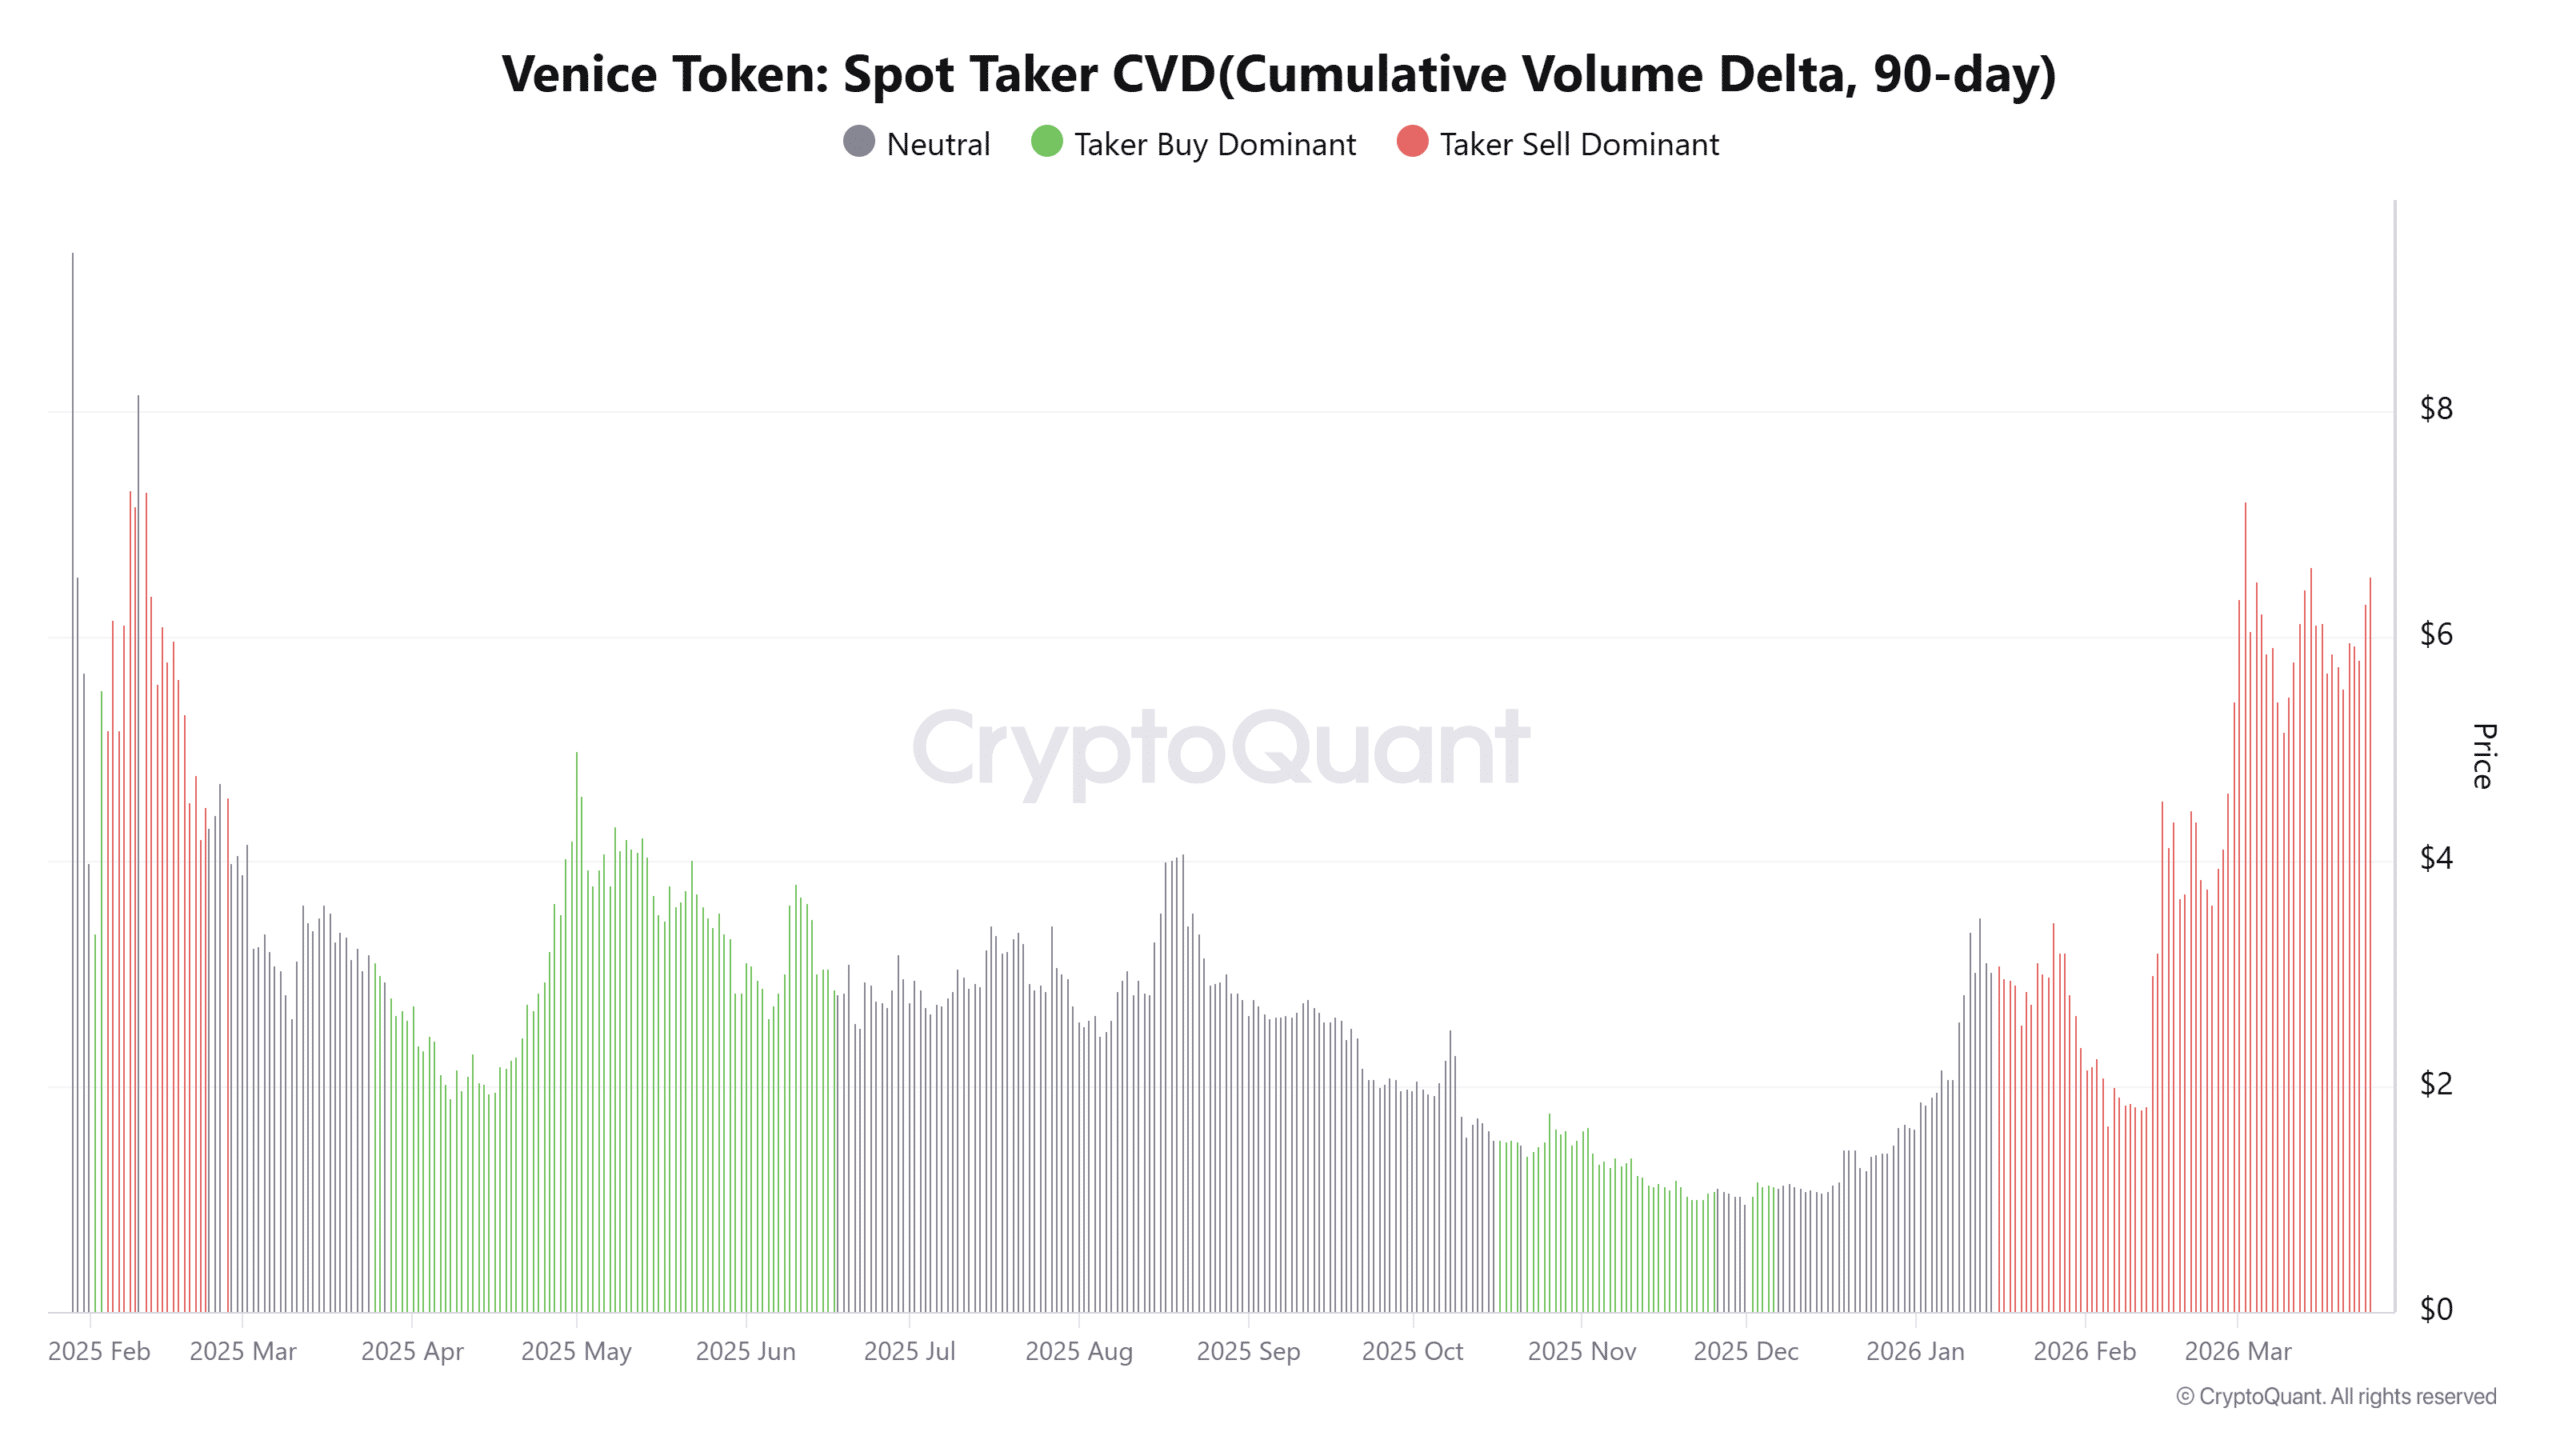
Spot Taker CVD remains sell-dominant over the past 90 days, revealing persistent aggressive selling beneath the rally.

This structure indicates that market participants continue executing sell orders even as price rises.

However, price has not declined, which suggests that larger buyers may be absorbing this supply.

This divergence highlights a key imbalance between visible selling and hidden demand. As a result, the rally depends on continued absorption to sustain upward movement.

If selling pressure intensifies without matching demand, the structure could weaken. However, as long as price holds, this absorption continues supporting the current trend.
Source: CryptoQuant

Open interest rise shows leveraged buildup into VVV breakout

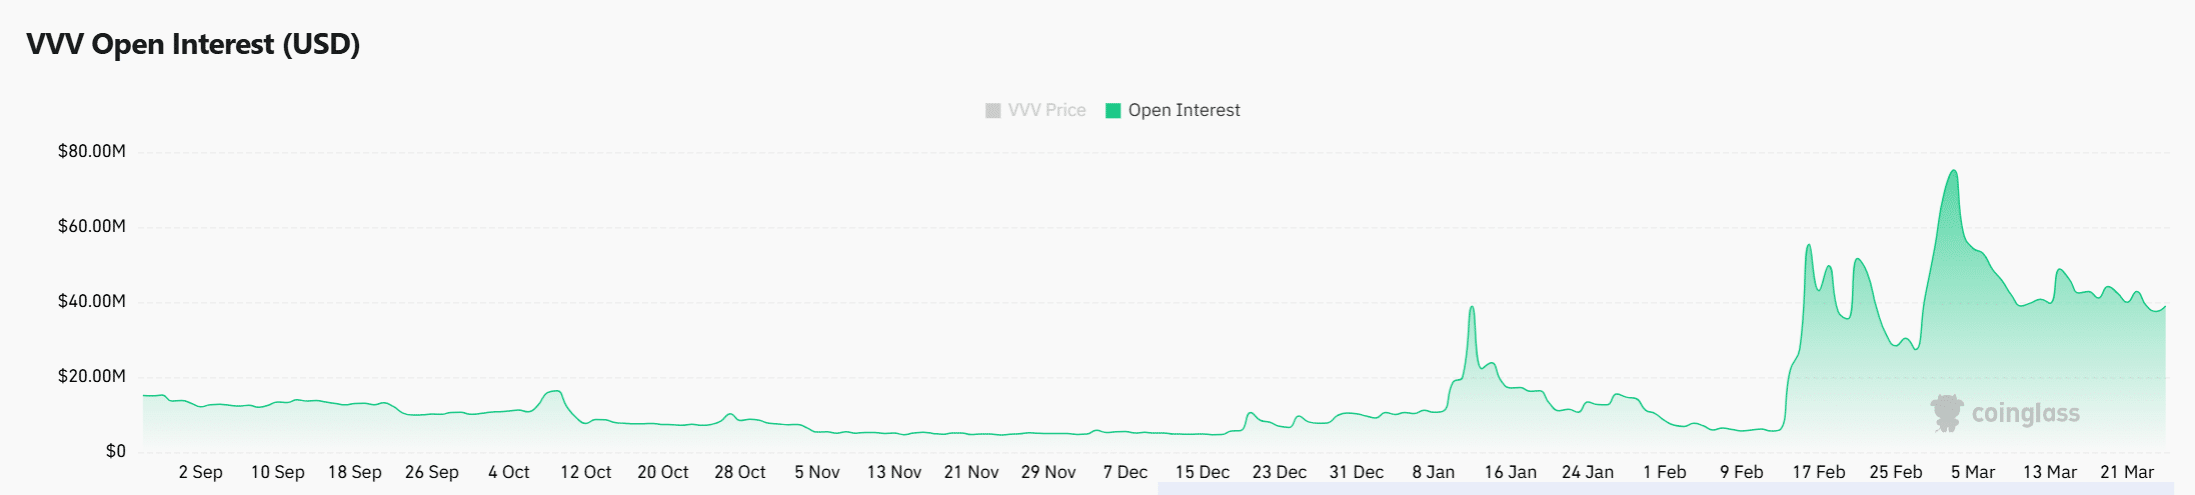
Open interest has increased by 18.74% to $43.21M, reflecting growing participation in derivatives markets.

This rise shows that traders are positioning aggressively as price breaks out of consolidation. However, leveraged positioning introduces volatility, especially near resistance zones.

As positions build, the market becomes sensitive to rapid price movements in either direction. This setup often leads to sharp expansions once liquidity gets triggered.

At the same time, rising open interest without strong confirmation from other indicators increases risk.

If price continues higher, these positions could fuel continuation, but any reversal would quickly unwind these leveraged trades.
Source: CoinGlass


VVV has broken out with strong volume support, which strengthens its bullish structure. However, weakening MACD signals and persistent sell pressure create underlying tension.

The rally can sustain if buyers continue absorbing supply and hold above $5.14. If that support fails, the breakout would likely weaken quickly under pressure.


Final Summary

  • VVV surged 14% to $6.40, backed by a 26% jump in Spot Volume. Breakout above the pennant shifted the structure from consolidation to expansion.
  • Open Interest rose 18%, signaling aggressive leveraged positioning. Rising leverage increases the risk of sharp moves, especially near resistance


Preguntas relacionadas

QWhat is the current price of Venice Token (VVV) and by what percentage has it surged?

AThe current price of Venice Token (VVV) is $6.40, and it has surged by 14.37%.

QWhat key resistance level does the article identify for VVV after its breakout?

AThe article identifies $6.68 as the immediate resistance level for VVV after its breakout.

QAccording to the MACD indicator, what divergence suggests a lack of full confirmation for the upward price movement?

AThe MACD has not crossed above the signal line, and the histogram has turned negative, indicating a divergence between the price expansion and the underlying bullish strength.

QWhat does the persistent sell-dominant Spot Taker CVD indicate about the market activity?

AThe persistent sell-dominant Spot Taker CVD indicates that there is aggressive selling pressure happening beneath the rally, which is being absorbed by larger buyers to sustain the price increase.

QWhy does the rise in Open Interest introduce increased risk for VVV price movement?

AThe 18.74% rise in Open Interest to $43.21M shows that traders are using significant leverage. This introduces volatility and the risk of sharp price movements in either direction, as these leveraged positions could quickly unwind if the price reverses.

Lecturas Relacionadas

Una ‘diosa’ de la caridad con 3 millones de seguidores era todo una IA: la farsa del ‘orfanato falso’ desmonta de la noche a la mañana una beneficencia transnacional

La australiana Lily Jay, una influencer de Instagram con casi 3 millones de seguidores, es investigada por ABC NEWS Verify por una supuesta red de estafa benéfica utilizando contenido generado por IA. A través de su 'Lily Jay Foundation', publicaba videos de proyectos en Uganda, Gaza, Nepal y Sudán, incluyendo la inauguración de un orfanato en Uganda, donde la imagen de ella con niños mostraba anomalías típicas de la IA, como letras mal escritas. Las autoridades de Uganda confirmaron que no existe registro de dicho orfanato. Además, imágenes de un premio humanitario que recibió contenían la marca de agua invisible SynthID de ChatGPT. La investigación revela que la fundación, que operaba desde Kosovo, se define en su sitio web como "no una organización benéfica". Aunque solicitaba donaciones, no figuraba como entidad benéfica registrada en Australia, lo que evita la obligación de transparencia financiera. Tres personas figuran como directores, uno vinculado a una firma de relaciones públicas que promocionó el falso premio. Tras la investigación de ABC, el sitio web eliminó para visitantes australianos los botones de donación y la advertencia sobre su estatus, aunque se mantuvieron activos para el extranjero. Expertos advierten que este caso explota la confianza y el deseo de creer en actos de bondad, marcando un peligroso precedente del uso del 'deepfake' y la IA para defraudar en el sector humanitario.

marsbitHace 31 min(s)

Una ‘diosa’ de la caridad con 3 millones de seguidores era todo una IA: la farsa del ‘orfanato falso’ desmonta de la noche a la mañana una beneficencia transnacional

marsbitHace 31 min(s)

L2 'Recalibrating': Cuando L1 se convierte en su propio Rollup, ¿cuál es el final del camino de Ethereum?

"L2 «recalibración»: cuando L1 se convierte en su propio Rollup, ¿cuál es el final de Ethereum?" La relación entre L1 y L2 en Ethereum está evolucionando. Originalmente, L2 (como los Rollups) se centraban en ofrecer espacio de transacción barato, mientras que L1 priorizaba la descentralización y seguridad. Sin embargo, los avances en Ethereum, como el aumento del límite de Gas y el desarrollo de zkEVM, permiten que L1 también escale significativamente. Esto obliga a repensar el valor de L2, que ya no puede basarse solo en costos bajos, sino que debe ofrecer funciones diferenciadas como privacidad o modelos de gobernanza flexibles. La creciente fragmentación entre múltiples L2 plantea problemas de interoperabilidad y experiencia de usuario. La comunidad está trabajando en soluciones como marcos de intenciones (intents) y una capa de interoperabilidad nativa (EIL) para que Ethereum "vuelva a sentirse como una sola cadena", facilitando las interacciones entre diferentes entornos de ejecución sin que el usuario note la complejidad subyacente. Acortar el tiempo de finalidad de L1 también es crucial para aplicaciones cross-chain. Un concepto provocador sugiere que, con la adopción de sistemas de prueba (zkEVM) en la red principal, Ethereum L1 podría, en un sentido arquitectónico, convertirse en una especie de "Rollup de sí mismo", donde la ejecución y la verificación se separan. Esto, junto con la visión de "Native Rollup", podría difuminar los límites tradicionales entre L1 y L2, transformándolos en un espectro de entornos de ejecución con diferentes funcionalidades pero que comparten seguridad, liquidez y un sistema de estado común. En conclusión, el futuro de Ethereum no es que L1 reemplace a L2 o viceversa. En cambio, el ecosistema podría evolucionar hacia un conjunto unificado de entornos de ejecución especializados que, trabajando en conjunto, ofrezcan escalabilidad, diversidad de funciones y una experiencia de usuario cohesiva. El reto es volver a ensamblar, sin perder los beneficios de la escalabilidad, un Ethereum que funcione como un todo integrado para el usuario final.

marsbitHace 33 min(s)

L2 'Recalibrating': Cuando L1 se convierte en su propio Rollup, ¿cuál es el final del camino de Ethereum?

marsbitHace 33 min(s)

Fragmentos Eternos del Dinero: Los Pagos de Terceros no tienen una Primera Naturaleza

**Fragmentos eternos del dinero: Los pagos de terceros carecen de una primera naturaleza** El sector de pagos vive una época convulsa, con Stripe intentando adquirir PayPal. Stripe, que alcanzó una valoración de 100.000 millones de dólares durante la pandemia pero no salió a bolsa, busca ahora nuevas narrativas de crecimiento a través de adquisiciones y la expansión hacia las stablecoins y la economía de los agentes. El artículo argumenta que la industria de pagos es inherentemente fragmentada y está subordinada a la banca tradicional, lo que limita el potencial disruptivo de cualquier jugador. Los esfuerzos de Stripe en stablecoins (como OUSD) y su red de pago para agentes (Tempo) son vistos como apuestas de futuro, pero enfrentan el desafío de la adopción real más allá del ámbito cripto. Se destaca que los modelos de negocio basados solo en procesamiento de pagos son limitados. El futuro podría estar en los servicios de valor añadido, especialmente en las redes de liquidación. Empresas como Stripe y Circle, al obtener licencias bancarias, podrían desarrollar sistemas de liquidación más eficientes que capturen parte del valor tradicionalmente retenido por los bancos. En conclusión, Stripe se enfrenta a una guerra de trincheras en un sector fragmentado. Su éxito depende de si puede trascender el simple procesamiento y capitalizar las oportunidades en stablecoins, agentes y, sobre todo, en la infraestructura de liquidación, para escapar de la eterna fragmentación del dinero.

marsbitHace 57 min(s)

Fragmentos Eternos del Dinero: Los Pagos de Terceros no tienen una Primera Naturaleza

marsbitHace 57 min(s)

Trading

Spot
活动图片