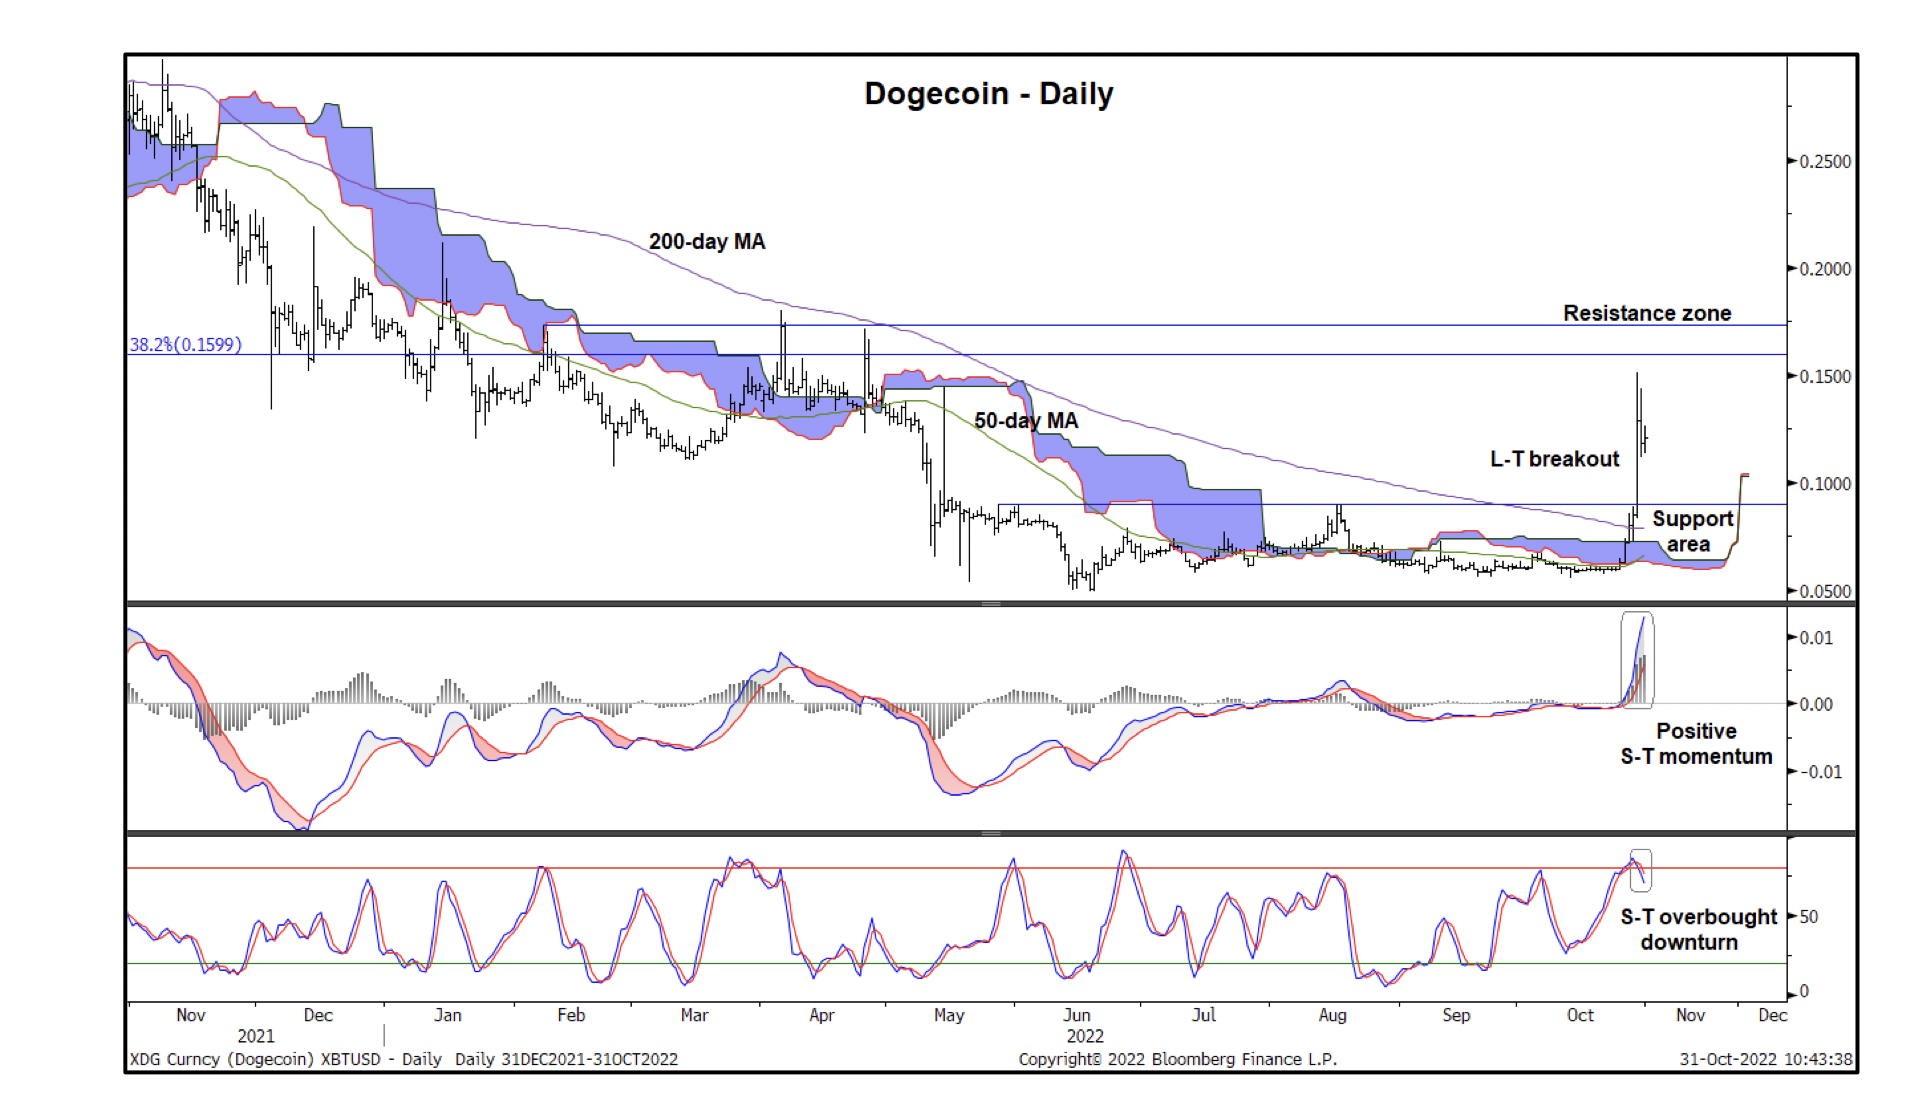
The Twitter-inspired rally in the price of Dogecoin (DOGE) over the past week has pushed that crypto well above its technically notable 200-day moving average.
⠀
Trading at below $0.06 one week ago, DOGE rallied to above $0.15 at its high on Tuesday thanks to Elon Musk closing his Twitter purchase and hope of some sort of integration with the popular social media platform.
⠀
As of Tuesday, the ratio between DOGE's going market price and the 200-day simple-moving average (SMA), also known as the Mayer Multiple, stood at 1.83, the highest since June 2021, according to data provided by charting platform TradingView.
⠀
Not surprisingly Dogecoin's Mayer Multiple is the highest among the top 20 cryptocurrencies by market capitalization.
⠀
"Dogecoin rallied over 100% last week on speculation of integration with Twitter. The surge is meaningful on its chart, noting the breakout above the 200-day MA and former peaks," Katie Stockton, founder and managing partner of Fairlead Strategies, wrote in a note to clients.
⠀
⠀
The chart shows DOGE has surged past its 200-day SMA, Ichimokou cloud (the blue shaded area) and the Aug. 16 high of $0.0917, turning the resistance into support. Crossovers above or below the cloud are widely taken to represent early signs of a bullish or bearish trend change.
⠀
According to Stockton, DOGE's breakout may have long-term implications if the bulls manage to build a new base above the former resistance-turned-support of $0.0917 marked by the horizontal line on the above chart.
⠀
Yet chasing the rally now may be risky, due to the possibility of a "sell the news" event, according to Stockton. Musk completed his $44 billion acquisition of Twitter late last week. So, traders who bought DOGE ahead of that event might book profit, fueling a price pullback.
⠀
This may be happening already as DOGE is down 8.5% on Wednesday morning to $0.129, now off nearly 17% from its peak level on Tuesday.
⠀
And while the MACD histogram, the indicator below the price chart, shows strong upward momentum, the stochastic oscillator has turned lower from above-80 or overbought levels, suggesting scope for a bull breather or temporary price pullback. Chart analysts use the MACD to gauge trend strength and trend changes and stochastic to identify overbought and oversold levels.


