85% of concentrated liquidity is underutilized — Meaning for DeFi?

ambcryptoPublicado a 2026-07-18Actualizado a 2026-07-18

Resumen

A recent Dune report reveals that concentrated liquidity, designed to enhance capital efficiency in decentralized exchanges, is largely underutilized. In the first half of 2026, an average of 29.4% of liquidity across major protocols like Uniswap v3/v4, PancakeSwap v3, and Aerodrome Slipstream was idle—outside active trading ranges—resulting in no fee generation. This represents about $542 million in idle capital weekly and an estimated $150 million in lost annual fees for LPs. When considering technically available but unused liquidity, the underutilization rate rises to approximately 85%. The study indicates that much of this idle capital, particularly over $200 million untouched for more than 90 days, stems from liquidity providers not actively managing their positions. Individual investors, not automated managers, hold the vast majority of this idle liquidity (e.g., 94% on Ethereum). Automated managers maintain far more active and in-range positions. Notably, Uniswap v4 has not resolved the issue; about 30.5% of its liquidity remains out of range, and while it introduced hooks for external yield strategies, only 10% of its TVL uses them, with none currently generating yield from idle capital.

A significant amount of the liquidity that users contribute to decentralized exchanges isn’t really being used to speed up trades, according to a recent report by Dune.

To put things in perspective, concentrated liquidity was created to increase the capital efficiency of decentralized exchanges. This was done by enabling liquidity providers (LPs) to distribute funds within particular price ranges where trading is most likely to take place.

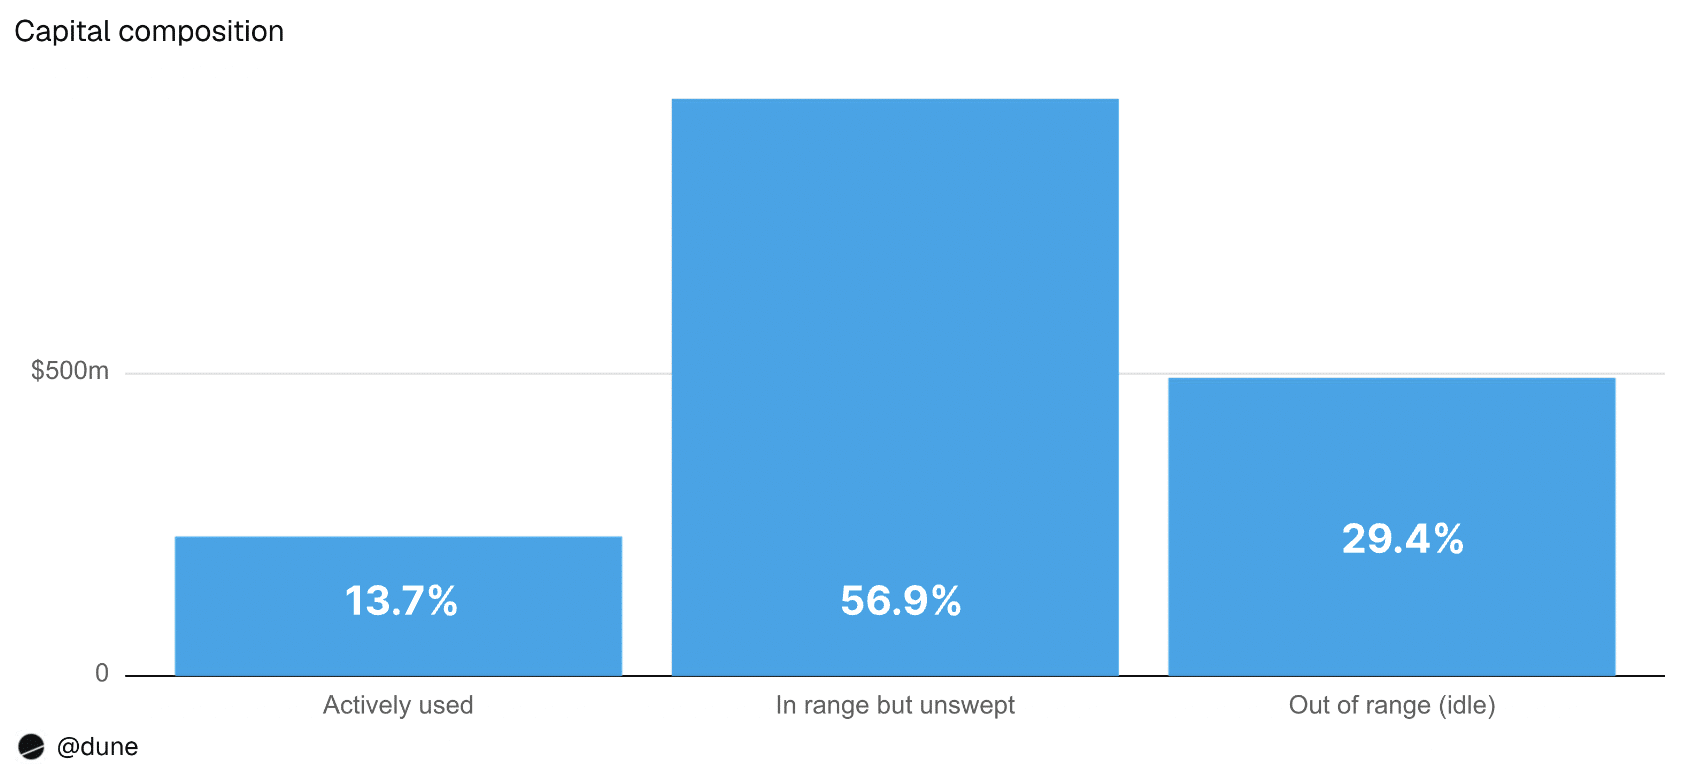
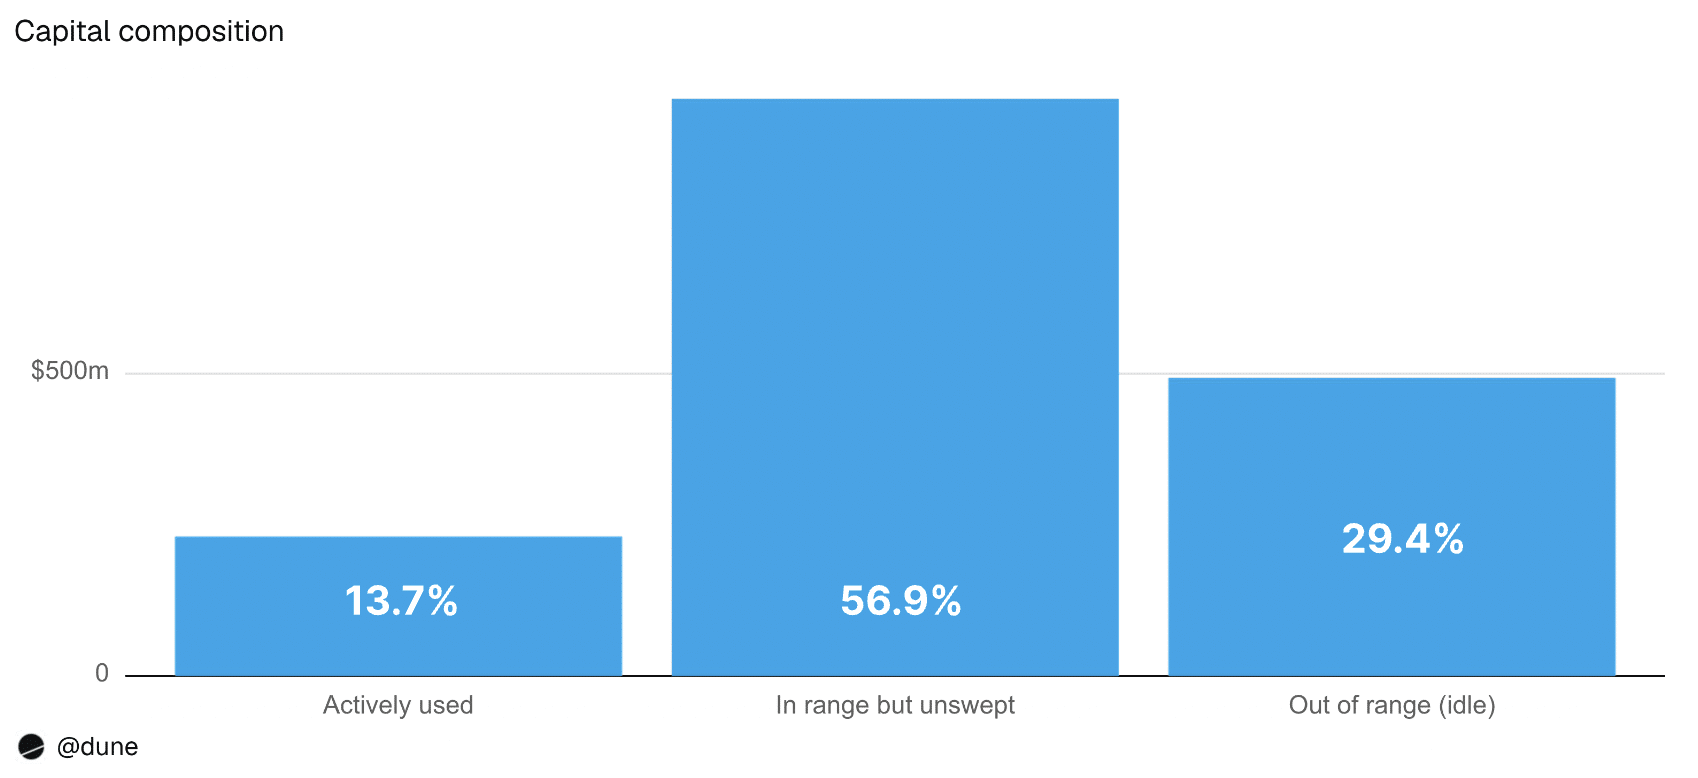
However, the study discovered that during the first half of 2026, an average of 29.4% of liquidity was outside the range of active trading. Thanks to the same, no trading fees were generated.
Source: Dune

This amounted to approximately $542 million in idle capital per week and an estimated $150 million in lost annual fee income for liquidity providers across the four protocols.

For context, the 4 protocols included were Uniswap v3, Uniswap v4, PancakeSwap v3, and Aerodrome Slipstream.

Underutilized concentrated liquidity

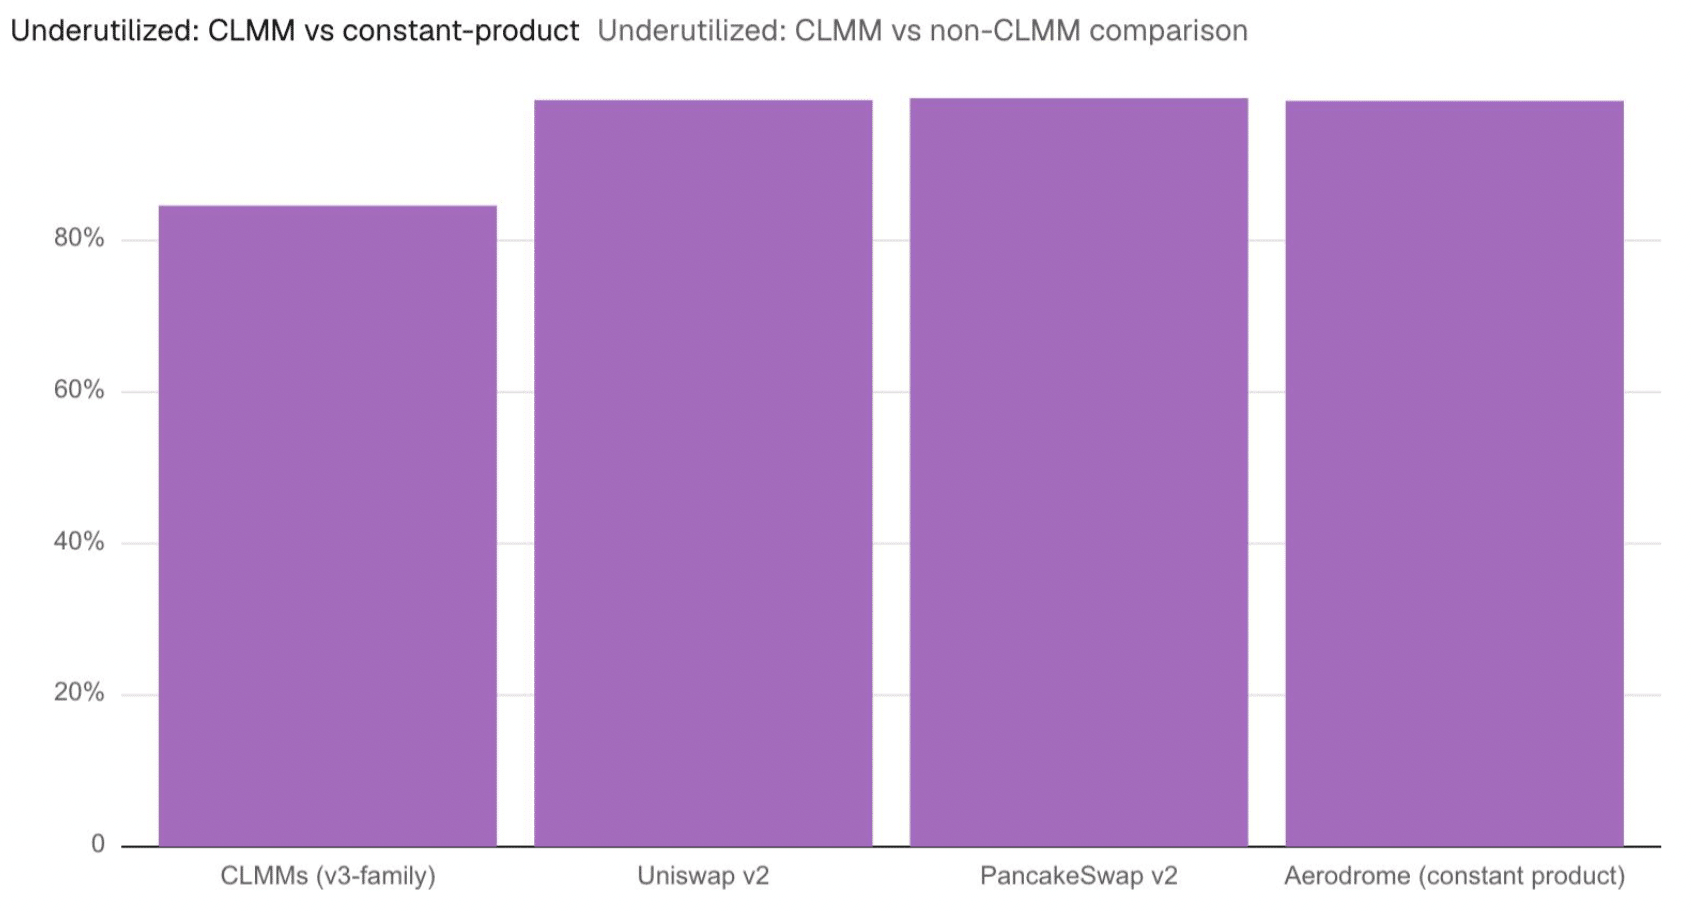
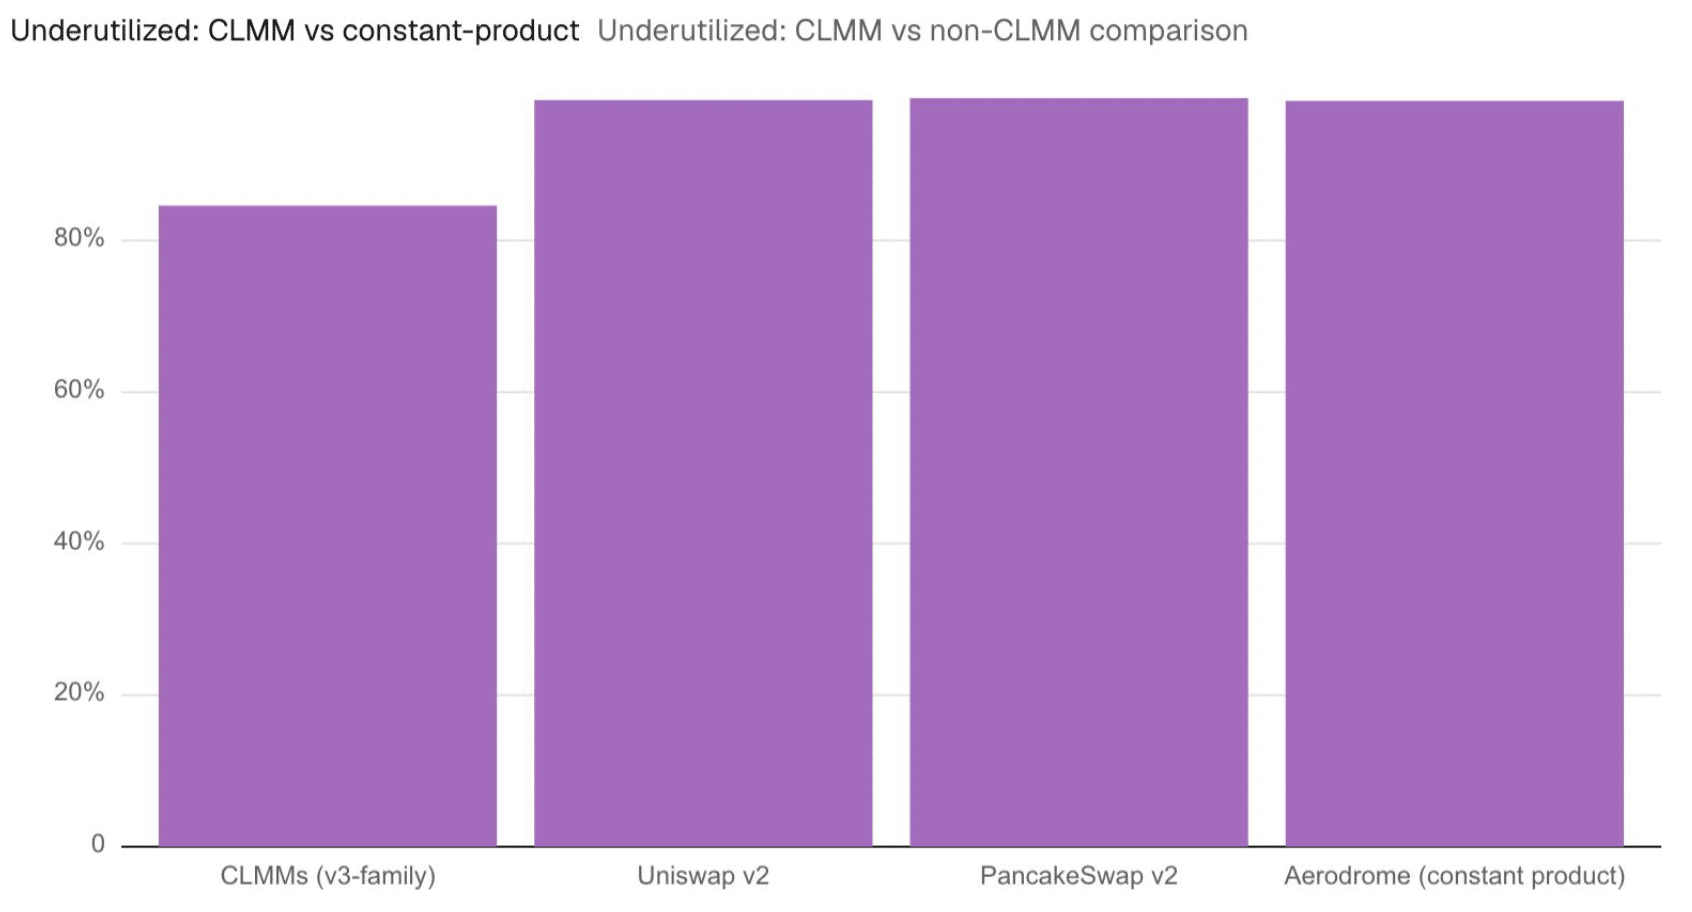
Considering technically available but never used liquidity, about 85% of capital was underutilized.
Source: Dune

The fact that more than $200 million in idle liquidity had not been repositioned in more than 90 days may be evidence that many LPs do not actively manage their holdings.

This also suggested that even though concentrated liquidity should increase efficiency, many LPs still find it difficult to maintain their positions in line with market prices.

Individual investors suffered the most

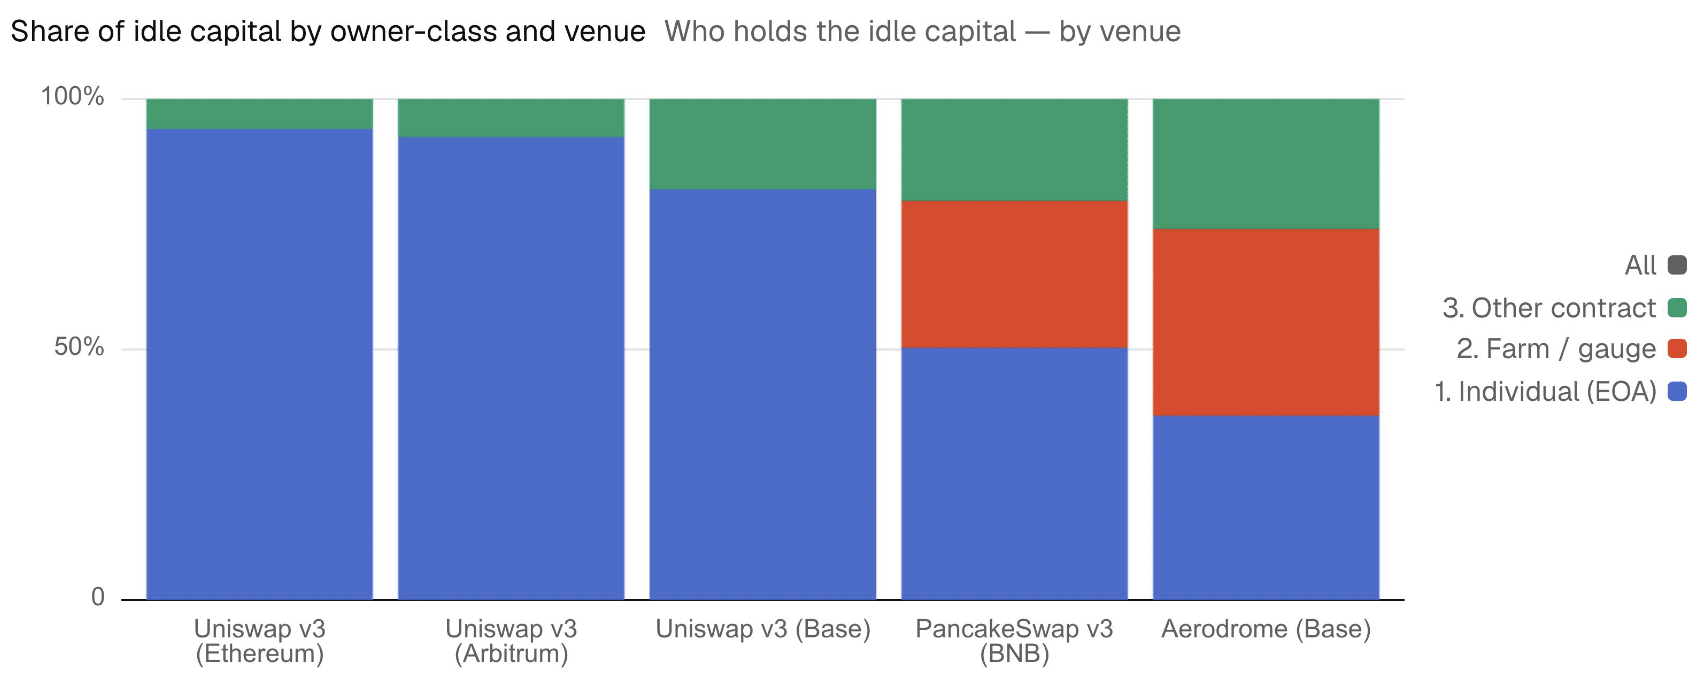
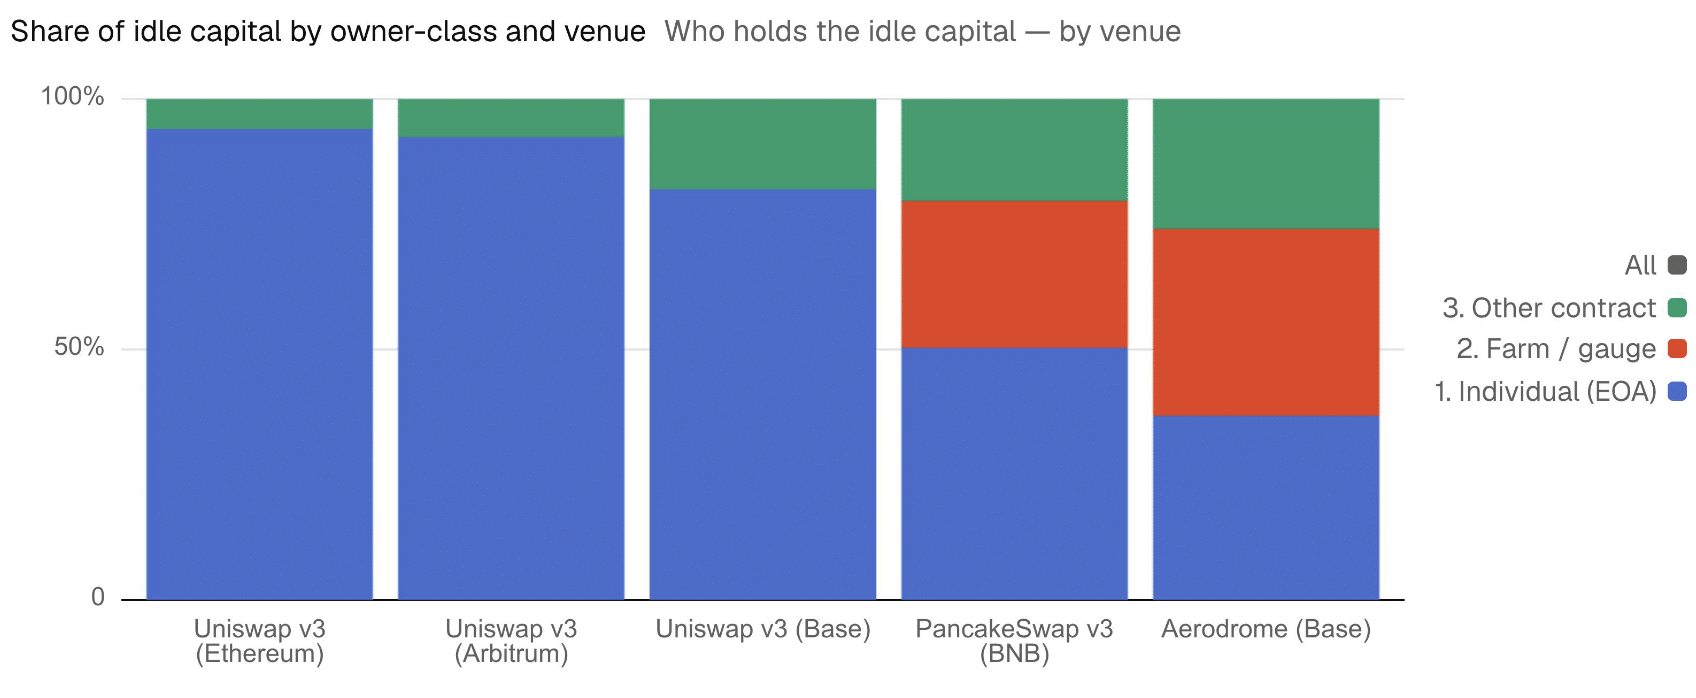
Additionally, the study discovered that automated managers maintained capital activity, while individual investors owned the majority of idle liquidity.

Wallets on Ethereum, for instance, had 94% of idle capital and 91% of Uniswap v3 liquidity. 92% of idle liquidity and 78% of liquidity were under control on Arbitrum. On Base, individual users oversaw 82% of the idle capital, even though smart contracts held roughly 50% of the liquidity.
Source: Dune

This, because only 6.5% of their positions were out of range, compared to about 30% for wallets. This also indicated that automated managers have been far more successful than individual LPs at maintaining liquidity.

Additional loopholes

Finally, the study found that the idle liquidity issue has not been resolved by Uniswap v4.

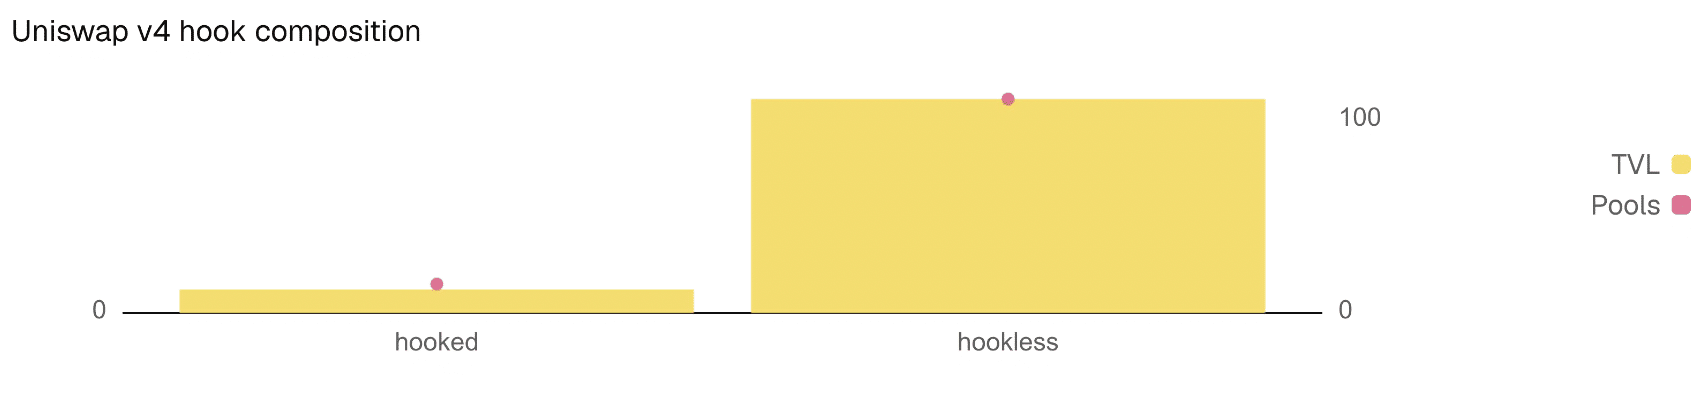
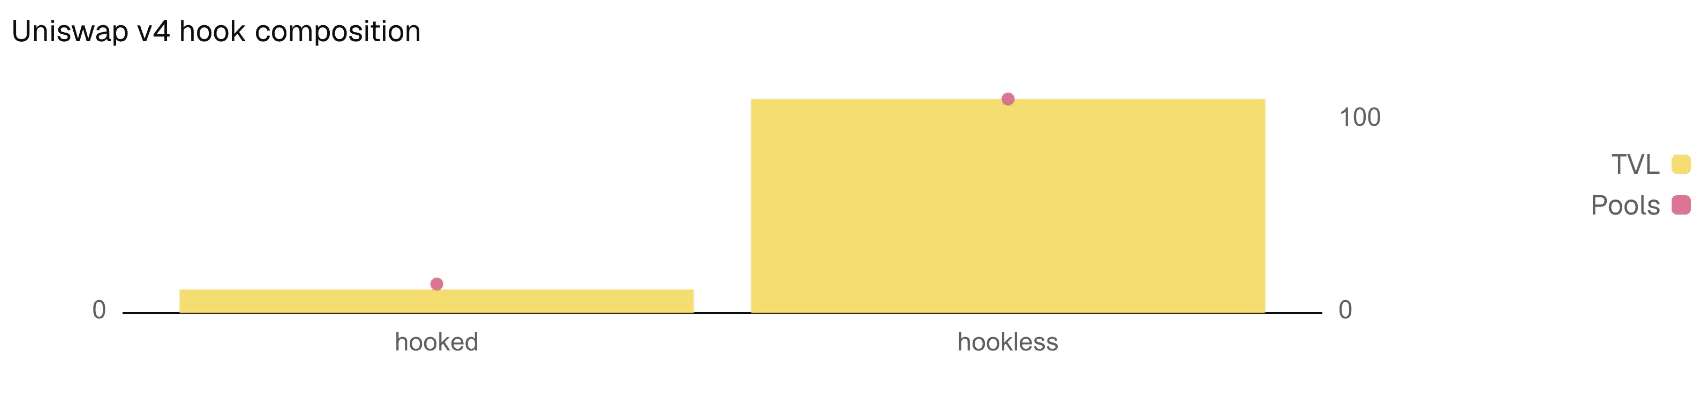
Like Uniswap v3, about 30.5% of its liquidity is still out of range even after hooks were added that might allow idle capital to be used in external yield strategies.

Also, just 10% of v4’s TVL actually uses hooks while none of them produce yield from idle liquidity at the moment.
Source: Dune

Final Summary

  • In H1 2026, approx. 29.5% of liquidity was outside the range of active trading.
  • Instead of AMMs, individual investors owned the majority of idle liquidity.

Preguntas relacionadas

QAccording to the report, what percentage of concentrated liquidity was found to be underutilized when considering technically available but never used capital?

AApproximately 85% of capital was underutilized.

QWhat was the estimated annual lost fee income for liquidity providers across the four protocols studied (Uniswap v3, Uniswap v4, PancakeSwap v3, Aerodrome Slipstream)?

AAn estimated $150 million in annual fee income was lost.

QWhich group of users was found to own and control the majority of the idle liquidity, according to the study?

AIndividual investors (wallets) owned and controlled the majority of the idle liquidity, as opposed to automated managers.

QHas the introduction of hooks in Uniswap v4 successfully resolved the idle liquidity issue?

ANo, it has not. Like Uniswap v3, about 30.5% of Uniswap v4's liquidity remains out of range, and currently, none of the hooks in use produce yield from idle liquidity.

QWhat does the high amount of liquidity not repositioned for over 90 days suggest about many liquidity providers (LPs)?

AIt suggests that many LPs do not actively manage their holdings, finding it difficult to maintain their positions in line with market prices despite the design of concentrated liquidity to increase efficiency.

Lecturas Relacionadas

Tras tres trimestres consecutivos de caída, ¿puede el mercado cripto encontrar una ventana de estabilización en el tercer trimestre?

El mercado cripto sufrió su peor trimestre desde 2022, con una caída del 12.6% en la capitalización total (ahora en $2.1 billones). El volumen de operaciones y el valor de las stablecoins también disminuyeron, señalando una salida generalizada de capitales. Bitcoin y Ethereum cayeron un 14.2% y 25.4% respectivamente, rompiendo su correlación con los mercados de riesgo tradicionales. Los ETFs de Bitcoin en EE.UU. registraron importantes salidas netas ($4.67 mil millones en Q2), aunque datos sugieren que el ciclo de ventas podría estar cerca de su fin. La atención del mercado se centra ahora en la reunión de la FED a finales de julio, cuya postura (halcón o paloma) podría definir el rango de trading de Bitcoin para el trimestre. El avance de la ley CLARITY en el Senado estadounidense se ha estancado, reduciendo la probabilidad de aprobación en 2026 y manteniendo una prima de riesgo regulatorio alta. Solo dos sectores mostraron crecimiento: los mercados de predicción (volumen +48.7%) y los coleccionables tokenizados (volumen +143% vs. Q1). El sentimiento general es de cautela. La lógica del mercado ha cambiado, priorizando fundamentos como la política monetaria y la regulación frente a los simples impulsos narrativos. Aunque las bases para una caída extrema parecen limitadas, la recuperación sostenida en Q3 depende críticamente de la FED y de un posible progreso regulatorio.

marsbitAyer 08:41

Tras tres trimestres consecutivos de caída, ¿puede el mercado cripto encontrar una ventana de estabilización en el tercer trimestre?

marsbitAyer 08:41

BIT Trading Moments: BTC aún presionado por la EMA 200 semanal, tras el rechazo podría reiniciar la caída, los valores de almacenamiento y semiconductores que subieron fuertemente anoche comenzaron a caer en la sesión nocturna

**BIT Trading Moments: BTC aún presionado por la EMA 200 semanal; almacenamiento y semiconductores caen en el after-hours** El mercado de cripto continúa su recuperación, con **Bitcoin** manteniéndose cerca de los $66,000. Enfrenta una fuerte resistencia en la zona de los $68,000, nivel que coincide con el costo promedio de los inversores en los últimos cinco meses y un punto de fallo anterior. Los analistas señalan que se encuentra atrapado entre la media móvil simple (MA) de 200 semanas (~$63,333) y la media exponencial (EMA) de 200 semanas (~$68,328). Se necesitaría un cierre semanal por debajo de $55,000 o por encima de $70,000 para confirmar una dirección de mayor alcance. Los ETF de Bitcoin registran entradas netas por sexto día consecutivo. En Wall Street, los **futuros de los principales índices** caen. Después de fuertes ganancias el martes, las acciones de **semiconductores y almacenamiento** retroceden en el after-hours: el ETF de semiconductores cae un 2.22%, Micron un 2.29% y SK Hynix casi un 5%. Sin embargo, **Super Micro Computer (SMCI)** se dispara más de un 20% tras el cierre, impulsada por sólidos pedidos. Otras noticias positivas incluyen un contrato de $266M de la Fuerza Aérea para **Rocket Lab**. A pesar del repunte bursátil, factores como el **crudo Brent por encima de $91** y el **rendimiento del bono estadounidense a 10 años subiendo a ~4.64%** generan preocupaciones inflacionarias y enfrían el optimismo. Las acciones relacionadas con cripto, como Coinbase y Robinhood, tuvieron un buen desempeño apoyadas por avances regulatorios. En Asia, los mercados siguieron la recuperación tecnológica. El **índice KOSPI de Corea del Sur** subió un 0.74%, con acciones de semiconductores mostrando volatilidad. El principal riesgo es el **yen japonés**, que tocó su nivel más bajo desde 1986, lo que genera temores a una intervención del gobierno. **Próximos eventos clave:** Este miércoles 22 de julio, el enfoque está en los eventos de **AMD AI** y los resultados financieros de **Alphabet (Google), Tesla e IBM** después del cierre. El jueves 23, la **decisión de tasas del BCE** y los resultados de **Intel** serán cruciales para el sentimiento del mercado.

marsbitAyer 08:33

BIT Trading Moments: BTC aún presionado por la EMA 200 semanal, tras el rechazo podría reiniciar la caída, los valores de almacenamiento y semiconductores que subieron fuertemente anoche comenzaron a caer en la sesión nocturna

marsbitAyer 08:33

Trading

Spot
活动图片





