XRP Price Final Low: Here’s The Target To Watch For Next Recovery

bitcoinistPublicado a 2025-09-27Actualizado a 2025-09-27

Resumen

Crypto analyst CasiTrades has indicated that the XRP price could drop to a final low before it begins its next...

Trusted Editorial content, reviewed by leading industry experts and seasoned editors. Ad Disclosure

Crypto analyst CasiTrades has indicated that the XRP price could drop to a final low before it begins its next leg to the upside. In line with this, she highlighted the target to watch out for as altcoin looks to end this downtrend and begin its recovery. 

Level To Watch As XRP Price Eyes Final Low

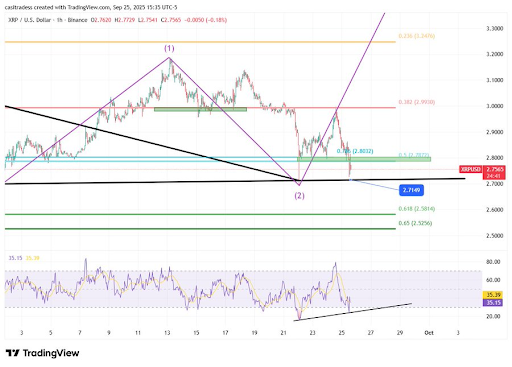
CasiTrades revealed in an X post that $2.715 might mark the final low for the XRP price before it begins its wave 3 impulsive move to the upside. She noted that the price level is the bottom trendline of the consolidation and, importantly, would still not make a new low in the correction. This came as the analyst highlighted that altcoin had faced a significant rejection at the $3 resistance. 

Furthermore, the XRP price also lost its major .5 fib support at $2.79 and even retested it as resistance. She added that the rejection was sharp and that the Relative Strength Index (RSI) is reflecting strong pressure, which suggests that the market may need to drop to lower levels for this correction to be over. This is why she believes that token may still fall to $2.715. 
XRP
Source: Chart from CasiTrades on X

Meanwhile, CasiTrades explained that the price is now forming a divergence on the higher timeframes but that the smaller timeframes haven’t fully exhausted yet. She stated that this suggests that the larger move down is unfolding as a 5th wave, but it hasn’t finished just yet, which is why the altcoin could drop lower. 

The analyst added that some altcoins, such as Ethereum and DOGE, have already reached their bottom targets. Meanwhile, others, including the XRP price, require one last dip to fully exhaust the selling pressure before sentiment can shift bullish. 

Key Signs To Watch For The Altcoin

As part of the key signs to watch, CasiTrades noted that the 1-hour RSI has printed a bullish divergence and is holding a clear trendline. She claimed that a final drop to this price level would help confirm exhaustion. Meanwhile, the altcoin price reclaiming $2.79 by the daily close would be a strong signal, especially if it flips it back into support. 

The crypto analyst assured that the current XRP price action isn’t weakness but a shakeout. She added that tight consolidation, then volatility, and now exhausted selling are the perfect conditions needed for the next major breakout and a fresh market trend. However, crypto analyst Ali Martinez suggested that XRP could drop way lower than the projected bottom at $2.715, noting that there is a gap between $2.73 and $2.51.

At the time of writing, the XRP price is trading at around $2.78, up in the last 24 hours, according to data from CoinMarketCap.

XRP
XRP trading at $2.77 on the 1D chart | Source: XRPUSDT on Tradingview.com
Featured image from Getty Images, chart from Tradingview.com
Editorial Process for bitcoinist is centered on delivering thoroughly researched, accurate, and unbiased content. We uphold strict sourcing standards, and each page undergoes diligent review by our team of top technology experts and seasoned editors. This process ensures the integrity, relevance, and value of our content for our readers.

Scott Matherson is a leading crypto writer at Bitcoinist, who possesses a sharp analytical mind and a deep understanding of the digital currency landscape. Scott has earned a reputation for delivering thought-provoking and well-researched articles that resonate with both newcomers and seasoned crypto enthusiasts. Outside of his writing, Scott is passionate about promoting crypto literacy and often works to educate the public on the potential of blockchain.

Lecturas Relacionadas

Musk anticipa $50 billones: ¿hay un límite para la deuda pública de Estados Unidos y qué pasará después?

Elon Musk comentó brevemente "Cronograma exacto" en X el 20 de agosto de 2026, reaccionando a un gráfico que pronosticaba que la deuda pública de EE.UU. alcanzaría los $50 billones para 2030. Ese mismo día, la deuda ya superaba los $40 billones. Aunque históricamente los hitos redondos de deuda no han desencadenado crisis inmediatas, el problema actual radica en su costo de servicio. En 2026, los pagos de intereses ($963 mil millones en 10 meses) superaron por primera vez el gasto en defensa, y la tasa promedio de la deuda (3.3%) está convergiendo con la tasa de crecimiento económico. El economista Ray Dalio advirtió que, de continuar esta trayectoria, EE.UU. podría enfrentar una crisis de deuda en "tres años, más o menos dos". Según la Oficina de Presupuesto del Congreso, el punto crítico llegará alrededor de 2031, cuando el costo del servicio de la deuda supere permanentemente el crecimiento económico, iniciando una "espiral de deuda". El artículo explora tres posibles escenarios de ajuste: 1) represión financiera e inflación moderada (el camino "japonés", considerado el más probable), 2) consolidación fiscal severa (el camino "griego"), o 3) una reestructuración o default técnico, altamente improbable pero catastrófico. El límite real de la deuda no es una cifra como los $50 billones, sino la confianza en el dólar como activo refugio. En resumen, la amenaza no es la cifra nominal de la deuda, sino la dinámica creciente de su costo, que podría llevar a décadas de estancamiento o inflación persistente, en lugar de un colapso repentino.

cryptonews.ruHace 1 hora(s)

Musk anticipa $50 billones: ¿hay un límite para la deuda pública de Estados Unidos y qué pasará después?

cryptonews.ruHace 1 hora(s)

¿Por qué Bitcoin realmente subió tanto? ¿Es suficiente un ciclo de cuatro años? Aquí la opinión de Caitlyn Long

Después del repentino y fuerte repunte de los mercados de criptomonedas, Caitlin Long, fundadora y directora ejecutiva de Custodia Bank, analizó la actividad reciente en el mercado de Bitcoin y en los mercados financieros en general. Long atribuyó el fuerte aumento a razones macroeconómicas y a las acciones del Tesoro de EE. UU., específicamente a su anuncio de más que duplicar las recompras de bonos del Tesoro a largo plazo (a 30 años), lo que describió como una forma de "control de la curva de rendimiento". Este movimiento provocó un cambio abrupto en las tasas de interés y ejerció presión sobre el dólar estadounidense, debilitándolo. Según Long, un dólar más débil tiende a apoyar a los activos de riesgo, lo que impulsó el repunte de las principales criptomonedas como Bitcoin y Ethereum. Respecto al debate sobre si el "ciclo de 4 años" ha terminado, Long sostuvo que los gráficos y los datos fundamentales indican que el ciclo continúa. Explicó que los procesos dinámicos clave en la economía minera no han cambiado, y que la disminución de la rentabilidad y la salida del mercado debido a los altos costos de energía y potencia de cálculo son una parte natural del ciclo. Long se abstuvo de hacer pronósticos de precios, pero señaló que, basándose en experiencias pasadas, Bitcoin parece barato en los niveles actuales.

cryptonews.ruHace 4 hora(s)

¿Por qué Bitcoin realmente subió tanto? ¿Es suficiente un ciclo de cuatro años? Aquí la opinión de Caitlyn Long

cryptonews.ruHace 4 hora(s)

Trading

Spot
活动图片