Bitcoin “Diamond Hands” Start To Break As 1yr+ Supply Ramps Up Selling

newsbtcPublicado a 2022-06-22Actualizado a 2022-06-22

Resumen

Data shows the Bitcoin supply older than 1 year has shown accelerating movement recently, suggesting even the crypto's stronger hands are feeling the fear in the market. Bitcoin Diamond Hands...

Data shows the Bitcoin supply older than 1 year has shown accelerating movement recently, suggesting even the crypto’s stronger hands are feeling the fear in the market.

Bitcoin Diamond Hands Are Starting To Budge In Current Market

According to the latest weekly report from Glassnode, BTC’s older supply has been observing selling in recent days.

The relevant indicator here is the “revived supply last active 1+ years,” which measures how many coins that have been sitting still since at least one year ago are seeing movement per day.

When the value of this metric spikes up, it means a large amount of coins belonging to Bitcoin hodlers are being moved at the moment.

Such a trend, when prolonged over a period, may be bearish for the crypto’s price as this kind of movement can imply the diamond hands in the market have been selling.

On the other hand, low values of the metric imply there hasn’t been any significant movement in the supply older than one year recently.

This trend shows hodlers are holding strong on to their coins, a sign that could be either neutral or bullish for the coin’s value.

Now, here is a chart that shows the trend in the revived Bitcoin supply last active 1+ year ago over the past 12 months:

Bitcoin Revived Supply Last Active 1+ Year

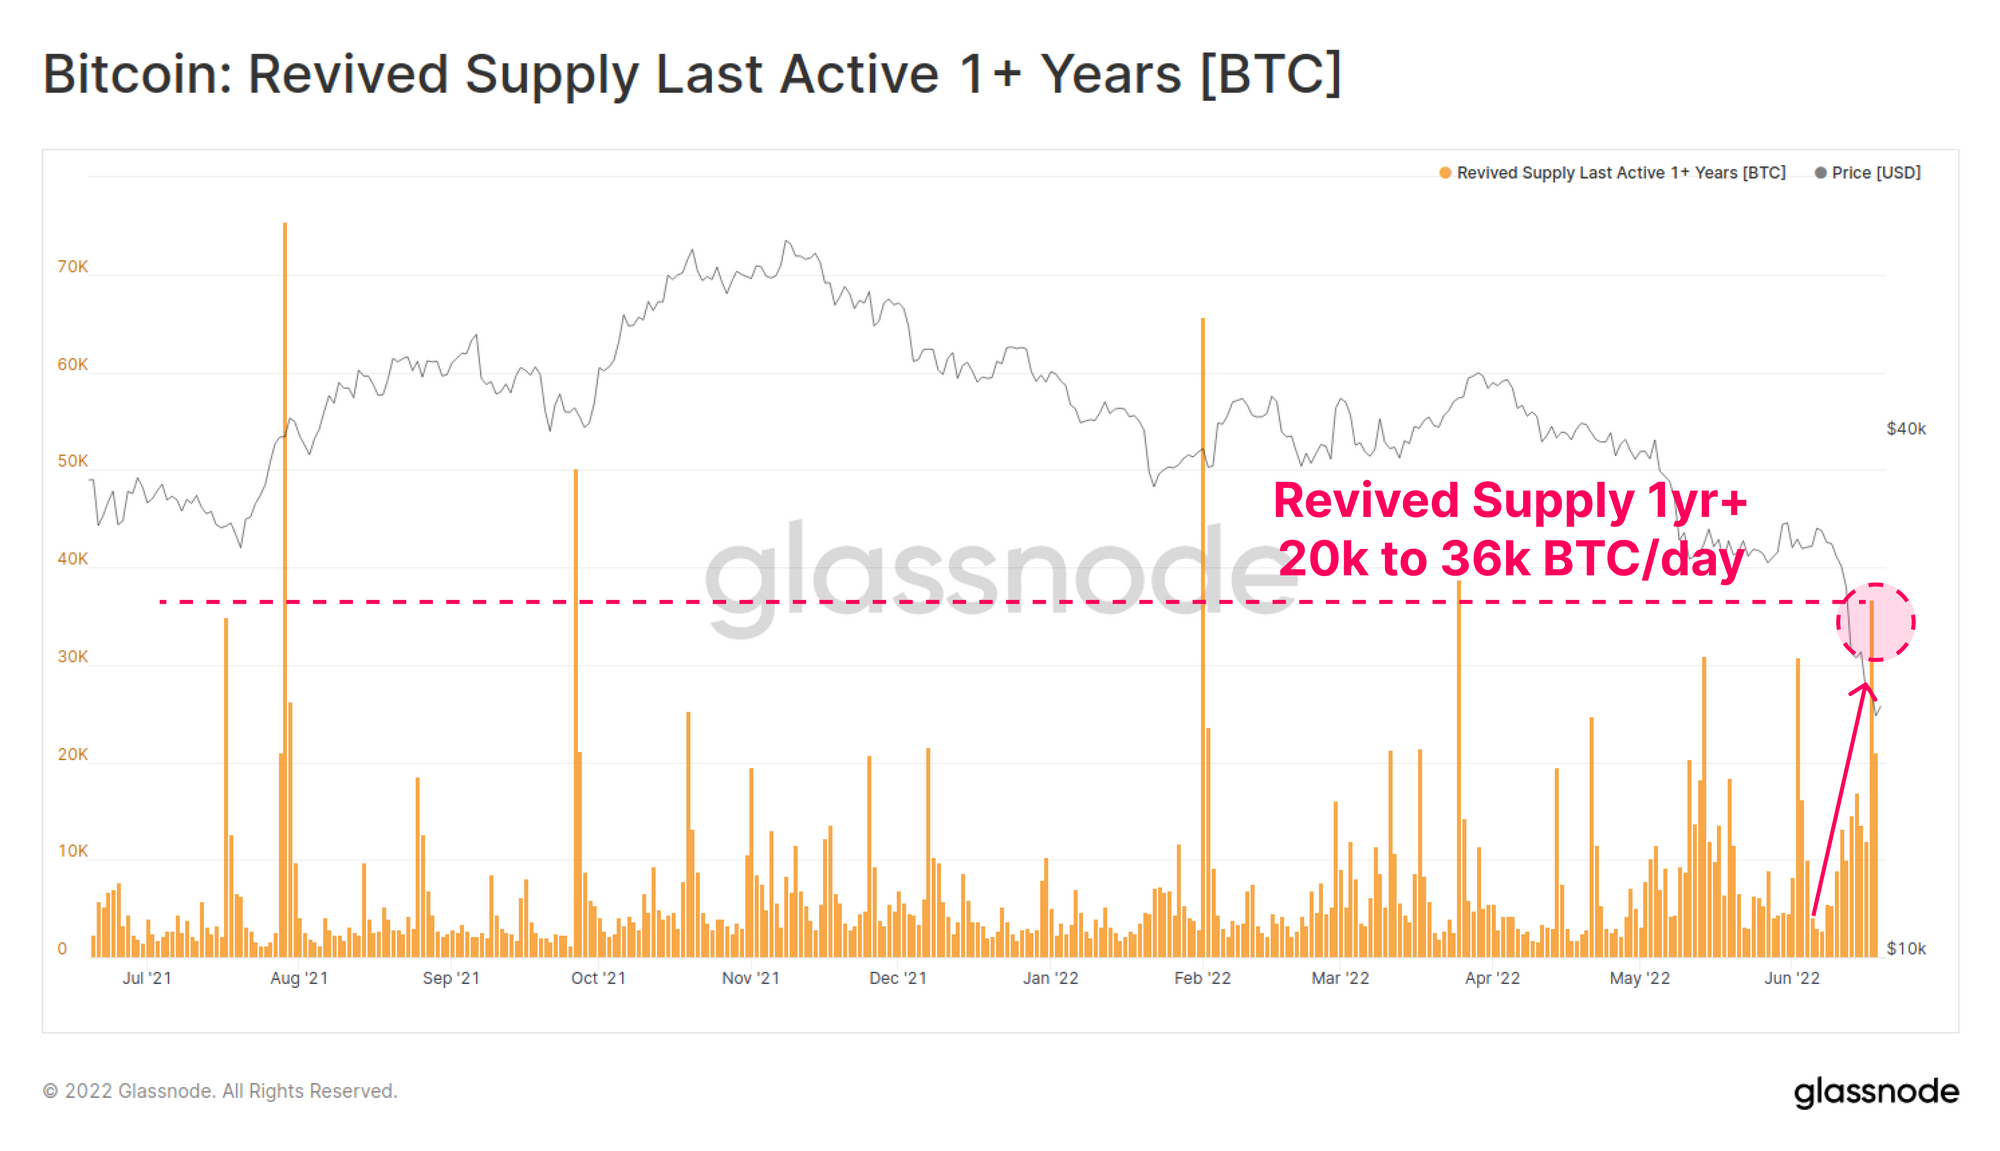
The value of the indicator seems to have been high recently | Source: Glassnode's The Week Onchain - Week 25, 2022

As you can see in the above graph, a large amount of coins last active more than a year ago showed movement in recent days.

Also, not just that, this spending of old coins has been rather accelerating, now reaching a value of 20k to 36k BTC per day.

This implies that these long-term holders have been ramping up their selling in the last few days as the price of the crypto has struggled.

The trend suggests that the recent crash has put fear and panic among even the stronger of Bitcoin hands, who are usually the last to budge during selloffs.

If the selling of coins older than one year continues on, then BTC could observe further downtrend in the near future.

BTC Price

At the time of writing, Bitcoin’s price floats around $21k, down 5% in the last seven days. Over the past month, the crypto has lost 28% in value.

The below chart shows the trend in the price of the coin over the last five days.

Bitcoin Price Chart

Looks like the value of the crypto has been steadily rising over the last few days | Source: BTCUSD on TradingView

Lecturas Relacionadas

Los honorarios diarios de XRP Ledger caen por debajo de los 400 dólares mientras resurge el debate sobre la actividad de la red

El libro mayor de XRP vuelve a ser analizado después de que datos de tarifas mostraran que las comisiones diarias de la red cayeron por debajo de los 400 dólares. Aunque las tarifas bajas son un diseño fundamental de XRPL y suelen considerarse una fortaleza, la generación de comisiones también puede utilizarse como indicador de la actividad, la demanda y el uso de transacciones pagadas en la red. La quema semanal de aproximadamente 3.100 dólares subraya el contraste con cadenas de altas comisiones como Ethereum y Bitcoin. Para los partidarios, las tarifas bajas significan que XRPL sigue siendo eficiente y accesible, mientras que para los críticos, una generación de tarifas muy baja puede plantear dudas sobre si la red está experimentando suficiente demanda de alto valor en relación con su capitalización de mercado y su narrativa de pagos de larga data. Esta tensión es la que hace que los datos importen. La historia de XRP a menudo depende de los pagos, la liquidez y la adopción empresarial; los datos de tarifas en cadena ofrecen a los operadores una forma de evaluar si la red está viendo actividad transaccional significativa. Es importante no exagerar la conclusión: un día de tarifas bajas no significa que la red esté fallando, sino que agrega un punto de datos al debate sobre el uso de XRPL. También crea un contraste útil con el impulso más amplio de Ripple hacia RLUSD, pagos con agentes de IA e infraestructura de liquidación empresarial. Se debe observar si la cifra de tarifas se recupera, si los recuentos de transacciones cuentan una historia diferente y si exploradores nativos como Bithomp confirman la misma tendencia. La historia pertenece a la conversación diaria del mercado, destacando cómo las fuertes narrativas en cripto provienen cada vez más de datos en cadena y actualizaciones de protocolos, no solo de comentarios.

bitcoinistHace 37 min(s)

Los honorarios diarios de XRP Ledger caen por debajo de los 400 dólares mientras resurge el debate sobre la actividad de la red

bitcoinistHace 37 min(s)

Trading

Spot
Futuros
活动图片