Original Author: @c4lvin, Four Pillars
Original Compilation: AididiaoJP, Foresight News
Core Conclusion
If you invested $100 in each of the 59 new tokens listed for Korean Won (KRW) trading pairs on Upbit in 2025, as of March 11, 2026, the value of this portfolio would be only 31% of the original investment (i.e., each dollar dropped to $0.31). Bithumb (144 tokens) performed identically, also at 31%; Binance (92 tokens) was slightly lower at 29%. All three major exchanges resulted in approximately a 70% loss of capital.
Of the 59 tokens listed on Upbit, only two ultimately turned a profit: KITE (up 232.8%) and BARD (up 9.3%). Bithumb performed slightly better, with 8 out of 144 tokens maintaining positive returns. The median return on Upbit was -80.9%, while on Bithumb it was -82.1%.
For the 50 tokens listed on both major Korean exchanges, their average return (-69.4%) was almost identical to that of the 94 tokens listed only on Bithumb (-68.9%). This data indicates that listing on multiple major exchanges does not guarantee subsequent price performance.
Research Background
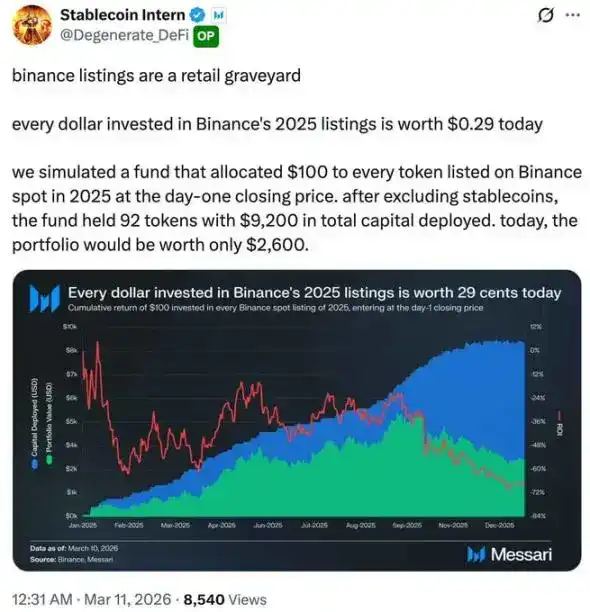
The inspiration for this analysis came from a data chart published today by Messari research analyst @Degenerate_DeFi.
Data Source: @Degenerate_DeFi
The chart shows that if you invested $100 in each of the 92 new tokens listed on Binance in 2025, as of today, each dollar invested is worth only $0.29. This means that out of a total investment of $9,200, the cumulative loss reached 71.7%, leaving a remaining value of approximately $2,600.
As the world's largest cryptocurrency exchange by trading volume, Binance's listing standards are generally considered stricter than those of smaller platforms, and its liquidity advantage is unparalleled. If the data from Binance looks like this, what about the situation on Korean exchanges? The Korean market is retail-investor dominated, with trading patterns significantly different from the global market. Do these differences affect the performance of newly listed tokens? Or will the data ultimately reveal similar patterns?
This article will adopt the same methodology as the Binance analysis to systematically analyze all tokens that gained Korean Won trading pairs on Upbit and Bithumb throughout 2025.
Research Methodology
Scope Definition and Screening Criteria
This study covers all tokens that had new KRW market trading pairs added on Upbit and Bithumb between January 1, 2025, and December 31, 2025. This includes 59 tokens on Upbit and 144 tokens on Bithumb. For tokens listed in 2025 but subsequently delisted, such as Elixir (ELX), Strike (STRIKE), and AI16Z, this study treats them as complete losses.
The investment simulation rules follow the unified framework used in Messari's analysis of Binance listings. We assume an investment of $100 at the closing price on the first day of listing for each token and hold until the present without any selling. By tracking the cumulative value and return rate of this portfolio daily, a time-series dataset is constructed.
Choosing the first day's closing price as the entry point was a deliberate decision. On Korean exchanges, the opening price on the first day is often significantly inflated due to extreme volatility and speculative buying. Using the closing price effectively filters out this short-term noise.
Data Collection
Price data was obtained directly through the public REST APIs of each exchange. For Upbit, we used the daily candlestick (K-line) interface to collect complete daily OHLCV data for each token from its listing date until March 11, 2026, and cross-verified the current price using the ticker interface (/v1/ticker). For Bithumb, the 24-hour K-line interface was used to gather data for the same period. To simplify the model, this study did not consider exchange rate fluctuations between the US Dollar and the Korean Won.
Overall Performance
The chart below visually presents the simulation results. Subsequent sections will provide a detailed interpretation and analysis of this data.
Comparison of the Three Major Exchanges
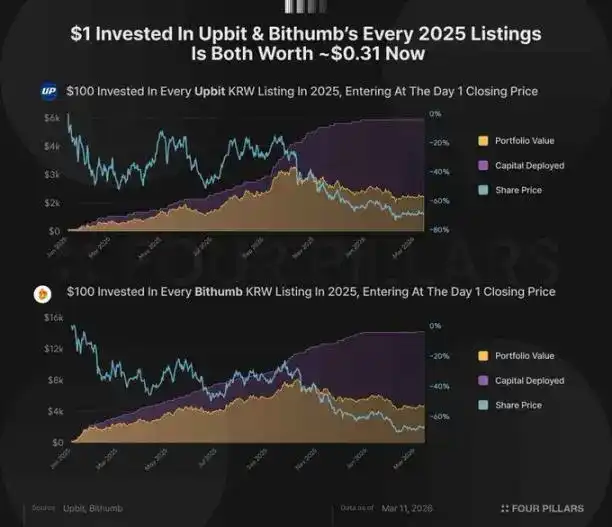
The performance comparison of new tokens listed in 2025 on the three major exchanges is as follows:
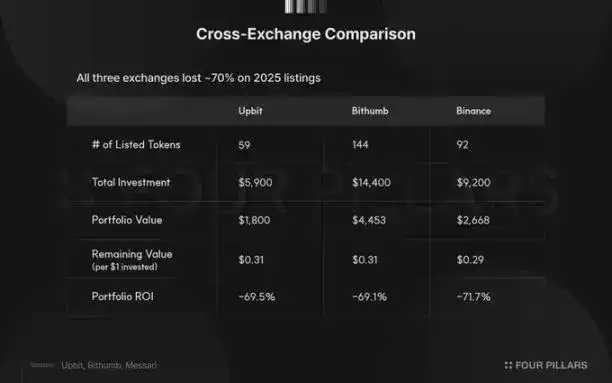
All three exchanges recorded losses of approximately 70%. Upbit (-69.5%) and Bithumb (-69.1%) performed almost equally, with Binance (-71.7%) also being very similar. Regardless of which exchange was chosen, investors buying new tokens at the first day's closing price lost about seventy percent of their initial capital on average.
Return Distribution Characteristics
The overall average is not enough to reveal the differences in individual token performance. The following breaks down the returns of each token in detail by interval:
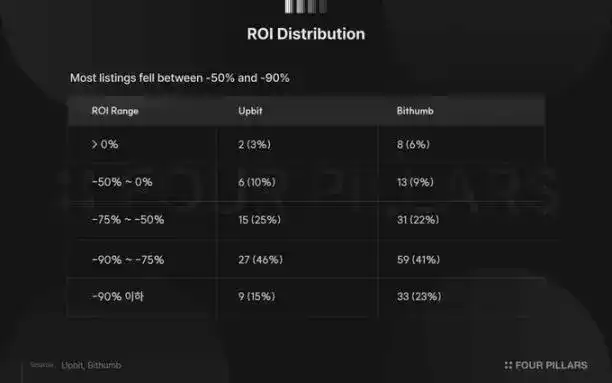
On both exchanges, over 40% of the tokens were concentrated in the loss interval of -75% to -90%. On Upbit, this interval accounted for 46%, with an additional 9 tokens (15%) suffering extreme losses exceeding 90%. Only two tokens ultimately achieved positive returns: Kite (KITE, up 232.8%) and Lombard (BARD, up 9.3%).
Bithumb's return distribution was more dispersed. It had a higher number of profitable tokens, totaling 8, but also had 33 tokens that experienced extreme losses exceeding 90%. This dispersion is partly due to the larger sample size of 144 tokens, but it also reflects that Bithumb's listing strategy covers a wider range of project types compared to Upbit.
The median return reveals a harsher reality: -80.9% for Upbit and -82.1% for Bithumb, both lower than their respective averages. This indicates that a few relatively resilient tokens pulled up the overall average, and the typical performance of newly listed tokens is actually more dismal than the surface data suggests.
Impact of Listing Timing on Performance
To examine whether the timing of listing affects subsequent results, we divided the data into two periods: the first half (January to June) and the second half (July to December) for comparison.
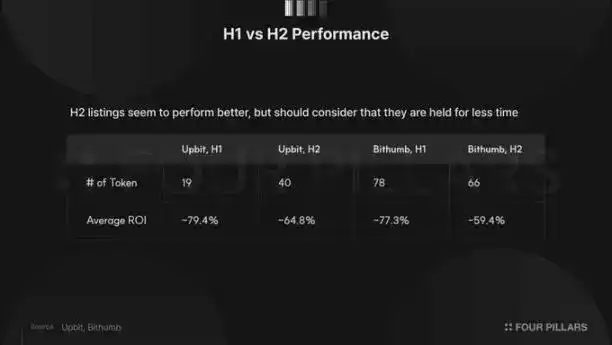
The data shows that tokens listed in the second half performed better on both exchanges. This phenomenon is intuitive: tokens listed earlier in the year experienced a longer period of decline. Given that the overall crypto market was in a downtrend in 2025, the longer the holding period, the higher the natural probability of accumulating greater losses.
It is worth noting that the performance gap between the two halves is quite significant. On Bithumb, the difference in returns between tokens listed in the first half (-77.3%) and those listed in the second half (-59.4%) is about 18 percentage points, a difference that cannot be explained by time factor alone. Possibilities include: tokens listed in the second half indeed had stronger fundamental support, or market expectations had become more rational due to the lessons learned in the first half.
The Paradox of Choice
Relationship Between Number of Listings and Performance
Throughout 2025, Upbit added 59 new KRW trading pairs, while Bithumb added 144. Bithumb's number is more than double that of Upbit and also significantly exceeds Binance's 92. Upbit is renowned for having the strictest listing standards among Korean exchanges. However, despite the vast difference in the number of listings, the portfolio returns of the two exchanges are almost identical: -69.5% for Upbit and -69.1% for Bithumb.
Analysis of Cross-Listed Tokens
To investigate further, we compared the performance of tokens listed on both exchanges with those listed only on Bithumb. The data shows that 50 tokens were listed on both Upbit and Bithumb.
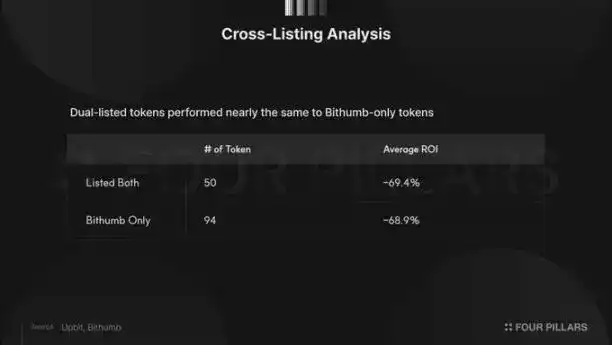
Logically, projects that manage to list on both major exchanges should possess a certain degree of industry recognition. However, the average return of these 50 tokens (-69.4%) is almost exactly the same as that of the 94 tokens listed only on Bithumb (-68.9%).
This finding leads to two conclusions:
First, listing on multiple major exchanges does not provide any guarantee for subsequent price performance.
Second, the first-day price inflation triggered by the listing event is a structural phenomenon, and its occurrence is unrelated to how much attention the project itself receives.
Whether a token has the "honor" of being listed on Upbit as well, or is quietly listed only on Bithumb, the losses ultimately borne by first-day buyers show no significant difference.
Analysis of the Few Survivors
Among the 59 tokens listed on Upbit, only KITE (up 232.8%) and BARD (up 9.3%) ultimately achieved positive returns. Only 8 tokens limited their losses to within 50%.
The 8 profitable tokens on Bithumb constitute a more diverse sample.
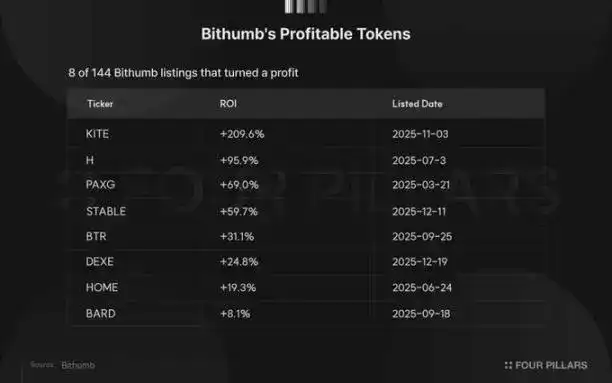
KITE recorded a gain of 209.6%, a significant outlier. However, it should be noted that this token has only been listed for four months; interpreting its performance as a sustainable long-term outcome is premature. STABLE and DEXE also require cautious viewing due to their short tracking record of only three months.
The case of PAXG is more instructive. As a token pegged 1:1 to the spot price of gold, its 69.0% gain was entirely driven by the steady rise in gold prices throughout 2025. This performance has nothing to do with cryptocurrency market fundamentals; it is merely a reflection of macro gold trends. In other words, the most reliable way to achieve profit on Bithumb was ironically not to invest in a cryptocurrency project itself.
Conclusion
This study concludes that the performance of newly listed tokens on Korean exchanges in 2025 is not fundamentally different from that on Binance at a structural level. Although the Korean market is characterized by a high proportion of retail participation, listing strategies vary among exchanges, and the regulatory environment is distinct, the average loss for first-day buyers converges around 70% across all three major exchanges.
We believe the core insight revealed by this data is: the root of the problem lies not in the listing standards of a specific exchange, nor in the quality of individual tokens, but in the structural dynamics inherent to the listing event itself. When a token is newly listed on a major exchange, concentrated retail demand pushes up the price on the first day. Over time, the price naturally regresses, causing losses for first-day buyers. The convergent performance of tokens listed on both exchanges and those listed on only one further confirms that these losses are not due to a specific exchange or token, but are a structural feature of the listing event.
It is important to note that this study measures the performance of one specific strategy: buying at the first day's closing price and holding until now. Strategies that utilize short-term price fluctuations in the days following the listing, or strategies that enter the market after a significant price correction, might yield completely different conclusions. However, such strategies require extremely precise timing, which is far removed from the actual behavior of most retail investors.
The data from 2025 provides a clear message: buying a token simply because it is newly listed on a major exchange is a systematically losing strategy, regardless of which exchange is chosen. This phenomenon is not unique to the Korean market; it is a global structural issue. The reason is not that exchanges are selecting inferior projects, but that the listing event itself creates a dynamic of concentrated demand that is persistently unfavorable to first-day buyers.