Bitcoin Price Forecast: Is Bitcoin's Resistance Band About to Break Through or Be Rejected for the Sixth Time?

cryptonews.ruPublished on 2026-07-27Last updated on 2026-07-27

Abstract

Bitcoin is trading around $65,457, consolidating between a key bear market resistance line (rejecting price since February) and its cluster of EMAs around $64,475-$65,045. Key resistance is at the upper Bollinger Band at $66,578, with further resistance at the 100-day EMA ($67,717). Support lies at the EMAs and the lower Bollinger Band at $62,243. A potential bullish catalyst is Iran's signal for a ceasefire, which could reduce geopolitical risk. Analyst Benjamin Cowen draws parallels to 2018, warning of a potential rejection and August-September decline if the resistance isn't broken. Anthony Scaramucci remains long-term bullish, citing Bitcoin's advantages over gold. The outlook hinges on whether BTC can close above the $66,578 resistance or faces another rejection.

Bitcoin is trading at $65,457 on July 27, up 0.18%, following Iran signaling a willingness to halt hostilities, simultaneously putting pressure on the bearish market resistance band that has capped all upside attempts since February.

$BTC is squeezed between the bear market resistance band and its EMA cluster.
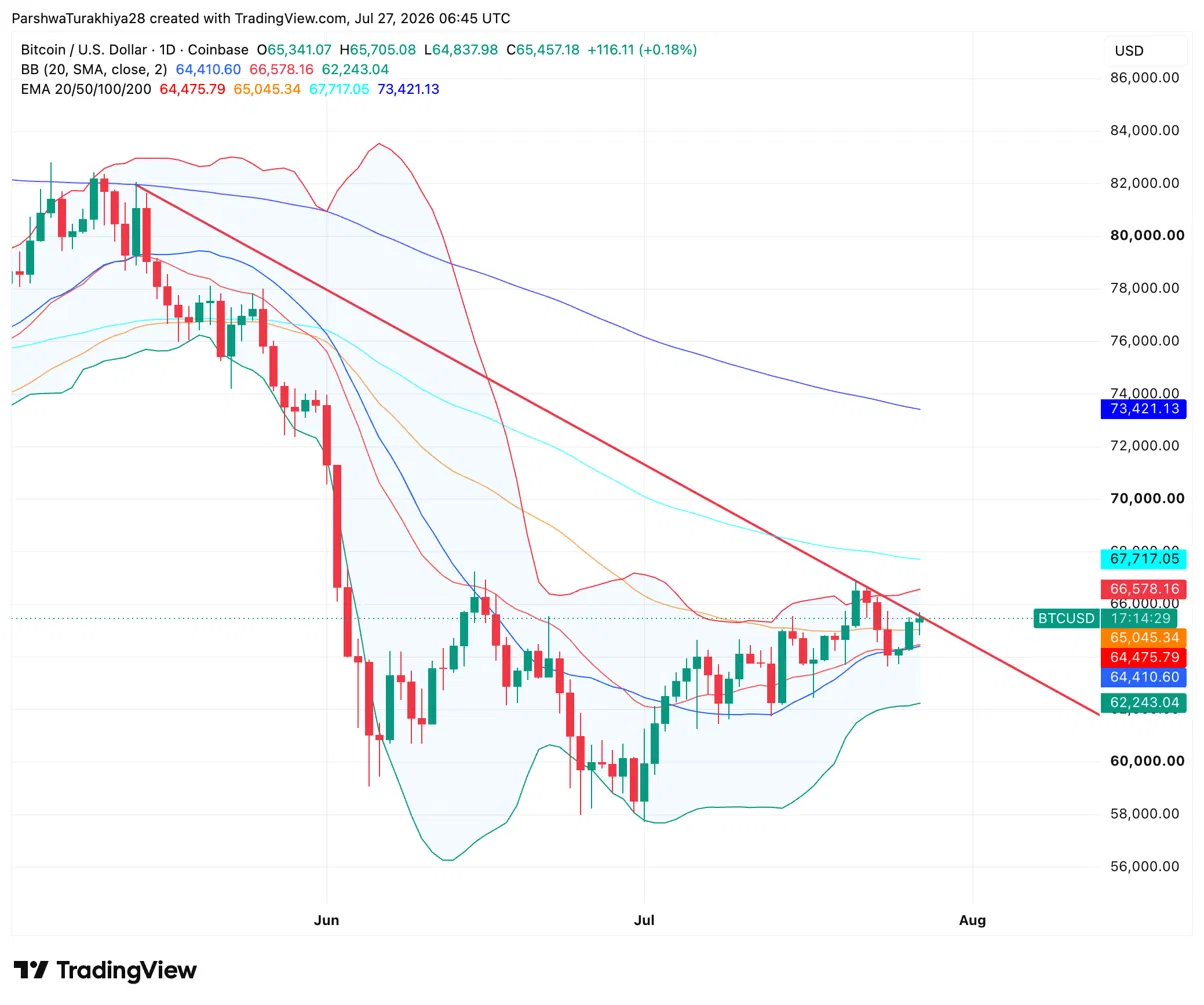
$BTC price chart 1D (Source: TradingView)

The daily chart shows $BTC consolidating between the 20-day EMA at $64,475 and the upper Bollinger Band at $66,578, with a descending red trendline from the May peak passing through the same zone. This trendline is Benjamin Cowen's bear market resistance band, and it has rejected the price on every approach since February. The 50-day EMA at $65,045 aligns almost exactly with the current price, making the EMA cluster an immediate support test.

Related: Cardano Price Forecast: Can ADA Break $0.20 Amid Ark Invest vs. Hoskinson Clash Over Its Significance?

The Bollinger Middle Line at $64,410 and the 20-day EMA at $64,475 form a narrow support zone just below. A close above the upper Bollinger Band at $66,578 and the descending trendline would be the first real signal of a breakout recovery. Above that, the next target is the 100-day EMA at $67,717, with the 200-day EMA at $73,421 as the long-term ceiling. The lower Bollinger Band at $62,243 defines the lower floor if support gives way.

What are the key support and resistance levels for $BTC today?

  • Support at $65,045 on the 50-day EMA and $64,475 on the 20-day EMA
  • Resistance at $66,578 on the upper Bollinger Band and the descending bear market resistance band
  • Extended resistance at $67,717 on the 100-day EMA
  • Key low at $62,243 on the lower Bollinger Band

Iran's ceasefire signal could be the needed macro-market unlock

Analyst Michaël van de Poppe reported on July 26 that Iran has indicated it will halt attacks provided the US suspends military operations.

Van de Poppe characterized this as a great sign for Bitcoin and crypto markets and called for a green week. Geopolitical tensions since June have been a persistent headwind for risk assets, with spikes in oil prices and uncertainty in the Strait of Hormuz repeatedly unsettling sentiment at key technical levels.

Benjamin Cowen sees a replay of 2018 with August declines

Cowen's latest video shows Bitcoin's 2026 structure relative to 2018: a February low, a high low in late March, the June low range in early July, and the current rally back to the bear market resistance band.

In 2018, this rally lasted until late July before giving back all gains in August and September. His base case is the same outcome: Q4 forms the market cycle bottom where on-chain indicators historically reset. His turnaround condition remains unchanged: if $BTC doesn't break out by year-end, he calls the bull market back on.

Anthony Scaramucci says $10 trillion is Bitcoin's next stop

Speaking on The Wolf of All Streets podcast, Scaramucci noted that Bitcoin's $1.2 trillion market cap is roughly the size of Micron Technology, arguing that a $10 trillion valuation still wouldn't be proportionate to global capital markets. He used gold's $28 trillion market cap as a benchmark, calling Bitcoin more scarce, more portable, and easier to move than the metal it increasingly competes with. He characterized the current environment as apathy, not a structural breakdown, drawing a parallel to Uber, where technologies that truly serve people eventually win, regardless of who tries to block them.

Related: Espresso Price Forecast: Bullish Momentum Builds as ESP Aims for $0.1208 Following 42% Weekly Rally

Regarding the clarity bill, Scaramucci flatly stated he does not see it passing, not out of pessimism but due to how Washington actually works. He argued Democrats have every incentive to block the bill simply to deny Trump a victory, irrespective of the bill's merits. He cited former SEC Chairman Paul Atkins as a steady hand but warned that without legislation, crypto regulation remains a pendulum swinging at the whim of those in power.

Bitcoin Price Forecast: Upside and downside targets

  • Upside case: Iran's ceasefire signal holds, $BTC closes above the upper Bollinger Band at $66,578 and the bear market resistance zone, the FOMC confirms a hold on rates on July 29, and van de Poppe's green week pushes towards the 100-day EMA at $67,717 amid a declining geopolitical risk premium.
  • Downside case: Cowen's 2018 analog plays out on the chart, $BTC is rejected at the bear market resistance zone, the 50-day EMA at $65,045 fails to hold support, and price drops towards the Bollinger Middle Line at $64,410 and the 20-day EMA at $64,475 as August seasonal weakness sets in.
end-content

Trending Cryptos

Related Questions

QWhat are the key support and resistance levels for Bitcoin mentioned in the article, based on the daily chart?

AKey support levels are at the 50-day EMA of $65,045 and the 20-day EMA of $64,475. Key resistance is at the upper Bollinger Band and the bear market resistance band around $66,578. Extended resistance is at the 100-day EMA of $67,717. The key floor is the lower Bollinger Band at $62,243.

QWhat geopolitical event does the article suggest could act as a positive catalyst for Bitcoin's price?

AThe article suggests that Iran signaling a readiness to suspend attacks, conditional on the US halting military operations, could be a positive macro catalyst for Bitcoin and crypto markets, potentially reducing geopolitical risk premiums.

QAccording to Benjamin Cowen's analysis, what historical pattern is Bitcoin's 2026 structure mirroring, and what is his base case outcome?

ABenjamin Cowen's analysis shows Bitcoin's 2026 structure mirroring 2018: a February low, a high low in late March, June lows retested in early July, and a rally back to the bear market resistance band. His base case is a similar outcome where the rally lasts until late July, followed by a pullback in August and September, with Q4 forming the market cycle bottom.

QWhat is Anthony Scaramucci's long-term outlook for Bitcoin's market capitalization, and what asset does he use as a benchmark?

AAnthony Scaramucci's long-term outlook is that Bitcoin's market cap could reach $10 trillion. He uses gold's market cap of $28 trillion as a benchmark, arguing Bitcoin is scarcer, more portable, and easier to move than the precious metal it increasingly competes with.

QWhat are the article's outlined 'Upside Case' and 'Downside Case' scenarios for Bitcoin's price movement?

AUpside Case: The Iran ceasefire signal holds, BTC closes above the $66,578 resistance (upper Bollinger Band & bear market band), the Fed holds rates on July 29, and a 'green week' propels price toward the 100-day EMA at $67,717. Downside Case: Cowen's 2018 analog plays out, BTC is rejected at the bear market band, support at the 50-day EMA ($65,045) fails, and price descends toward the $64,410-64,475 support zone (Bollinger midline & 20-day EMA) amid August seasonal weakness.

Related Reads

Breaking: Google Earth Urgently Pulls Back Nano Banana 2 Image Generation Feature!

Google Earth's newly launched "Create image" feature, powered by the Nano Banana 2 AI image generation model, was abruptly withdrawn shortly after its release due to being "played" by users. The feature allowed users to generate and overlay AI-created visuals directly onto real-world satellite and 3D maps in Google Earth. The tool enabled creative applications like historical recreations (e.g., visualizing ancient Pompeii), generating informational graphics for landmarks, and envisioning architectural projects or futuristic cityscapes on real terrain. It operated under "geospatial grounding," meaning the AI respected the underlying geography, topography, and perspective of the chosen map view. The model also integrated with Gemini to retrieve relevant factual information. However, upon release, users quickly tested its limits. A prominent example involved reimagining Philadelphia's historic Independence Hall as a post-apocalyptic ruin overrun by "happy" zombies, evil clowns, and giant alien mechs. This highlighted both the feature's playful potential and its risks regarding the generation of inappropriate or misleading content on realistic maps, leading to its swift temporary removal. Google stated it would re-release the feature after implementing "enhanced guardrails." Analysts note this move strategically leverages Google's vast proprietary geospatial data, positioning its AI not just for artistic generation but for spatially accurate world visualization—a unique advantage in the competitive AI image generation landscape.

marsbit40m ago

Breaking: Google Earth Urgently Pulls Back Nano Banana 2 Image Generation Feature!

marsbit40m ago

Altman Admits: Overestimated AI Snatching Jobs! Huang Renxun: The Unemployment Narrative Is Completely Backwards

Sam Altman has revised his earlier predictions about AI rapidly replacing jobs, admitting he overestimated the speed at which AI would eliminate entry-level white-collar roles. Speaking on the "Invest Like the Best" podcast, he stated that people do not truly want an AI CEO, as accountability and human connection remain critical. He found that individuals prefer interacting with people who can be held responsible for decisions. Similarly, NVIDIA's Jensen Huang argued that the narrative of AI destroying jobs is misguided. He distinguishes between tasks and jobs, noting that while AI can automate specific tasks, entire jobs—encompassing communication, judgment, coordination, and accountability—are not eliminated. He cited examples like radiologists and software engineers, where demand for these roles has increased as AI handles repetitive tasks, allowing for business expansion and the creation of more positions. Data from a University of Maryland and LinkUp study supports this, showing that U.S. job postings for new graduates have actually risen, countering the fear of vanishing entry-level roles. However, a significant shift is occurring: the traditional entry-level tasks that help newcomers gain experience are being automated, making initial career access more challenging. The key insight is that as AI takes over standardized tasks, the enduring value of human work shifts toward areas of responsibility, trust-building, and final decision-making—aspects that AI cannot replicate. The real "moat" for professionals lies in these irreplaceable human elements.

marsbit46m ago

Altman Admits: Overestimated AI Snatching Jobs! Huang Renxun: The Unemployment Narrative Is Completely Backwards

marsbit46m ago

Weekly Editor's Picks (0725-0731)

Weekly Editor's Picks (0725-0731) provides a curated selection of deep analysis, filtering out market noise. Key themes from this week include: **Macro & Policy:** The Federal Reserve's upcoming meeting is marked by high uncertainty, balancing cooling inflation data against persistent price pressures. Meanwhile, the U.S. crypto regulatory Clarity Act faces critical political hurdles, with its 2026 passage probability seen as low. **Investing & Crypto:** Analysis suggests long-term crypto success depends on conviction through volatile cycles, focusing on assets like Bitcoin and core smart contract platforms. A trend noted is the increasing similarity between global equity markets (especially tech) and crypto, driven by narrative and leverage. Several major crypto protocols show strong revenue growth, but this isn't always translating to token price appreciation due to sell pressure and structural factors. **AI & Semiconductors:** Nvidia's rising credit default swap rates signal market concern over AI infrastructure financing risks. The storage sector experienced volatility as markets began pricing in potential 2027 oversupply. Despite a record profitable quarter, SK Hynix's results were deemed "below expectations," reflecting heightened investor demands for future growth visibility. **Markets & DeFi:** TradeXYZ demonstrated remarkable accuracy in pre-market pricing for a major A股 listing. The token ONDO saw gains, linked to its growing role in the on-chain tokenized stock ecosystem. **Ethereum:** Post-Pectra upgrade, a major structural shift is underway as Lido begins migrating millions of ETH to new validator architectures designed for capital efficiency. **Also Highlighted:** Butian's bullish stock market move; OpenAI's Altman promising major advances; Samsung and SK Hynix securing large AI chip deals; Apple reaching a $5T market cap; and ongoing discussions around exchange security following Poolin's bankruptcy case.

marsbit1h ago

Weekly Editor's Picks (0725-0731)

marsbit1h ago

Low Investment Isn't Apple's Immunity Pass

While Meta and Google face investor scrutiny over ballooning AI capital expenditures, Apple's minimal AI investment has paradoxically become a strength. Its market cap recently reclaimed the global top spot, surpassing $5 trillion. The irony is deep: Apple's own AI efforts have lagged, with "Apple Intelligence" delayed and core talent lost, forcing reliance on partners like Google Gemini and Alibaba's Qianwen. Its Q3 FY2026 (Q2 CY) earnings initially seemed stellar. Revenue hit $109.4B (up 16% YoY), with iPhone and Mac sales, growing 22% and 29% respectively, driving most of the growth. However, the stock fell over 8% post-earnings. The primary concern was a weaker Q4 revenue growth forecast of 9-11%, below expectations, due to looming supply chain constraints. Apple is feeling the indirect cost of the AI boom. Soaring memory and chip prices, fueled by massive data center investments from Microsoft, Amazon, and others, are forcing Apple to raise Mac and iPad prices significantly. The upcoming iPhone launch is also expected to see substantial price hikes. Despite avoiding heavy AI infrastructure spending—its capital expenditures are actually down 28%—Apple cannot escape the industry-wide supply and cost pressures. While Apple's operating cash flow remains robust, its substantial R&D spending (up 32% YoY) has yet to yield major AI breakthroughs. As Tim Cook prepares to step down as CEO, Apple faces a challenging transition: balancing its premium hardware success against the strategic and cost pressures of the AI era it has so far cautiously navigated.

marsbit2h ago

Low Investment Isn't Apple's Immunity Pass

marsbit2h ago

Trading

Spot

Hot Articles

How to Buy BAND

Welcome to HTX.com! We've made purchasing Band Protocol (BAND) simple and convenient. Follow our step-by-step guide to embark on your crypto journey.Step 1: Create Your HTX AccountUse your email or phone number to sign up for a free account on HTX. Experience a hassle-free registration journey and unlock all features.Get My AccountStep 2: Go to Buy Crypto and Choose Your Payment MethodCredit/Debit Card: Use your Visa or Mastercard to buy Band Protocol (BAND) instantly.Balance: Use funds from your HTX account balance to trade seamlessly.Third Parties: We've added popular payment methods such as Google Pay and Apple Pay to enhance convenience.P2P: Trade directly with other users on HTX.Over-the-Counter (OTC): We offer tailor-made services and competitive exchange rates for traders.Step 3: Store Your Band Protocol (BAND)After purchasing your Band Protocol (BAND), store it in your HTX account. Alternatively, you can send it elsewhere via blockchain transfer or use it to trade other cryptocurrencies.Step 4: Trade Band Protocol (BAND)Easily trade Band Protocol (BAND) on HTX's spot market. Simply access your account, select your trading pair, execute your trades, and monitor in real-time. We offer a user-friendly experience for both beginners and seasoned traders.

2.6k Total ViewsPublished 2024.03.29Updated 2026.06.02

How to Buy BAND

Discussions

Welcome to the HTX Community. Here, you can stay informed about the latest platform developments and gain access to professional market insights. Users' opinions on the price of BAND (BAND) are presented below.

活动图片