Kaspa price prediction: Sell-the-news reaction wipes out recent gains

ambcryptoPublished on 2026-06-30Last updated on 2026-06-30

Abstract

Kaspa (KAS) completed its Toccata hard fork on June 30, introducing smart contracts and KRC-20 token support. In anticipation, KAS price rallied 20.38% to $0.032. However, a "sell-the-news" reaction caused a 7.8% drop within 10 hours. Long-term, the token remains in a bearish trend, having failed to break the $0.04 resistance and now nearing the $0.025 swing low. Technical indicators like the MACD and CMF support this negative outlook. Short-term gains were used as a selling opportunity, with liquidation levels swept above $0.03 before the reversal. Further price declines towards $0.0249 and potentially $0.020 are possible in the coming weeks.

The Kaspa [KAS] network’s Toccata hard fork was completed successfully on Tuesday, June 30. This upgrade introduces smart contract functionality while adding support for KRC-20 tokens.

The price of the KAS token rallied 20.38%, from a low of $0.0266 on Thursday, June 25, to $0.032 on the day of writing. This price surge likely came as a result of speculators and traders positioning themselves for the hard fork.

However, the altcoin has shed 7.8% within 10 hours of trading. What should KAS traders expect next?

The Kaspa long-term price downtrend

Source: KAS/USDT on TradingView

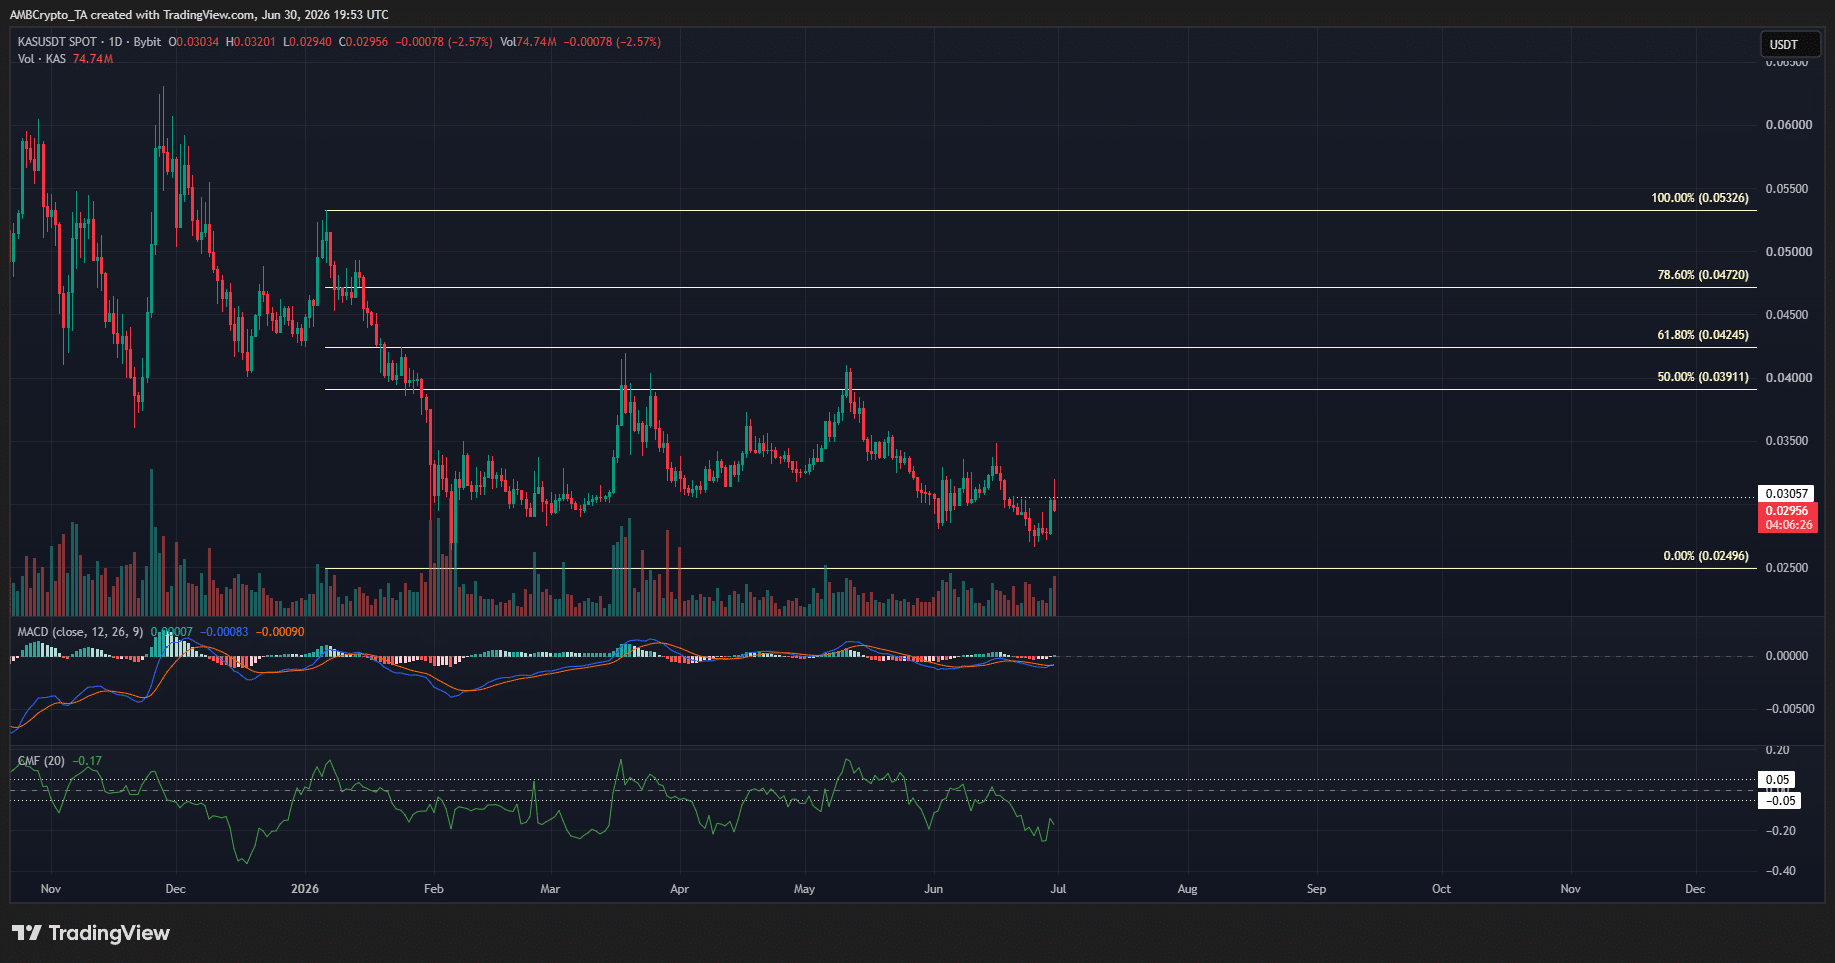
On the 1-day timeframe, the structure of Kaspa has been steadily bearish. The latest bearish leg was made earlier in 2026, from $0.0532 to $0.0249. Since February, KAS has lacked a decisive long-term trend and has twice managed to challenge the $0.04 supply zone.

It was rebuffed in March and May, and the market-wide sell-offs in the past two months have pushed KAS closer to the $0.025 swing low.

The MACD was moving below the zero line to show bearish market momentum. Meanwhile, the CMF was at -0.17, well below the -0.05 threshold that signals significant capital outflows.

The price structure and technicals agree on a bearish long-term outlook.

Traders’ call to action- Sell the news event confirms bearish sentiment

Source: KAS/USDT on TradingView

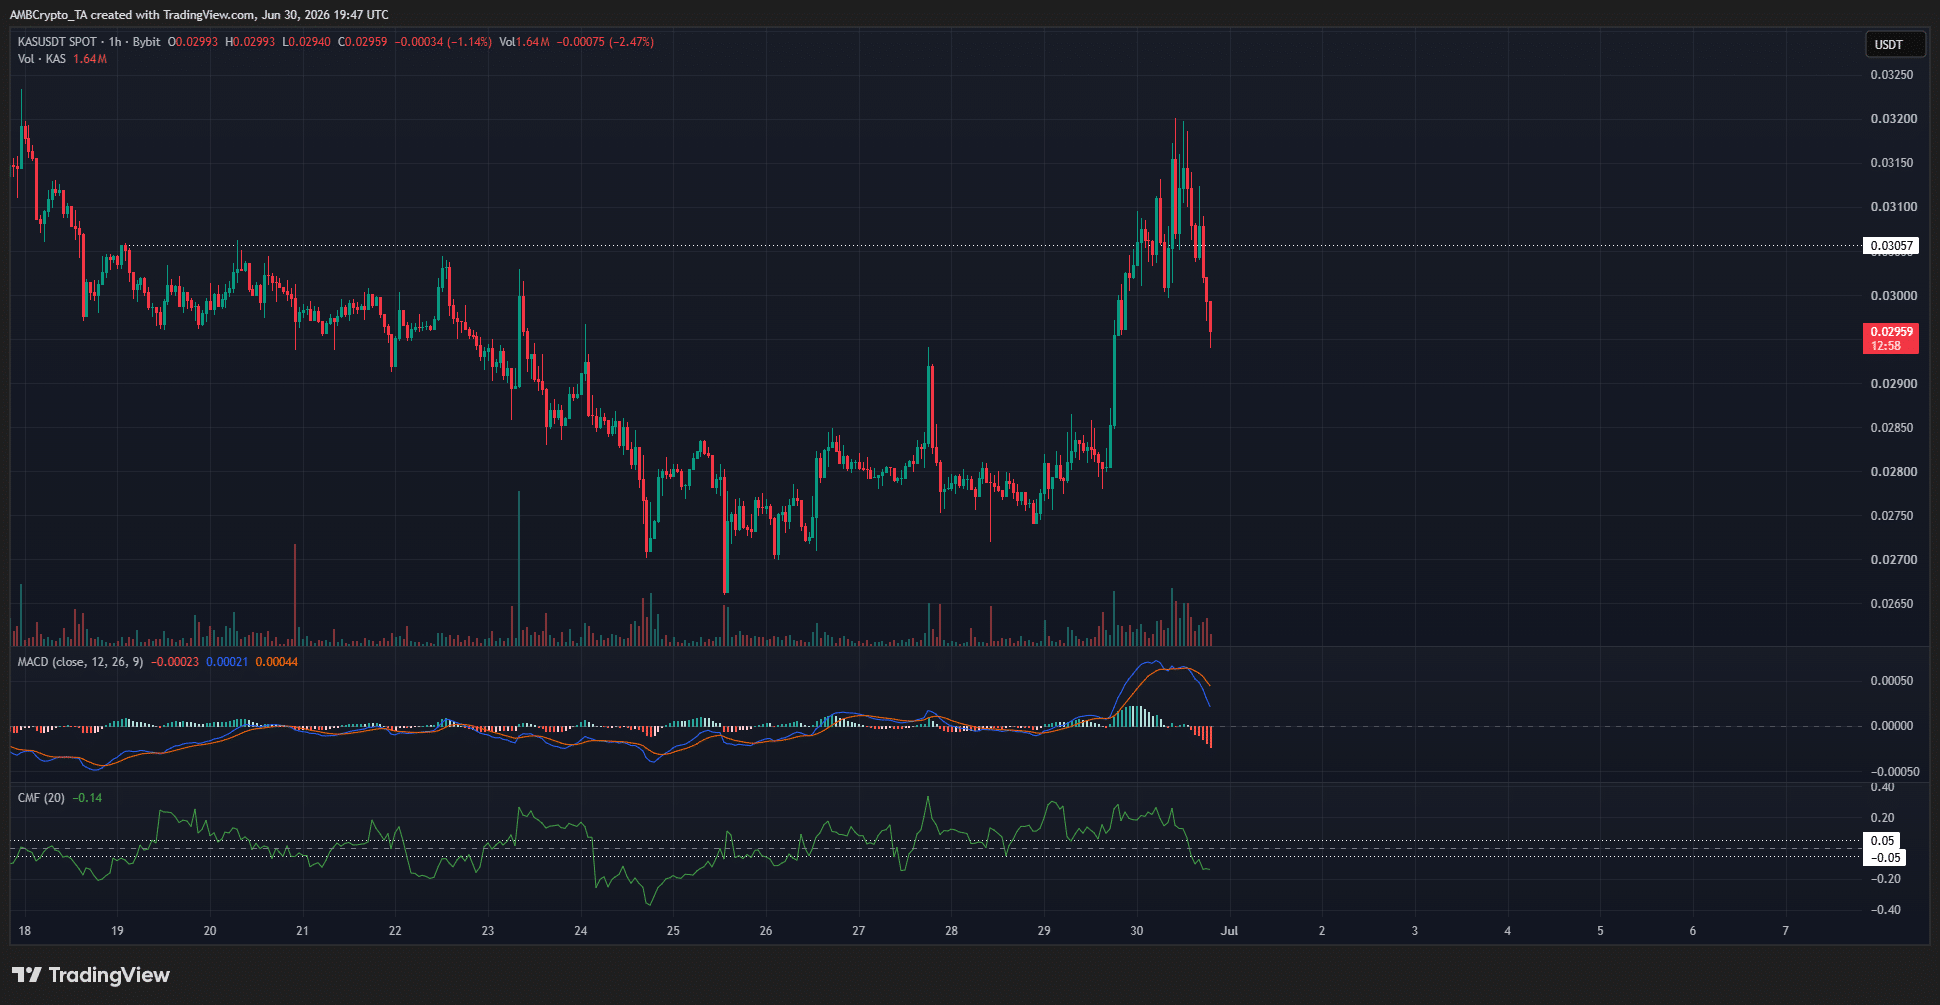
On the 1-hour timeframe, the recent gains tilted the MACD briefly in bullish favor, and the CMF also signaled increased buying pressure over the past five days. The $0.03 local resistance was overcome briefly as the hardfork got closer to going live.

In recent hours, the swift sell-off confirmed that the short-term gains were only used as a selling opportunity.

Source: CoinGlass

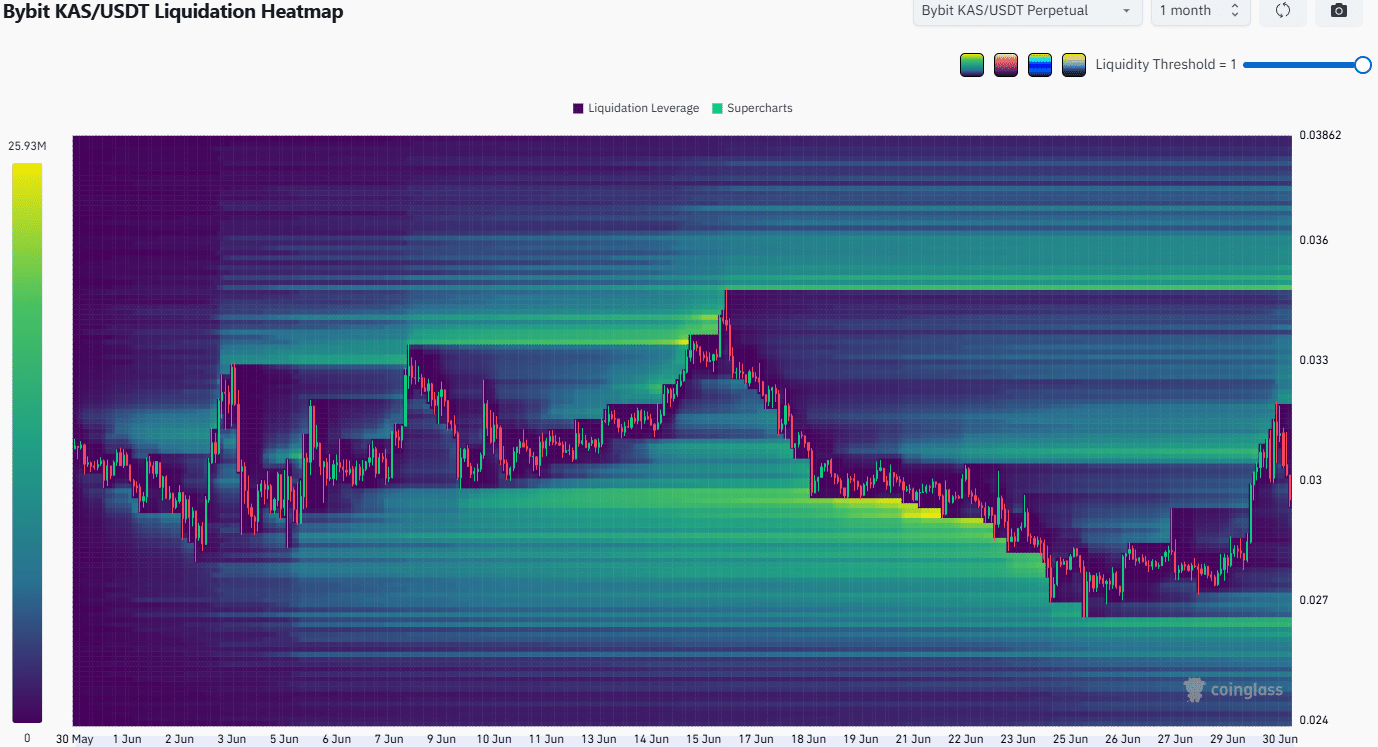
The liquidation heatmap also noted a build-up of short liquidation levels just above the $0.03 round-number resistance. The price move above swept this magnetic zone neatly and has already begun to reverse.

In the coming days and weeks, a price drop to $0.0249 and $0.020 was a possibility swing traders and investors must be prepared for.


Final Summary

  • The recent Kaspa token price gains were part of a sell-the-news type event as the Tocatta Hardfork got closer.
  • The long-term price trend was bearish and a drop below the February 2026 swing low at $0.0249 appeared likely.

Related Questions

QWhat was the main purpose of the Kaspa network's Toccata hard fork, and when was it completed?

AThe Toccata hard fork introduced smart contract functionality and added support for KRC-20 tokens. It was completed successfully on Tuesday, June 30, 2026.

QHow much did the KAS token price rally in the days leading up to the hard fork, and what is cited as the likely reason?

AThe KAS token price rallied 20.38%, from a low of $0.0266 on June 25 to $0.032 around the time of the article's writing. This surge was likely due to speculators and traders positioning themselves ahead of the hard fork.

QWhat does the article describe as the long-term trend for Kaspa's price based on the 1-day timeframe analysis?

AThe article describes the long-term price trend as steadily bearish on the 1-day timeframe. The structure shows a lack of decisive trend since February 2026, with repeated failures to break the $0.04 supply zone, pushing the price closer to the $0.025 swing low.

QWhat key technical indicators mentioned in the article support the bearish long-term outlook for KAS?

AThe MACD (Moving Average Convergence Divergence) was below the zero line, indicating bearish momentum. The CMF (Chaikin Money Flow) was at -0.17, well below the -0.05 threshold, signaling significant capital outflows.

QAccording to the article, what is a potential price target for KAS in the coming days and weeks, and why did the recent price gains reverse?

AThe article suggests a potential price drop to $0.0249 and even $0.020 is a possibility. The recent price gains reversed because they were part of a 'sell-the-news' event, where the price surge before the hard fork was used as a selling opportunity, leading to a swift sell-off once the event occurred.

Related Reads

A Former ByteDance Employee's Account: How I Started with Two Pinduoduo Hard Drives and Made a 600% Profit with Seagate to Achieve Financial Freedom?

Summary: A former ByteDance employee describes how a personal observation led to a highly profitable investment in Seagate Technology ($STX). Needing hard drives for a personal data project in August, he noticed their prices on Pinduoduo were rising consistently. Investigating further using price-tracking tools, he confirmed a broader, sustained price increase for high-capacity HDDs. He traced this to surging AI demand, as data centers require massive, cost-effective storage for model training and data, favoring high-capacity enterprise HDDs like those from Seagate. This demand was squeezing consumer supply. After initial research and a small purchase, he waited for confirmation from institutional 13F filings. Seeing a clear multi-quarter trend of increasing institutional ownership in Seagate, he significantly increased his position. From an entry around $150, Seagate's stock price rose over sixfold to approximately $965. He attributes the success to a methodology of identifying anomalies in everyday life (e.g., product shortages/price hikes), researching the underlying structural cause, identifying the publicly-traded beneficiary, and using 13F data to confirm institutional interest over multiple quarters. He cautions that this was one successful case among others that failed and is not offering investment advice.

链捕手27m ago

A Former ByteDance Employee's Account: How I Started with Two Pinduoduo Hard Drives and Made a 600% Profit with Seagate to Achieve Financial Freedom?

链捕手27m ago

BTC Hits Its Lowest Point Since 2024, But Is It Still Not the Right Time to Buy the Dip?

**Summary:** Bitcoin (BTC) has plunged to new lows in 2024, dropping over 50% from its all-time high to around $57,800, while Ethereum and Solana also show significant weakness. The market sentiment is at "extreme fear." The primary headwinds are identified as massive and sustained net outflows from US spot Bitcoin ETFs since May 2026, creating significant selling pressure, and the evaporation of expectations for a US Federal Reserve interest rate cut in 2026, which makes holding cash and bonds more attractive than risk assets like crypto. Analysts are actively debating the potential bottom. Key predictions include: * **glassnode's Rafael:** Suggests a bottom between $46,000 and $54,000, based on on-chain metrics like Realized Price and CVDD. He notes that institutional demand (via ETFs) is currently a net seller, not a buyer. * **BIT Analysis:** Argues the bear market is in its final stage, with a potential bottoming zone between $50,000 and $55,000, possibly aligning with the 2026 FIFA World Cup period (June-July). * **Wintermute:** Believes the market is in the late stages of a bear market but cautions the true bottom may not arrive until September-October 2026, contingent on renewed capital inflows. * **Liquid Capital's JackYi:** Posits that July-August 2026 could be the final capitulation and the best accumulation window, with potential bottom prices ranging from $51,000 to $43,000. * **Jiang Zhuo'er (BTC.TOP):** Predicts a bottom between $42,000 and $44,000 in October-December 2026, based on cycle analysis and MSTR's mNAV metric. * **Prediction Markets:** Polymarket data indicates a 79% chance BTC falls below $55,000 in 2026, a 65% chance below $50,000, and a 30% chance below $40,000. The consensus is that while bearish conditions are severe, the exact timing and price level of the ultimate bottom remain uncertain and depend on factors like ETF flows, macroeconomic policy, and potential market shocks.

Foresight News27m ago

BTC Hits Its Lowest Point Since 2024, But Is It Still Not the Right Time to Buy the Dip?

Foresight News27m ago

YouTube Crypto Channel Views Drop 70% by 2026, Retail Attention Crisis Reshaping Next Cycle

Major cryptocurrency YouTube channels are experiencing a severe decline in viewership, signaling a potential crisis in retail investor attention for the next market cycle. Analysis of six top channels shows monthly view counts have plummeted 27% to 79% compared to January 2025, with four channels down approximately 75%. While subscriber counts remain high (e.g., Coin Bureau with 2.72M, Altcoin Daily with 1.65M), current engagement tells a different story. Recent 30-day view counts are significantly lower: Coin Bureau at 1.24M views, Crypto Banter at 1.06M, with Altcoin Daily and Benjamin Cowen performing relatively better at 1.79M and 1.8M respectively. The core issue is that subscriber numbers are cumulative and reflect past interest, while views measure current demand. The dramatic drop indicates a fragmented and more selective retail audience. This contrasts sharply with the 2021 bull market, where channels reportedly garnered 3-4 million daily views. Now, daily views for major channels range from roughly 35,000 to 60,000. This divergence suggests a new type of market cycle. Bitcoin's price can be sustained by ETFs and institutional activity, but without strong retail engagement via content channels, the dynamics of the next bull run will be fundamentally different. The real signal for a retail resurgence will be a sustained increase in daily and monthly view counts, not subscriber growth. If viewership fails to recover, long-form YouTube content may become a lagging indicator, with retail attention shifting to other, faster formats.

marsbit2h ago

YouTube Crypto Channel Views Drop 70% by 2026, Retail Attention Crisis Reshaping Next Cycle

marsbit2h ago

Trading

Spot
活动图片