What The Current Dogecoin Momentum Means For The Meme Coin’s Price

bitcoinistPublished on 2026-03-23Last updated on 2026-03-23

Abstract

Despite surface-level weakness, a new technical analysis reveals a hidden bullish divergence in Dogecoin's price structure. Crypto analyst Javon Marks notes that while DOGE's price has been forming higher lows since early 2026, its momentum indicators have been making lower lows—a classic bullish signal. This suggests sellers are losing control. DOGE has held above the key $0.09 support for over a month, maintaining its higher-low sequence. The RSI has declined to levels similar to those seen before its 2023-2024 rally. If the $0.09 support holds, this divergence could potentially trigger a 350% rally, pushing DOGE above $0.44.

A new technical reading shows that Dogecoin’s price structure is not as weak as the surface-level price action might imply. In a recent post on X, crypto analyst Javon Marks pointed to a hidden bullish divergence forming on Dogecoin’s chart. The idea comes at a time when DOGE has been creating interesting low structures since the beginning of the year and momentum indicators are at multi-year lows across the altcoin market.

A Divergence Hidden in Plain Sight

While Dogecoin’s price has been carving lows since early 2026, its momentum oscillator has been registering lower lows over the same period. This split behavior, which was noted by crypto analyst Javon Marks, where price and momentum move in opposing directions, is the definition of hidden bullish divergence.

The chart is showing that even though momentum readings look weaker on paper, Dogecoin itself has not broken down in the same way. That disconnect can suggest that sellers are losing control beneath the surface. The 8-day candlestick price chart below shows that DOGE has been holding above a broad support zone around the $0.09 region for the past five or six weeks, maintaining a sequence of higher lows.

Below that price action are the oscillator and RSI panels, which are both showing descending lows, marked out as a bearish-looking momentum trend that has not translated into a matching collapse in price. That mismatch is what gives the divergence its bullish interpretation, and the outlook in this case is a bullish run to yearly highs.

The RSI has declined into the high 30s to low 40s range, a region shaded in pink on the chart, which aligns with levels seen during the accumulation phase of 2023 and early 2024 before Dogecoin’s major rally
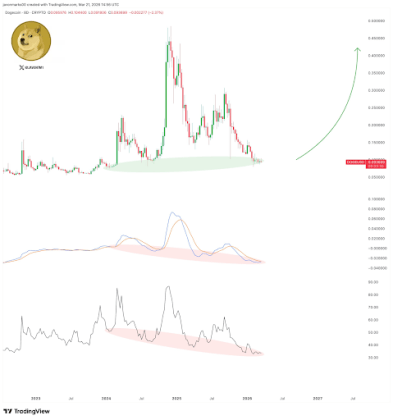
Dogecoin Price Chart. Source: @JavonTM1 On X

Room For A Move Above $0.44

The chart above also shows why the current area around $0.09 matters so much. Dogecoin has spent recent months bleeding from its late-2024 and early-2025 highs, but that descent has now slowed into a tight cluster of candles near the same support shelf at $0.09.

The Dogecoin price is no longer falling in the same way seen during the first two months of 2026 but is now stabilizing. As long as Dogecoin continues to defend that $0.09 range and avoids losing its higher-low structure, the case for a continuation move will still be alive.

The most ambitious part of the analysis is the upside projection. According to Marks, the continuation implied by this hidden bullish divergence could send Dogecoin on a rally of more than 350%. Projecting this percentage gain would see the Dogecoin price breaking above $0.44.

DOGE bears keep pushing price down | Source: DOGEUSDT on Tradingview.com

Trending Cryptos

Related Questions

QWhat does the hidden bullish divergence on Dogecoin's chart indicate according to crypto analyst Javon Marks?

AIt indicates that while Dogecoin's price has been holding above a key support level and forming higher lows, its momentum oscillator has been making lower lows. This divergence suggests sellers are losing control and a potential bullish run to yearly highs is possible.

QWhat is the critical price support level that Dogecoin has been holding above, as mentioned in the analysis?

ADogecoin has been holding above a broad support zone around the $0.09 region for the past five or six weeks.

QWhat does the current RSI level for Dogecoin align with, based on its historical performance?

AThe RSI has declined into the high 30s to low 40s range, which aligns with levels seen during the accumulation phase of 2023 and early 2024 before Dogecoin's major rally.

QWhat is the potential price target for Dogecoin if the bullish continuation move occurs?

AAccording to the analysis, the continuation could send Dogecoin on a rally of more than 350%, projecting a price break above $0.44.

QHow has Dogecoin's price action changed in 2026 compared to its previous trend?

AWhile Dogecoin was bleeding from its late-2024 and early-2025 highs initially in 2026, its descent has now slowed and it is stabilizing, no longer falling in the same way as it did during the first two months of the year.

Related Reads

Why Bitcoin Holds Above $64,000 After Fed's Hard Pause

**Bitcoin Stabilizes Near $64,000 Following Hawkish Fed Pause** The cryptocurrency market, led by Bitcoin, remained stable around $64,000 despite a volatile reaction to the latest U.S. Federal Reserve meeting. The Fed paused interest rates but signaled a hawkish stance, with three committee members voting for an increase—the highest dissent since 2016. This limits risk appetite but hasn't triggered panic selling. Key market highlights include Bitcoin ETFs seeing a net inflow of $32.1 million, breaking a streak of outflows, while Ethereum ETFs experienced outflows of $18.65 million. Liquidations affected about 90,000 traders. Technically, Bitcoin finds support around $63,000-$63,500, with major resistance near $66,000. While its price is about 49% below its all-time high, institutional demand via ETFs and the absence of mass capitulation support a potential recovery scenario in the second half of the year. Major altcoins showed mixed movements, with Solana attracting capital while Ethereum faced selling pressure despite strong on-chain metrics like a growing staking queue. Regulatory news took a pause as the U.S. Senate delayed the CLARITY Act vote until at least autumn. For the final trading day of July, U.S. inflation and consumer spending data will be crucial. Bitcoin's key levels to watch are $63,000 support and $66,000 resistance. Sustained ETF inflows and Bitcoin holding above $63,000 are seen as positive signs for a potential market recovery later in the year.

cryptonews.ru3h ago

Why Bitcoin Holds Above $64,000 After Fed's Hard Pause

cryptonews.ru3h ago

Trading

Spot

Hot Articles

Discussions

Welcome to the HTX Community. Here, you can stay informed about the latest platform developments and gain access to professional market insights. Users' opinions on the price of MEME (MEME) are presented below.

活动图片