These Key Ethereum Metrics Point To A Potential Liquidity Trap – What To Know

bitcoinistPublished on 2026-03-21Last updated on 2026-03-21

Abstract

Ethereum has turned bearish following the Fed meeting but remains above $2,100. Key on-chain metrics suggest a potential liquidity trap, as large holders (whales) are closing long positions and opening shorts, while retail traders aggressively open long positions. This divergence indicates weakening underlying strength despite surface-level price firmness. Analysts note that recent buying pressure was absorbed by sell-side liquidity, and significant long buildups point to key liquidation levels near $1,850. Ethereum recently filled a CME gap at $2,117, which now acts as a support level. A rebound occurs, the next target could be around $2,686, which would fill another CME gap.

Ethereum has flipped bearish following the market’s reaction to the Federal Reserve (Fed) meeting, but its price remains firm above the $2,100 level. Given the bearish conditions, the market dynamics of ETH are starting to shift as key metrics signal a possible liquidity trap ahead at current levels.

An Ethereum Liquidity Trap Signal Emerges

After recent price action, an on-chain indicator is triggering fresh concerns around Ethereum and its market dynamics. These kinds of signals are typically seen during volatile periods and could play a crucial role in shaping the altcoins’ next price trajectory in the short term.

Combining signals from multiple metrics, Boris, a crypto trader and on-chain analyst, has outlined the potential formations of a liquidity trap for ETH. Even though price activity may seem stable on the surface, underlying data indicate that liquidity is being concentrated in a way that could surprise traders.

As ETH’s price climbed toward the $2,400 level, the Whale Vs Retail Delta continued to move into negative territory. This trend underscores a key divergence in activity between large holders and smaller investors in the market. Simply put, large holders or whales are reducing their relative activity or exposure, while small traders are becoming more active in the market.
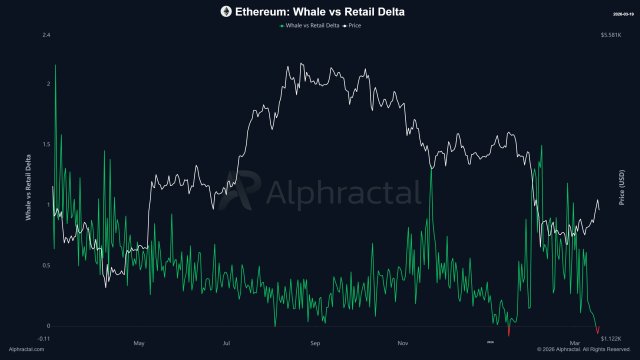
Source: Chart from Boris on X

Currently, whale investors are closing their long positions in Ethereum and opening more short positions. Meanwhile, retail holders are doing the opposite as they aggressively open long positions. When institutional players retreat while retail engagement increases, this imbalance frequently indicates a shifting mood under the surface. A trend of this kind is considered a classic liquidity illusion.

Boris highlighted that buying pressure saw robust strength for a period, but those buys were absorbed by sell-side liquidity. As a result, the market has entered a cooling phase. Historically, the current market setup hints at further downside pressure.

Adding to the market trend is the ETH Liquidation Levels metric. Data shows a significant long buildup over the past month, with key liquidity targets at $1,850 and below. While the price is moving up, the market is clearly demonstrating weakening strength underneath.

ETH Closes Recent CME Gap

Ethereum’s recent price action was met with a CME Gap. However, CW, a market expert and investor, reported that the leading action has filled the gap, which was located at $2,117. As the market tries to correct inefficiencies, these gaps, which are frequently created during times of intense price movement, may serve as magnets for subsequent price action.

After closing the gap, a buy wall has been formed around $2,100, and this level aligns with the Fibonacci level of 0.382. If a rebound occurs after reaching the $2,100 level, the next target is around $2,686, a price that corresponds to the 0.382 fib level. Meanwhile, if ETH rises to this level, another CME gap ahead will be filled.

ETH trading at $2,145 on the 1D chart | Source: ETHUSDT on Tradingview.com

Trending Cryptos

Related Questions

QWhat key Ethereum metric is signaling a potential liquidity trap according to the article?

AThe Whale Vs Retail Delta moving into negative territory, indicating whales are reducing activity while retail traders are becoming more active.

QWhat are the two key liquidity targets mentioned for ETH below current price levels?

A$1,850 and below.

QWhat significant price level did Ethereum recently fill according to the CME gap analysis?

A$2,117.

QWhat is the next potential price target for ETH if it rebounds from the $2,100 support level?

AAround $2,686, which corresponds to the 0.382 Fibonacci level.

QWhat trading activity are whale investors currently engaged in with Ethereum according to the on-chain data?

AWhales are closing their long positions and opening more short positions.

Related Reads

Why Bitcoin Holds Above $64,000 After Fed's Hard Pause

**Bitcoin Stabilizes Near $64,000 Following Hawkish Fed Pause** The cryptocurrency market, led by Bitcoin, remained stable around $64,000 despite a volatile reaction to the latest U.S. Federal Reserve meeting. The Fed paused interest rates but signaled a hawkish stance, with three committee members voting for an increase—the highest dissent since 2016. This limits risk appetite but hasn't triggered panic selling. Key market highlights include Bitcoin ETFs seeing a net inflow of $32.1 million, breaking a streak of outflows, while Ethereum ETFs experienced outflows of $18.65 million. Liquidations affected about 90,000 traders. Technically, Bitcoin finds support around $63,000-$63,500, with major resistance near $66,000. While its price is about 49% below its all-time high, institutional demand via ETFs and the absence of mass capitulation support a potential recovery scenario in the second half of the year. Major altcoins showed mixed movements, with Solana attracting capital while Ethereum faced selling pressure despite strong on-chain metrics like a growing staking queue. Regulatory news took a pause as the U.S. Senate delayed the CLARITY Act vote until at least autumn. For the final trading day of July, U.S. inflation and consumer spending data will be crucial. Bitcoin's key levels to watch are $63,000 support and $66,000 resistance. Sustained ETF inflows and Bitcoin holding above $63,000 are seen as positive signs for a potential market recovery later in the year.

cryptonews.ru2h ago

Why Bitcoin Holds Above $64,000 After Fed's Hard Pause

cryptonews.ru2h ago

Trading

Spot

Hot Articles

Discussions

Welcome to the HTX Community. Here, you can stay informed about the latest platform developments and gain access to professional market insights. Users' opinions on the price of ETH (ETH) are presented below.

活动图片















