Solana Tests $80 Support as Futures Data Signals Rising Liquidation Risk

bitcoinistPublished on 2026-02-19Last updated on 2026-02-19

Abstract

Solana (SOL) is testing the critical $80 support level amid increasing liquidation risks in futures markets. Derivatives data shows leveraged long positions unwinding, with falling open interest and negative funding rates indicating weakening short-term confidence. A break below $80 could expose lower supports near $75 or even $60–$70. Technical patterns suggest further downside risk, with targets as low as $50–$57. Despite oversold RSI conditions hinting at possible rebounds, momentum remains bearish. Resistance is clustered between $83–$90. On-chain sentiment has cooled, with declining social activity and speculative interest. Long-term fundamentals remain strong, however. Real-world asset (RWA) value on Solana grew 59% quarter-over-quarter to $1.1 billion, driven by institutional products like tokenized treasuries. Total value locked is nearing $10 billion, reflecting continued growth in tokenized finance. The market’s direction hinges on whether $80 support holds or breaks.

Solana’s (SOL) latest price action is drawing increased attention from traders as derivatives data and technical indicators converge around a critical level.

With SOL trading near $80 after a sharp decline, futures markets are showing signs of stress, while broader ecosystem developments present a contrasting longer-term narrative. The coming sessions may determine whether the current pullback stabilizes or evolves into a deeper correction.
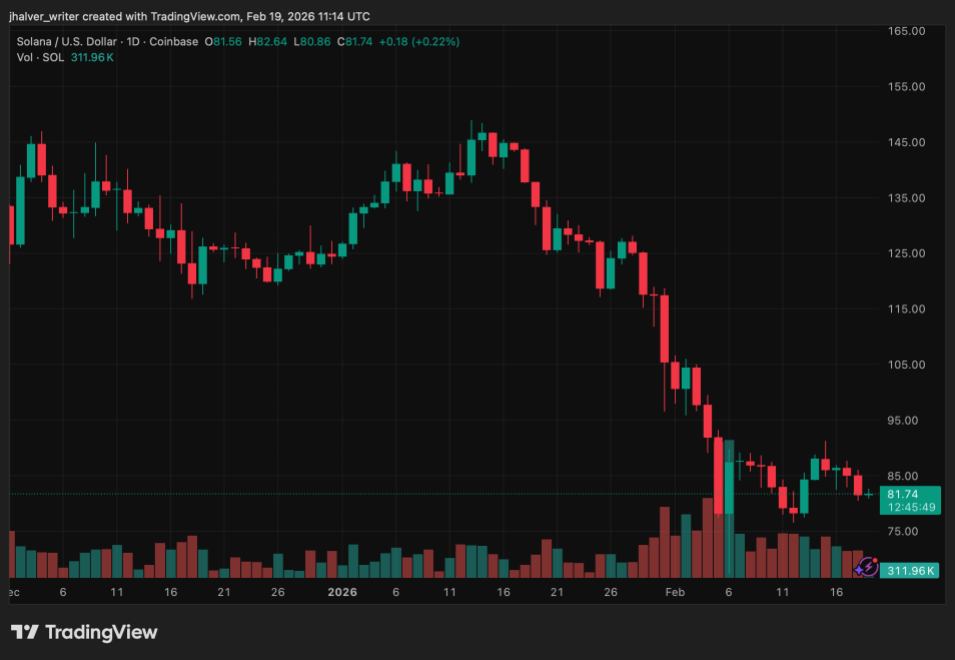
SOL's price trends to the downside on the daily chart. Source: SOLUSD on Tradingview

Futures Market Pressure Builds Around Key Support

Recent derivatives data show mounting liquidation risk as leveraged bullish positions unwind. According to market analytics, falling open interest alongside negative funding rates suggests traders are closing positions rather than adding new exposure. This typically signals weakening confidence in short-term price recovery.

As SOL approaches the psychologically important $80 mark, long liquidations have accelerated. Forced selling in futures markets can amplify downward moves, creating a feedback loop where declining prices trigger additional liquidations.

Analysts note that a confirmed break below $80 could expose lower support zones near $75 and potentially the $70–$60 range if bearish momentum persists.

Technical structures reinforce the cautious outlook. A weekly head-and-shoulders pattern and a developing bear flag on lower timeframes both point to downside risks, with some projections targeting the $50–$57 region if support fails.

Mixed Signals From Technical Indicators and Market Sentiment

Despite persistent selling pressure, some indicators suggest the market may be nearing exhaustion. RSI readings hover close to oversold territory, historically a zone where short-term rebounds can occur. However, momentum indicators and trend strength measurements still favor sellers.

Funding rates turning negative also reveal a shift in positioning, with short exposure increasing across derivatives markets. Data referenced by Santiment shows declining social activity and fading speculative interest compared with 2025 highs, reflecting cooler sentiment across the Solana ecosystem.

Short-term resistance remains clustered between $83 and $90, while failure to reclaim those levels keeps the broader downtrend intact.

Institutional Growth Offers Longer-Term Support

While price action remains fragile, network fundamentals continue to show expansion.

Research from Messari indicates that RWA value on Solana grew nearly 59% quarter-over-quarter to reach $1.1 billion. Much of the increase has been driven by tokenized treasury products, including funds linked to BlackRock and yield products from Ondo Finance.

Total value locked on the network is also approaching $10 billion, highlighting continued institutional experimentation with tokenized finance despite market volatility.

For now, traders remain focused on whether buyers defend the $80 level. A successful hold could stabilize sentiment and reduce liquidation pressure, while a decisive breakdown may set the stage for another wave of selling across the Solana market.

Cover image from ChatGPT, SOLUSD chart on Tradingview

Trending Cryptos

Related Questions

QWhat critical price level is Solana (SOL) testing according to the article, and why is it significant?

ASolana is testing the $80 support level. It is significant because it is a psychologically important mark, and a confirmed break below it could expose lower support zones and potentially lead to a deeper correction with increased liquidation risk.

QWhat do the recent derivatives data (falling open interest and negative funding rates) suggest about trader behavior?

AFalling open interest alongside negative funding rates suggests that traders are closing their leveraged bullish positions rather than adding new ones. This signals weakening confidence in a short-term price recovery.

QDespite the bearish price action, what longer-term fundamental development offers support narrative for Solana?

AThe value of Real-World Assets (RWA) on Solana grew nearly 59% quarter-over-quarter to reach $1.1 billion, driven by institutional products like tokenized treasuries from BlackRock and Ondo Finance. The Total Value Locked (TVL) is also approaching $10 billion.

QWhat are the potential downside price targets if the $80 support level fails to hold?

AIf the $80 support level fails, it could expose lower support zones near $75 and potentially the $70–$60 range. Some technical projections based on chart patterns even target the $50–$57 region.

QWhat mixed signals do technical indicators provide regarding a potential market rebound?

AWhile the RSI is nearing oversold territory, which has historically been a zone for short-term rebounds, other momentum indicators and trend strength measurements still favor sellers, indicating the downward pressure may not be over.

Related Reads

Bitcoin Boom in Full Swing: Saylor's Latest Statement Fuels Buying Speculation

MicroStrategy's Executive Chairman Michael Saylor has fueled speculation about a new Bitcoin purchase by posting "Bitcoin Drive engaged" on August 2, accompanied by the company's customary purchase tracker. This aligns with his pattern of hinting at treasury changes ahead of weekly reports. The accompanying report showed MicroStrategy's Bitcoin holdings at 843,775 BTC, with an average cost of $75,653 per coin and an unrealized loss of -$10.58B. A similar signal preceded the company's July 27 announcement, strengthening expectations for a treasury update on Monday. However, MicroStrategy's real-time ledger reflects two recent Bitcoin sales totaling 3,588 BTC, reducing holdings from 847,363 BTC to the current 843,775 BTC. The company stated these sales funded preferred stock dividends and replenished its U.S. dollar reserve. Recent reports indicate the company made no Bitcoin purchases the week ending July 26 while increasing its dollar reserve to approximately $3.75B. The company faces financial headwinds after reporting an $8.33B operating loss for Q2 2026, including an $8.32B unrealized loss on its digital assets. Management may sell up to $1.25B more in Bitcoin to meet cash obligations. The expected Monday update will reveal if the "Bitcoin Drive" signal marks a return to accumulation as MicroStrategy balances its massive Bitcoin stash against growing cash commitments.

cryptonews.ru2h ago

Bitcoin Boom in Full Swing: Saylor's Latest Statement Fuels Buying Speculation

cryptonews.ru2h ago

Trading

Spot

Hot Articles

Discussions

Welcome to the HTX Community. Here, you can stay informed about the latest platform developments and gain access to professional market insights. Users' opinions on the price of SOL (SOL) are presented below.

活动图片